
Homework Question
- Explain Price Bars in your own words. How to add these price bars on Chart with proper screenshots?
- How to identify trends using Price Bars. Explain for both trend. (Screenshots required)
- Explain the Bar Combinations for Spending the Day inside for both conditions. (Screenshots required)
- Explain the Bar Combinations for Getting outside for the Day for both conditions. (Screenshots required)
- Explain the Bar Combinations for Finding the close at the open for both conditions in each trend. (Screenshots required)
- Conclusion
Introduction
Happy New Year Steemians , I will be responding to Home task given by professor @sachin08 , Thank you for your awesome teaching on "Reading Special Bar Combinations" below is my home task.

- Explain Price Bars in your own words. How to add these price bars on Chart with proper screenshots?

Price movement of an asset are represented in so many format example:bars,candlesticks, lines, hollow candles etc and it is used to determine the movement of an asset either uptrend or downtrend.
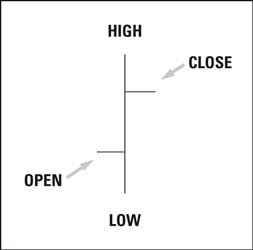
The Price bars is one of the tools used to represent the price movement of an assets over a given period of time the movement is affect by rise and fall in the value. Price bar is made of special features that assist the trader in making a better trading decision in crypto world . Price bar is made of lines (vertical and horizontal lines).
Importance of price bar
- To determine the perfect time to buy
- To determine the perfect time to sell
- To understand market movement (uptrend or downtrend)
- To know if a market is trend continuity or trend reversal.
Component of a price bar
Price bar is made of both
- horizontal and
- vertical lines.
Price bar are usually of green color which means an uptrend but when the bar is red it signifies a downtrend .
- The horizontal line on left hand side is known as the Open.
- The horizontal line on right hand side is known as the Close
- The tip top of the price bar is known as the High .
- The tip bottom of the price bar is known as the Low.
How to add a price bars
Steps involved in adding a price bar on chart :
- Step 1:
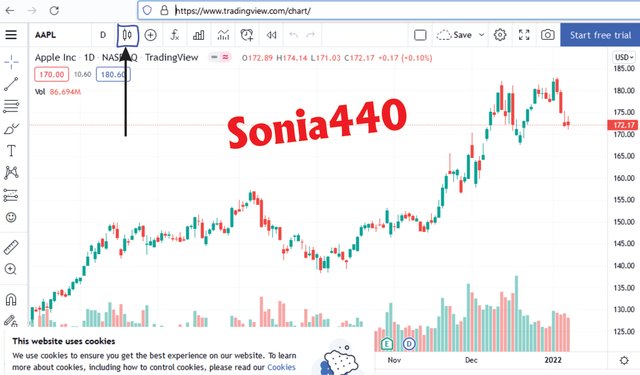
Open tradingview.com and Locate the chart interface.
On the chart interface click on candlestick Icon.
- Step 2:
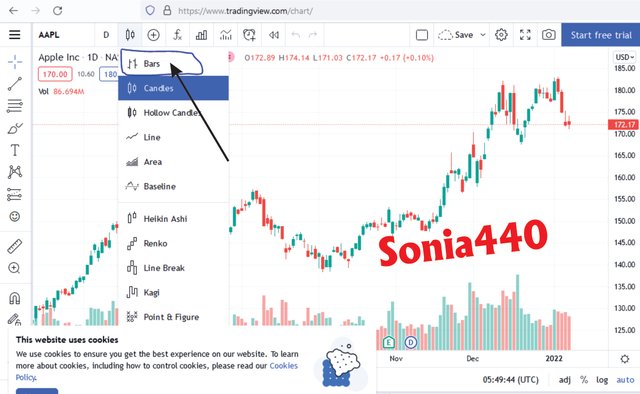
A dropped down box will appear showing the list of bar to choose from. Click on bar.
- Step 3:
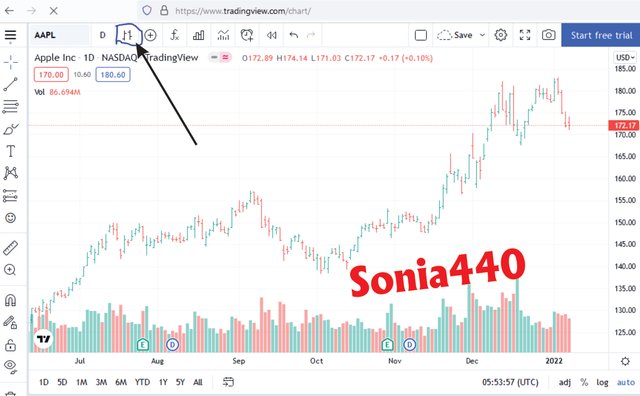
Below is how it will look like when you succesfully change to bar line .

- How to identify trends using Price Bars. Explain for both trend. (Screenshots required)

Price bar is determined by upward or downward movement of the price of an assets. We have series of movements made by price bar and they are as follows:
- The higher high movement: This is when the high of the new bar formed is higher than the high of the last bar.
- The higher low movement: This is when the low of the new bar is higher than the low of the last bar.
- The lower high movement: This is when the high of the new bar is lower than the high of the last bar.
- The lower low movement: This is when the low of the new bar is lower than the low of the last bar.
Types of price movement:
- Uptrend or Bullish Movement
- Downtrend or Bearish Movement
Upward trend.
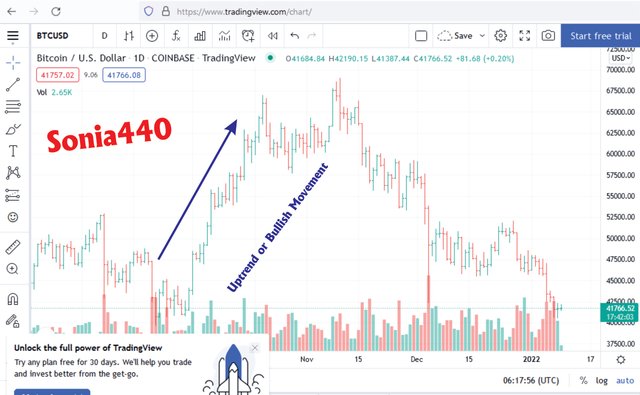
Uptrend or bullish trend movement is the upward movement of the price of an assets, In this movement their is formation of higher highs and higher lows which indicate that the market is undergoing an uptrend movement. in making higher highs movement the movement will experience few number of lower highs and lower lows but more of higher highs movement which shows an an upward trend movement.
From the image below is the movement of BTCUSDT in an upward trend movement. We can observe the higher highs and higher low movement of the price bars and also few number of lower lows and lower highs of some bars within the upward trend movement.
Downward trend.
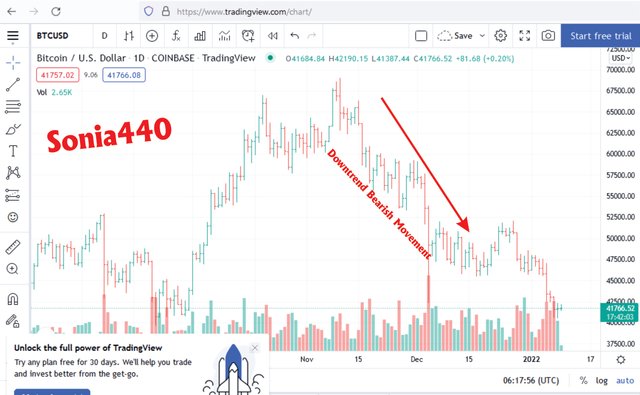
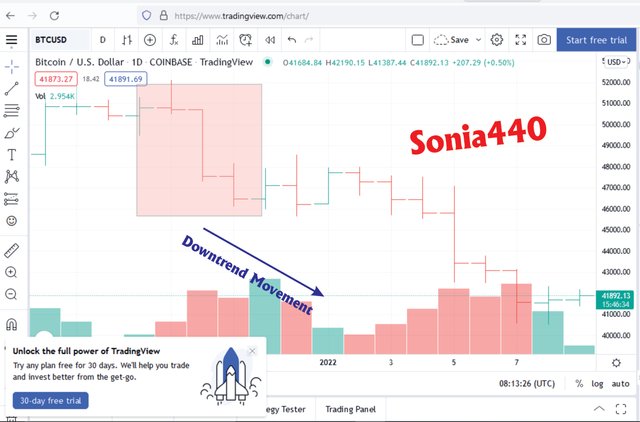
Downtrend or bearish trend movement is the downward movement of the price of an assets, In this movement their is formation of lower highs and lower lows which indicate that the market is undergoing an downtrend movement. in making lower highs and lower lows movement the movement will experience few number of higher highs and higher but more of lower highs and lower lows movement which shows an an downward trend movement.
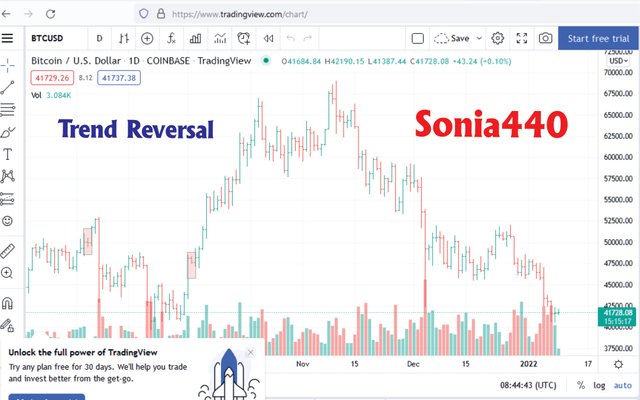
From the image below is the movement of BTCUSDT in an downward trend movement. We can observe the lower lows and lower highs movement of the price bars and also few number of higher highs and higher low of some bars within the downward trend movement.

- Explain the Bar Combinations for Spending the Day inside for both conditions. (Screenshots required)

Price bar is one unique tool traders use to analyze the market and in this session I will be talking about bar combination for spending the day inside.
Spending the day inside condition is where the new bar is seen inside the previous bar for the day in a nutshell it is when the bar of the previous bar high and low is seen in the former price bar of the day before and this price movement portrays uncertainty, it can take place in uptrend or downtrend movement. The inside day bar combination has a distinctive features and they are as follows :
- The former high bar must be higher than the new one formed or the high bar of the new bar formed must be lower than the high of the old bar.
- The low bar of the new bar must be higher than the low of the last bar.
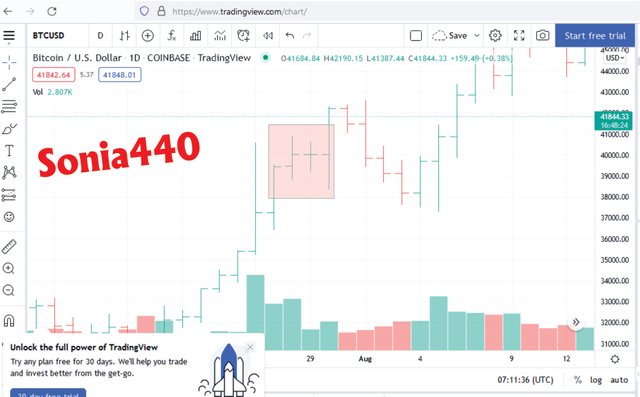
Closing day inside a bullish price
From the image above (BTCUSDT chart), I discovered that the highlighted bar spent the day inside a bullish bar.
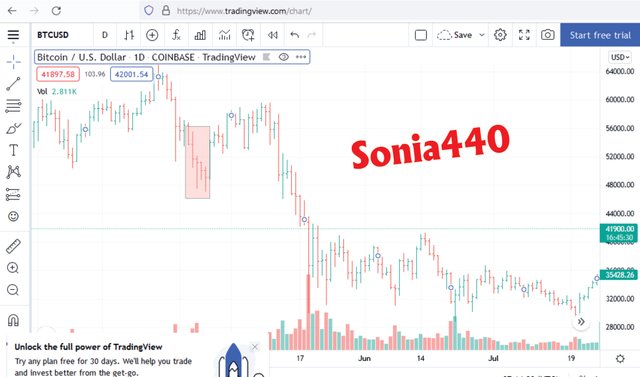
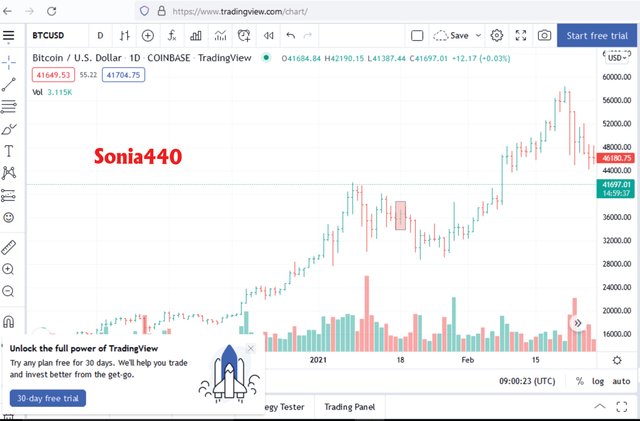
Closing day inside a bearish price
From the image above (BTCUSDT chart), I discovered that the highlighted bar spent the day inside a bearish bar.

- Explain the Bar Combinations for Getting outside for the Day for both conditions. (Screenshots required)

The outside day bar combination is a condition where the radius high low of a bar is outside of the former bar. This implies that in the outside day bar combination, the new bar is seen outside the high-low range of the former bar. The outside day bar combination has a distinctive features and they are as follows :
The open of the new bar is located at the point of low and the close of the bar is seen at the region of the high. This can signify a trend reversal or continuation. If the trend is in reversal it show price movement was in a bearish trend but if the trend is continuation it shows price movement was in a bullish trend.
Open of the new bar formed is seen at the high while the close of the new bar formed is seen at the low. This can also signify trend reversal or continuation. If the trend is in reversal it show price movement was in a bullish trend but if the trend is continuation it shows price movement was in a bearish trend.
Bullish condition.
From the mage below (BTCUSDT chart), The highlighted part signifies outside day bar combinations where the bullish open bar is seen at the level of low and close is seen at the level of high which shows an upward movement.
Bullish condition.
From the mage below (BTCUSDT chart), The highlighted part signifies outside day bar combinations where the bearish open bar is seen at high high and close is at the level of low. The lower low bar signify the trend reversal.

- Explain the Bar Combinations for Finding the close at the open for both conditions in each trend. (Screenshots required)

We can identify the bar combination while looking at close and open in two different movement (bullish movement and bearish movement). Identifying the close at the open is seen where the open and the close bar are close together which means price movement of an assets is on a close range. So when open and close bar are near the low or high of the former bar it signifies trend continuation or reversal .
If we in a bullish trend and the open and close are closely related and they near the low of the next bar it signifies trend reversal from bullish to bearish price movement but if the open and close are seen close to the high it signifies trend continuation in the bullish price movement.
And in a bearish movement, if the open and close closely related and close to the low of the next bar it signifies a trend continuation but if they are close to the high following bar it signifies trend reversal.
Bullish trend reversal
From the mage below (BTCUSDT) the highlighted region shows that the open and close are in a close range near to the low of the next bar and this signifies trend reversal of the bullish movement to a bearish movement.
Bearish trend reversal
From the mage below (BTCUSDT) the highlighted region shows that the open and close are in a close range near to the high of the next bar and this signifies trend reversal of the bearish movement.

Conclusion
In this lecture I was able to understand what special-bar-combinations is all about and how to read them and we can use inside day, outside day and finding the close at the open to know if trend reversal or continuation will take place. We have different means of representing price example: lines, bars and candlesticks etc .Price bar enable the traders to be able to predict the price movement and know the right time to enter and leave the market.
Am Thankful professor Professor @sachin08 for this wonderful lecture.


Hello @sonia440. Thank you for participating in Crypto Academy Season 5 Week 8 Beginner's Course.
You have edited the whole post after deadline.
Remark - Homework Task Disqualified
Downvoting a post can decrease pending rewards and make it less visible. Common reasons:
Submit