INTRODUCTION
Good day everyone,
It is a pleasure to participate in this season's first class. To this effect it is yet another opportunity to expand my knowledge in crypto and crypto trading.
This lecture on strategy and use of Donchain channels by prof. @lenonmc21 is an amazing one and below is my assignment in confirmation of my understanding of the lesson.

HOME WORK
- Explain and define in your own words what the Donchian Channels are?
- Does it explain in detail how Donchian Channels are calculated (without copying and pasting from the internet)?
- Explain the different types of uses and interpretations of Donchian Channels (With examples of bullish and bearish trades)?
- Make 1 inning using the "Donchian Channel Breakout Strategy" and make 1 inning using the "Reversal and Retracement Strategy". You must explain the step by step of how you analyzed to take your input and make them in a demo account so I can evaluate how the operation was taken.

Question 1
Explain and define in your own words what the Donchian Channels are?
Technical analysis are very useful tools when it comes to trading, in the sense that it helps traders predict the future by examining the past of a given market.
To be sincere, this is my first time of hearing about Donchian channel.
From my research about donchian channel, i discovered that donchian channel is an indicator developed by an expert by name Richard Donchian.
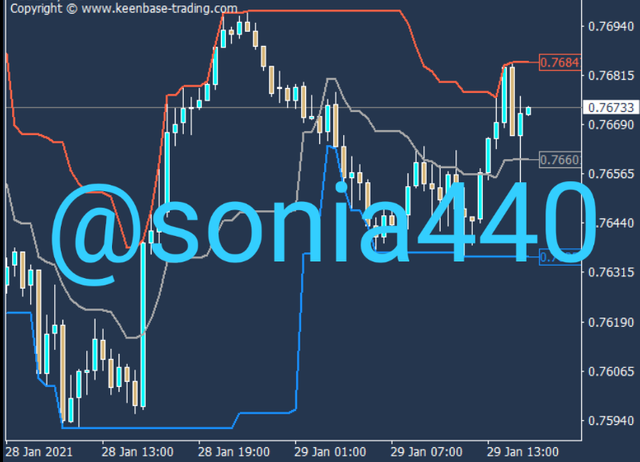
Donchian channel indicates an area that shows highest price and lowest price for a period of time.
With donchian channel, the volatility of a market can be measured holding to the fact that it has a structure that expands with the increase in price.
This indicator helps us determine when the market will return to the current trend and also indicate overbought situations.
Donchian channel is like the bollinger band but more rigid than the bollinger band.
How can you add Donchian channel indicator?
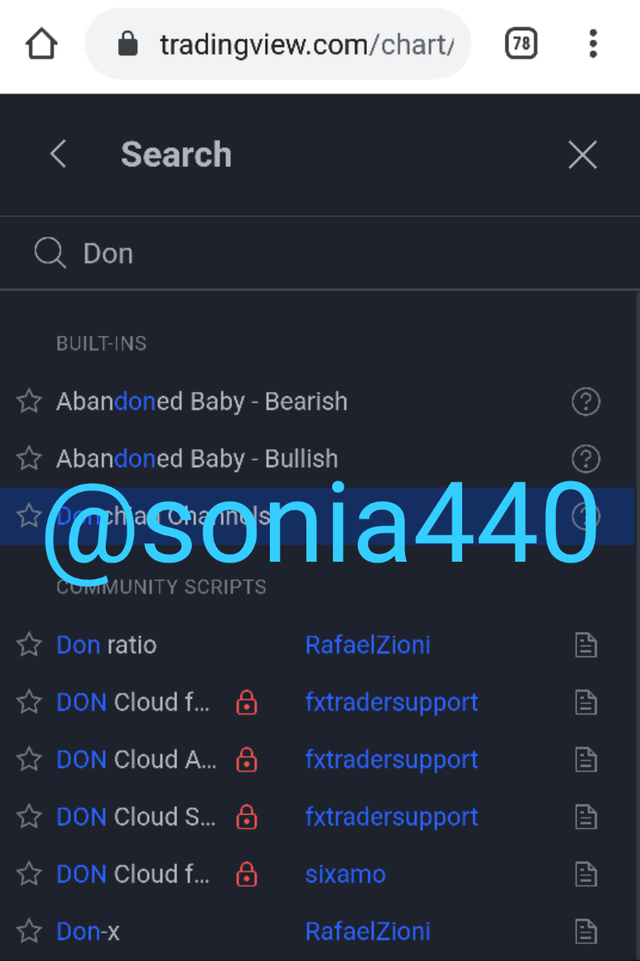
In all advanced charts the donchian indicator is present already. The only thing you do if you want to add it is;
Firstly, right click on the chart.
Secondly, click on insert indicator.
Thirdly, write the name of the vehicle which is donchian channel
And finally click on donchian channel and it will automatically show on the chart.

QUESTION 2
Does it explain in detail how Donchian Channels are calculated (without copying and pasting from the internet)?
Using dochian channel indicator in making calculations, the averages of specific prices are taken for a certain period.
As we are to add 3 channels to the chart, 3 calculations will be made. Viz;
Higher band, Lower band, and Middle band.
- High Band
- Select a time period.
- Check the highest high of the selected time period
- To prepare the higher band, the highest value is selected.
- A Low Band
- A time period will be selected
- Check for the lowest low of each unit in the given period of time
- To prepare the Lowest Band, the lowest value is selected among the provided values.
- Middle Band
To get the middle band;
- A time frame is selected
- An average of the highest high and the lowest low are marked on the graphic.
This is the same thing as the Donchian Channel.
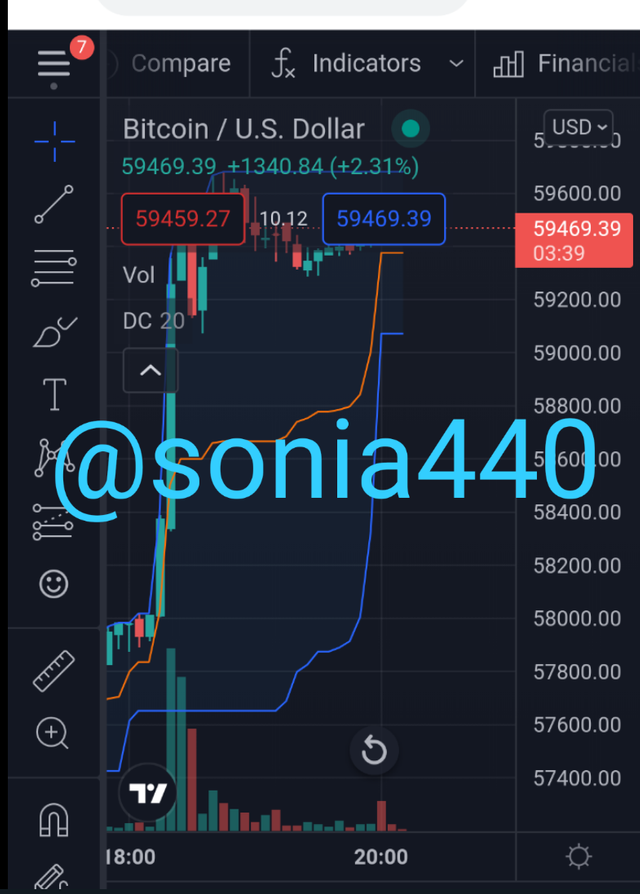
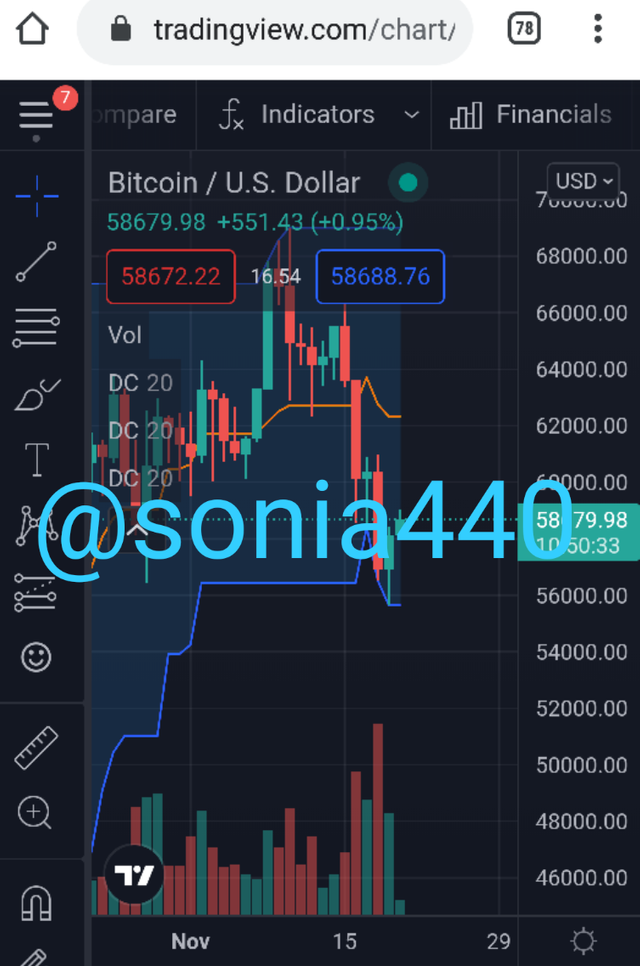
The chart above shows that Donchian indicator takes the value of the last 20 candles.
Although we can adjust the number of candles it checks as well as the time frame of the chart.

QUESTION 3
Explain the different types of uses and interpretations of Donchian Channels (With examples of bullish and bearish trades)?
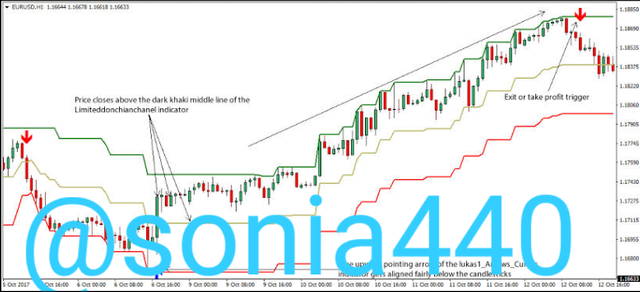
Drawing reference from our first and second questions, we were able to solidly reach an agreement that donchian channel can be used to do a trend analysis and volatility interpretation.
Secondly, we ascertain that we have 3 bands in our indicator. And that our TA is interpreted differently following the direction of our candle.
An overbought zone or a bullish trend.
Examining the different types of usage of donchian, I will like to start with the bullish tiaret.
Anytime the market price approaches the upper band it insinuates that the bull are in control of the market.
When there is a bullish dominance the markets tends to pull back a little but due to the bulls' power, the market is been pushed back up.
Taking cognisance of the past market movement,predictions can be made.
And in this overbought zone, it does not mean price will go down
Bearish trend and Oversell zone
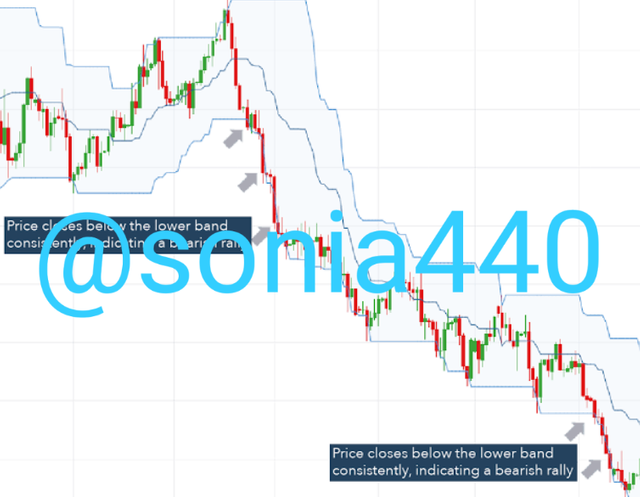
For a market to be labelled bearish, the lower band of the chart will be reached or to a reasonable extent attained.
The market on approaching the lower band and even pushes below the lower band indicates bearish dominance.
The oversold doesn't mean the price will go up
Save for the psychology of the market that can either cause a bullish run or a breakout in the support zone.

Volatility Review
The Donchian channel can always give us the volatility information of a market because it creates its channel with highest high and lowest low values.
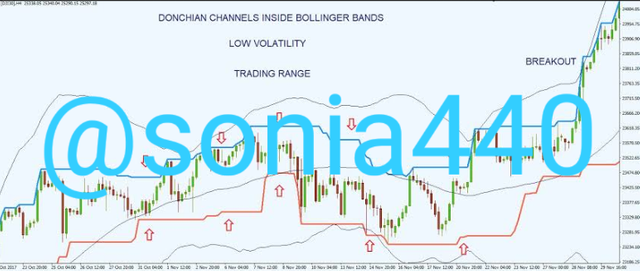
Volatility is said to be high when there is a reasonable distance between the upper and the lower bands.
When the market is volatile, price stability cannot be ascertain.On the other hand,when there is no much distance between the upper and lower bands, volatility is said to be low.
And here market can be said to be stable.
In concluding the above question, it is believed that donchian channel indicator gives a reversal signal about market volatility, overbought, oversold as well as trend breakout.

Question 4
Make 1 inning using the "Donchian Channel Breakout Strategy" and make 1 inning using the "Reversal and Retracement Strategy". You must explain the step by step of how you analyzed to take your input and make them in a demo account so I can evaluate how the operation was taken.
Dochian channel breakout strategy.
To implement a breakout strategy with Donchian;
If the price rises and touches the upper band of the channel, there is this likelihood of the market to go up. When there is an uptrend, there is a higher probability for a higher high to be formed. If the market psychology persist and push the market down, it is advisable you hop in the market because it can go back up and beyond. Although you can predict the market moves, you cant control the market so there is a probability that the market can go against you , for that reason it is important you put your stop loss.
Reversal and Retracement Strategy.
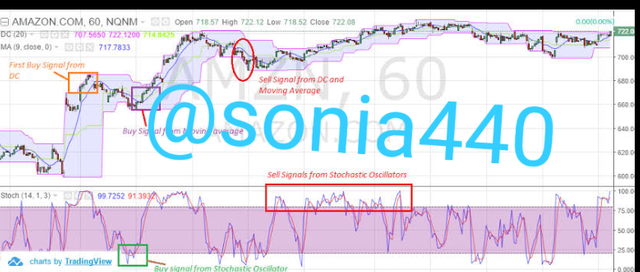
To apply an iversion strategy using dochian channel, in an bullish trend, there is a zig-zag presentation between the upper band and the middle band. In the bearish market, the zig-zag presentation is between the lower band and the middle band.
Source
Below is how to trade using the breakout and reversal strategy
- Open and log in to a demo account
- Choose a pair and add the donchian channel indicator after that our chart is opened.
Looking at the screenshot about Breakout strategy, when the price touched the lower band we bought and wait for the bullish run

Conclusion
It is a pleasure to be part of this class. And I must commend you @lenonmc21 on the teaching it was amazing.
CC
@lenonmc21
