
Image was made with Canva
Hey there my fellow steemians my name is Kenechukwu Ogbuishi also known as @sonofremi and today I will participating in a home work from our wonderful professor @lenonmc21 on the topic Price Action and Engulfing Candle for the beginner course join me as we dive in.
Say in your own words that you understand about the Trading Strategy with “Price Action and the Engulfing Candle Pattern, also describe each step to be able to execute it (Place at least 2 examples in clear cryptographic assets and with your own charts mandatory) ?
Explain in your own words the interpretation that should be given to a large strong movement in the market. What does the price tell us when it happens?
- Explain the trade entry and exit criteria for the buy and sell positions of the trading strategy with Price Action and Engulfing Candlestick Pattern in any cryptocurrency of your choice (Share your own screenshots taking into account a good ratio of risk and benefit)?
Practice (Remember to use your own images and put your username)
- Make 2 entries (One bullish and one bearish), using the “Price Action and Engulfing Candlestick Pattern” trading strategy. These entries must be made in a demo account, keep in mind that it is not enough just to place the images of the execution, you must place additional images to observe the development of these operations to be able to be correctly evaluated and see if they really understood the strategy.

Q.1 Say in your own words that you understand about the Trading Strategy with “Price Action and the Engulfing Candle Pattern, also describe each step to be able to execute it (Place at least 2 examples in clear cryptographic assets and with your own charts mandatory) ?

Price action and Engulfing Candle Pattern is a trading pattern that is used to determine the movement of price to determine when to place a trade with the aid of an engulfing candle. It is given that when there is a bullish trend, the price reversal will cause a bearish trend and when a bearish it will give a bullish trend. As the name implies the Engulfing Candle Pattern is determined when there is a candle engulfs the next candle near to it, therefore it is seen between a bearish and bullish or a bullish and a bearish.
For us to perfectly make use of this strategy we must first observe a clear harmonic trend, and then look for the initial trend to move in an opposite direction before we can determine when to make our entry. The chsrt is viewed under short timeframes like 5M, 15M and also 30M and 50M.
Below I would describe set by set process of how to make use of the Price action and Engulfing Candle Pattern in Trading.
- When observing the chart when take into account a clear harmonic movement of price, it is viewed under a 15 minute chart, we use a trend line to clear show the movement of the candle sticks.
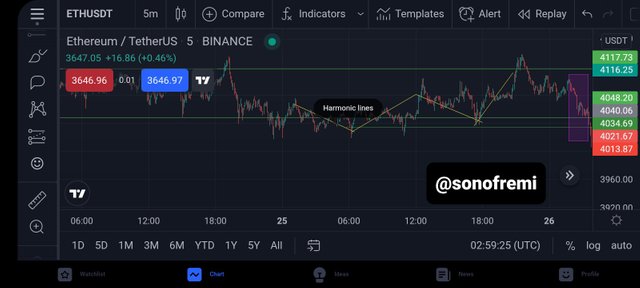
- After we look for a opposite movement in price, which must give at least 4 or 5 candlestick to be valid, then we take into account the candle that covers the previous candle completely thus engulfing it,
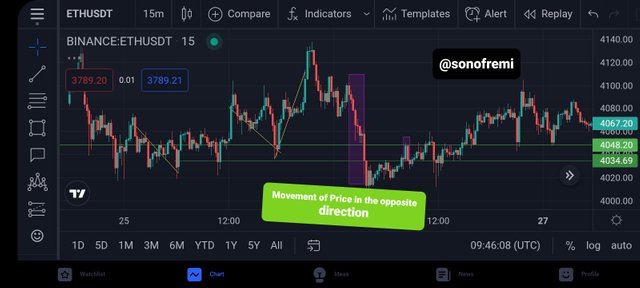
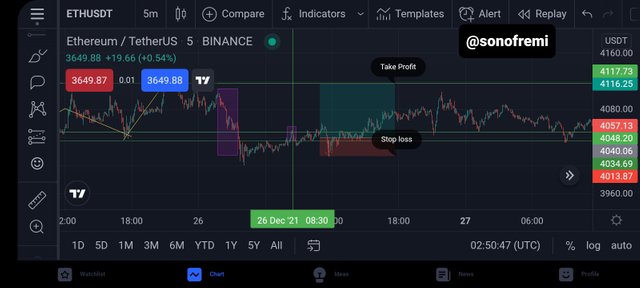
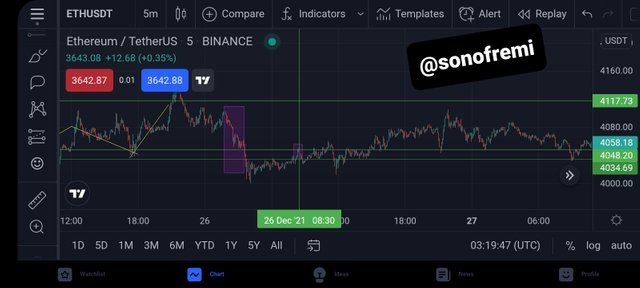
- We then use two horizontal are placed above and below the two candles and a vertical line on the bearish candle so that it may be observable on other timeframes . The zone is then observed, if price is below the zone we allow the price to move within the zone, then we wait till we observe a significant bearish candle below the zone then we place our take profit at the last visible support. Then the stop loss is place above the last price retracement as seen below.
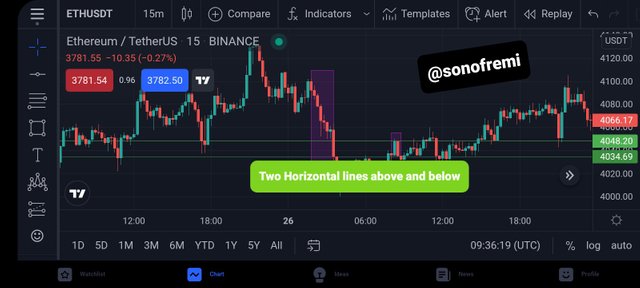
Visible Vertical Line
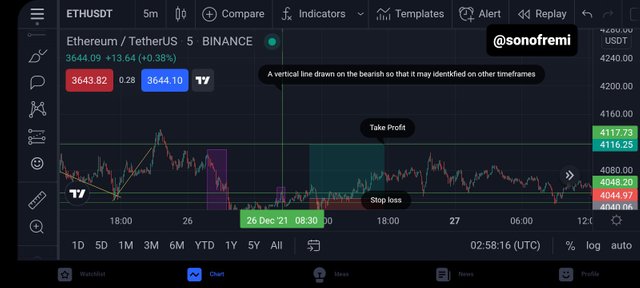
- Then we can our chart to a 5 minute chart and measure the long distance to make our trade have a profit margin of 1:2. If price has broken our laid out horizontal lines we will wait for it to return to the zone before we are able to make an entry. With the aid of our long distance measurement we can be able to know our stop loss and take profit.
There are two types of Engulfing Candles namely;
Bearish Engulfing Candle
Bullish Engulfing Candle
Bearish Engulfing Candle:
This a movement that initially starts with a bullish candle, the price reversal will affect price to move in an opposite direction giving a bearish candle, therefore we observe at least 4 or 5 candles to count the movement as valid. Here the inital candle which is a bullrsh is then engulfed by bearish candle giving a bearish trend. The sellers are said to momentarily in control thus the larger it is the more significant it becomes.
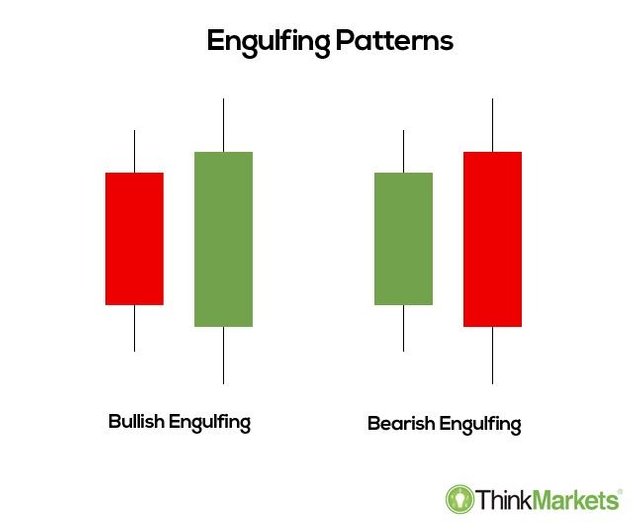
Bullish Engulfing Candle:
This a movement that initially starts with a bearish candle, the price reversal will affect price to move in an opposite direction giving a bullish candle, therefore we observe at least 4 or 5 candles to count the movement as valid.Here the inital candle which is a bearish is then engulfed by bearish candle giving a bullish trend. Here the price of the next day must have opened at a price lower than the previous day and closes significantly higher than it opened on the day before.
Bullish Engulfing Candle Vs Bearish Engulfing Candle
| Bullish Candle | Bearish Candle |
|---|---|
| Bullish Candles shows when a price moves lower and identifies a significant rise in price is ahead | Bearish Candle shows when a price moves upwards and identifies a significant fall in price is ahead |
| The candle first seen is a red candle showing a bearish trend | The Candle first seen is a green candle showing a bullish trend |

Q.2 Explain in your own words the interpretation that should be given to a large strong movement in the market. What does the price tell us when it happens?

Who are Whales in crytocurrency?
Whales are simply agencies with huge amount of tokens in their possession.
We already know what Bullish Engulfing Candle and Bearish Candle and their significance in placing a trade, with that knowledge we would use to answer this question.
A large strong movement in the market simply implies that whales are currently investing huge amounts of money in the market at that said tIme.
This will cause an opposite movement in any initial trend, therefore if the initial trend was a bullish then price reversal will cause a bearish candle to form and if the initial trend was a bullish price reversal will cause the next candle to form to be a bearish candle.
These whales have the ability to put huge funds into the market causing significant shifts in the market. Therefore large strong movement is an indicator for the initial trend current movement and price simply tells us the direction of the initial trend is going to change. As a trader it is not news that whales determine the market for day traders and trades in general.

Q.3 Explain the trade entry and exit criteria for the buy and sell positions of the trading strategy with Price Action and Engulfing Candlestick Pattern in any cryptocurrency of your choice (Share your own screenshots taking into account a good ratio of risk and benefit)?

For us to be able to utilize this pattern in our day trading there are somethings that are need to be taken into account for this strategy to be able to work.
- Firstly there must a distinct harmonic movement showing the movement of the candles up or down. So as to tell movement of price over a specific period of thing before we are able to utilise this strategy, take note that most markets may have a high volatility that's why we make use of crypto paired marked to place the trade.
- Secondly after identify the harmonic movement, the movement of price in the opposite direction must give at least 4 to 5 candles before it's considered as a correct movement in the opposite direction. This must be observe before we can go ahead and use the strategy.
- Thirdly, the Enveloping Candle Pattern must be very distinct, when the Engulfing Candle is identified and the chart is viewed on a 15 minutes chart, as we change the chart to a 5 minute chart, if price has been seen not to have broken the zone marked out by the lines we would have to allow price to break the zone and fall. Therefore once the zone has been broken we identify the last visible support and make our entry(Take Profit)
- Fourth, after placing our take profit, our stop loss should be above the visible bearish candle to minimise the loss from the trade. If the trade tends to go in the opposite direction, the risk and reward ratio should be in a ratio of 1:2 to reduce losses and increase profit significantly.
Sell Entry
STEP 1

STEP 2

Step 3
Step 4
Buy Entry
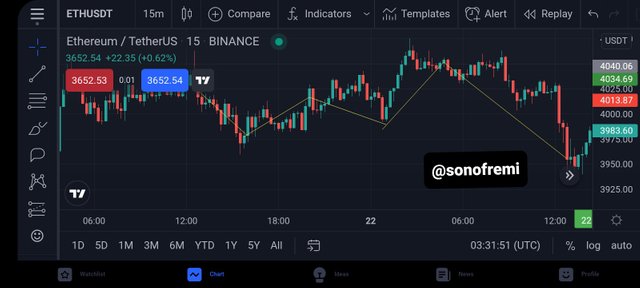
Step 1
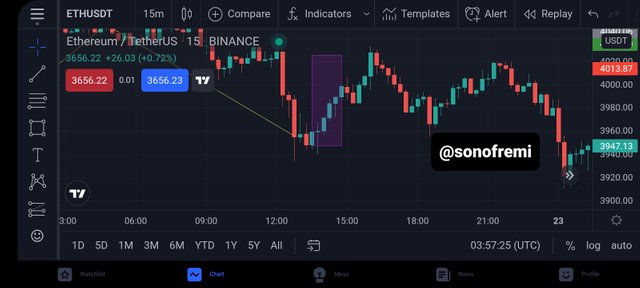
Step 2
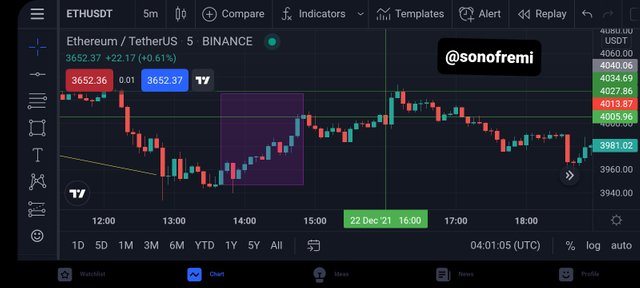
Step 3
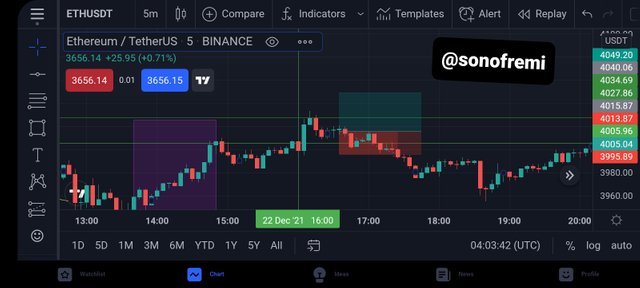
Step 4

Q.1 Make 2 entries (One bullish and one bearish), using the “Price Action and Engulfing Candlestick Pattern” trading strategy.

Sell Entry
The chart was initially set at the 15 mins time frame for Bitcoin/ Usdt market, the screenshot shows clearly that we observe a clear harmonic movement, the market was said to make certain higher highs and higher lower, which gave the current trend to be a bullish candle.
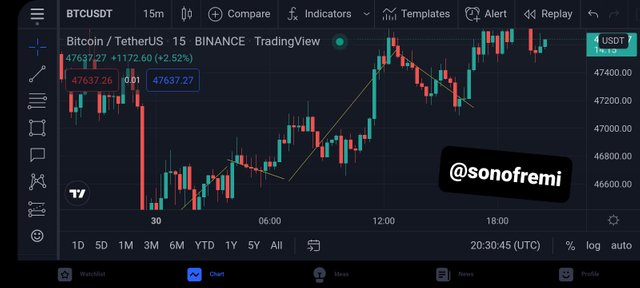
After a movement against the current trend in the opposite direction was observed this is due to the whale in the market that causes sharp shifts in price and determines the direction of the current bullish trend.
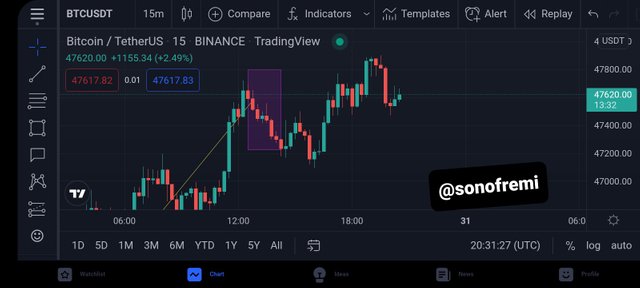
After we use two horizontal lines to clear mark out the beginning and closing of the two candles in the engulfing envelope and a vertical line was place on the candle that was seen to be engulfed so it may be visible in other timeframes
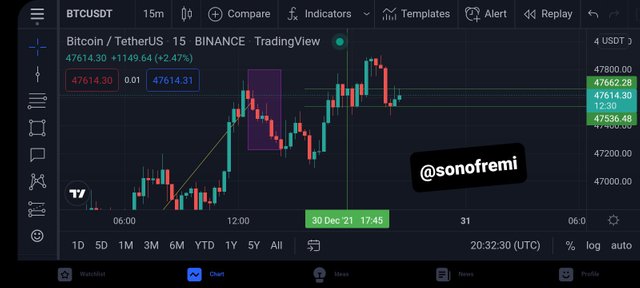
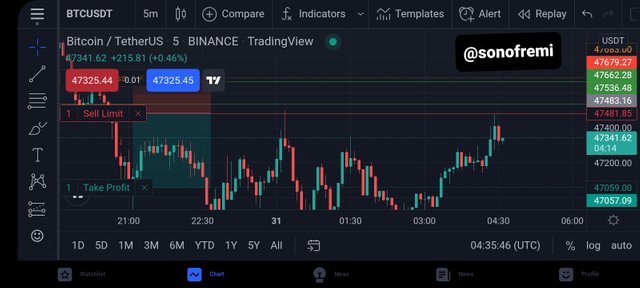
Then I changed the chart to a 5 minute price chart and observed that prices seem to move above the zone before forming a bearish candle after the zone. Therefore I set my take profit at the last seen support and my stop loss above the engulfing candle and my entry was made.
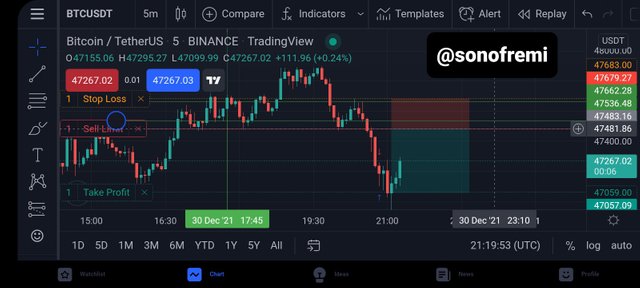
The Sell Order
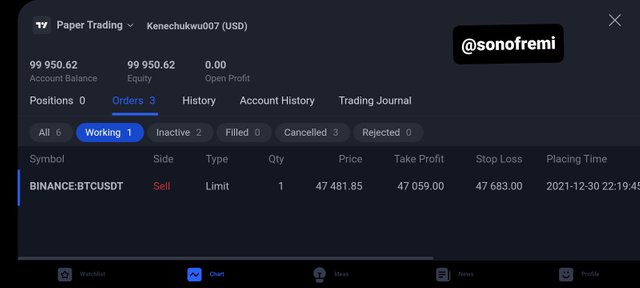
After sometime I went back to the trade to discover that it is going but the price is almost at my entry point.
Buy Order
The chart was initially set at the 15 mins time frame for Ethereum/Usdt market, the screenshot shows clearly that we observe a clear harmonic movement, the market was said to make certain higher highs and higher lows, which gave the current trend to be a bullish candle.
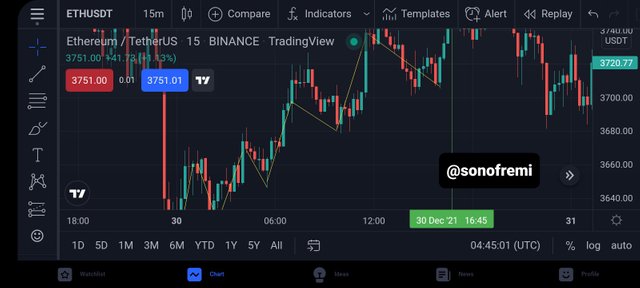
After a movement against the current trend in the opposite direction which was seen to be bearish was observed this is due to the whale in the market that causes sharp shifts in price and determines the direction of the current bullish trend.
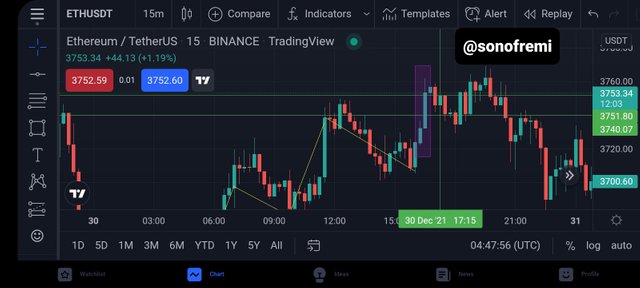
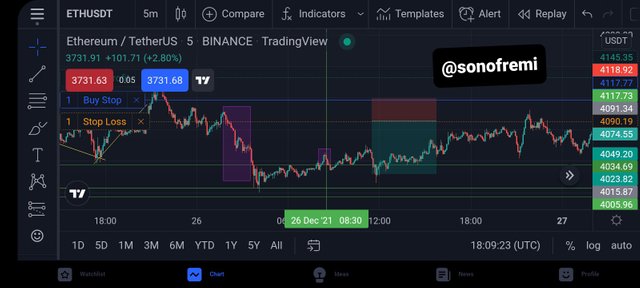
After we use two horizontal lines to clear mark out the beginning and closing of the two candles in the engulfing envelope and a vertical line was place on the candle that was seen to be engulfed so it may be visible in other timeframes

Then I changed the chart to a 5 minute price chart and observed that prices seem to move above the zone before forming a bullish candle after the zone. Therefore I set my take profit above the last seen resistance and my stop loss below the engulfed candle.
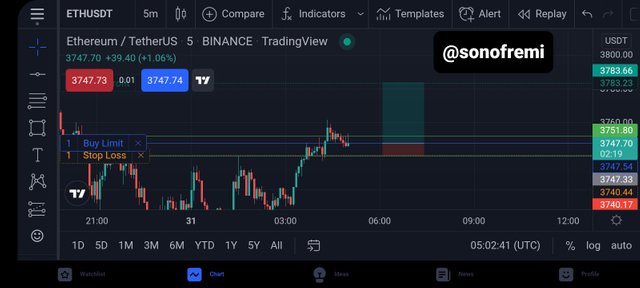
After some time I went back to the trade to discover that it was going well and crossed my entry point.
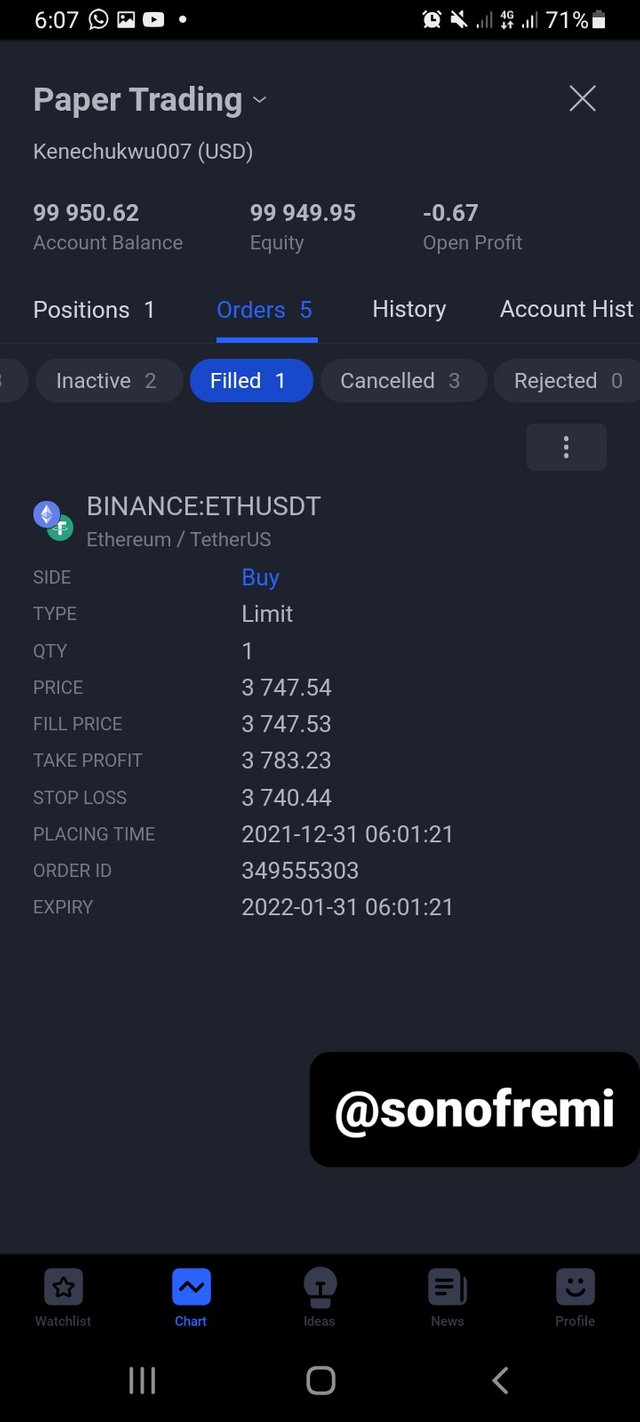
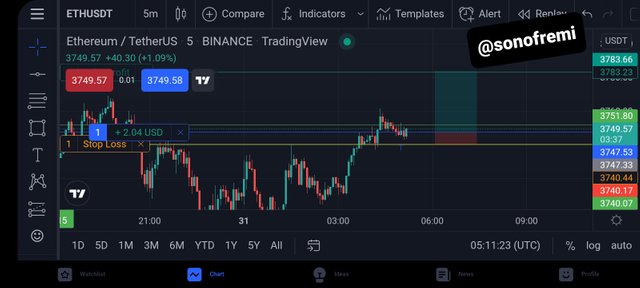
All Screenshots were taken from Tradingview
Conclusion
With this assignment I was able to learn a very good trading strategy that requires all the criteria to be met before we are able to place a trade, this strategy has the ability to generate maximum profits in the market. We also learn that strong movement in market is caused by whales in the market they basically affect what goes on the market.
I have explained the strategy best I can and made entries with Trading view demo account and I have also explained the Entry and Exit criteria to be able use this strategy.
I would like to thank our professor @lenonmc21 for this wonderful assignment and I would love to keep on learning from Steemit Crypto Academy. Have a great hoilday and a Happy New Year.