Image edited withcanva
Hello everyone, welcome to the steemit crypto academy season 4 homework post.
First of all, I would like to appreciate our Nobel Professor @lenonmc21 for all his commendable contributions to our community. Thank you.

QUESTION 1
Define in your own words what Price Action is?
PRICE ACTION
The Price Action is the study of price movement over time only by carefully analyzing the price chart. It could simply be regarded as the change in price movement with regards to time. This change in price movement forms the foundation of all technical analysis. So we can say that price action is the basis in trading and analysis.
.png)
source
All analysis starts with price movement over time and price movement is represented on the chart. With this, we can conclude that price action is simply the price movement of an asset as presented on a price chart over a certain period. The price action is interpreted using the chart pattern, movement, and direction, therefore, a trader who is looking at the price action, has no reason to worry about other external factors such as news, false indicator, etc which can affect the overall market direction.

QUESTION 2
Define and explain in detail what the "Balance Point" is with at least one example of it?
BALANCE POINT
The balance point is the maximum or minimum point a price trend reaches before retracing. The fact that the price chart is very clear, makes this point very easy to identify.
Below is a screenshot of ETH/BTC pair in a 15min price chart indicating a balance point at a certain time range
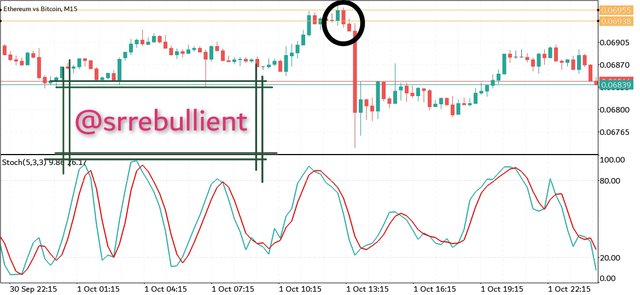
Screenshot from my MT5 App
The above is the maximum point a bullish trend reached before retracing and this maximum point is what is known as the balance point. It is identified by two horizontal lines, one at the opening of the last bullish candle, the other at its closing. These lines, serve as a major resistant zone and it helps in analysis that has to do with price action.
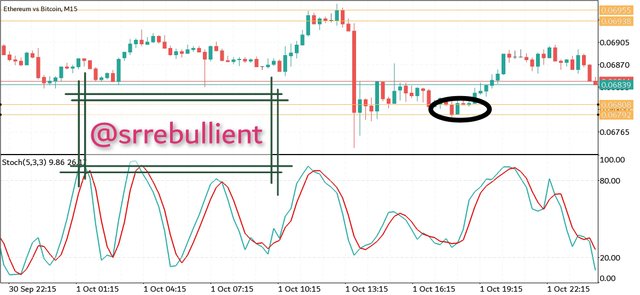
Screenshot from my MT5 App
The above is another example of a balance point. This time it is the minimum point reached by a bearish trend before retracing. The zone indicated by the two horizontal lines drawn at the opening and closing points of the last bearish candle serves as a major support zone for the price of the asset at that particular time frame.

QUESTION 3
Clearly describe the step by step to run a Price Action analysis with "Break-even"?
Step by step price action analysis with Break-even
- Step 1
We start by choosing a trading app.
I will be going with MetaTrader5 app.
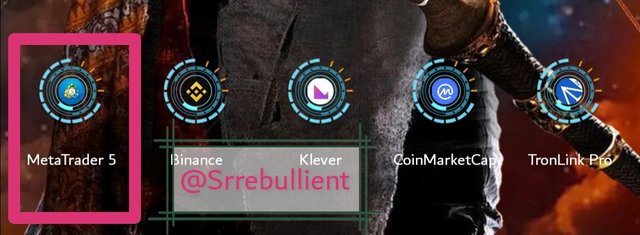
screenshot from my phone app - Step 2
Choose a currency pair.
I will be choosing ETH/BTC

Screenshot on my MT5 app - Step 3
Choose a time frame
I will be choosing a 1hr time frame in other to observe the whole chart properly.
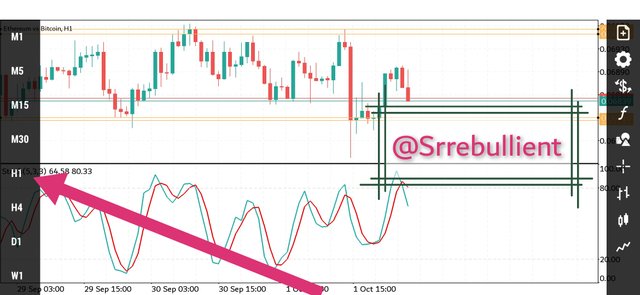
screenshot from my MT5 - Step 4
Looking at the chart, we observe the support and resistant levels which are made obvious by the breaking-even point.
The support level is identified in other to know when the price has reached a possible reversal point. At this point, a trader is expected to sell in other to make profits.
Because there is a possibility of price breaking the resistant level or retracing, it is advisable to set a stop loss just above the resistant level or below the support level.
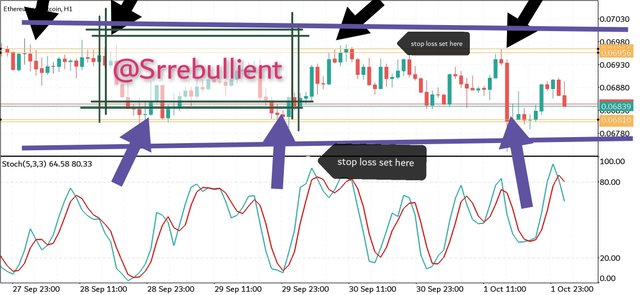
screenshot from my MT5
The black arrow is pointing at the resistant level while the purple arrow points at the support level.
The purple line is indicating the point where I would set my stoploss just below and above the support and resistance respectively.

QUESTION 4
What are the entry and exit criteria using the breakeven price action technique?
Just as I have explained above, the existing criteria using the break-even price action is majorly dependent on support and resistance level.
When the price has reached the balance point on the bullish side, a trader is expected to sell due to the resistance zone forcing the price to retrace.
This doesn't always happen as sometimes the price will break the balance point and keep trending upwards. In other to avoid this, a stop loss is used just as explained above in other to minimize loss.
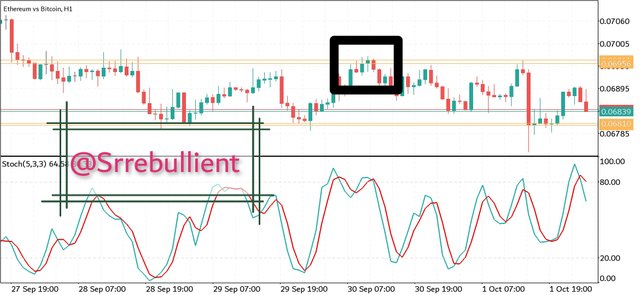
screenshot from my MT5 App
The same thing goes with the resistance level. When the price reaches the resistance level indicated by the balance point, it is expected to retrace. The expected retracement gives a trader the mind of opening a buy order. In other to avoid making a loss when the price breaks the resistance level, a stop loss is set just below the resistance zone just as explained above. This stop loss helps to minimize loss.
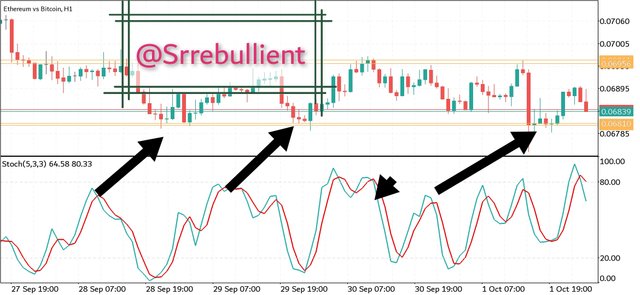
Screenshot from my MT5 App

QUESTION 5
What type of analysis is more effective price action or the use of technical indicators?
I believe that the combination of both is best for a more profitable trading.
Price action technique has some advantages over Technical analysis in the sense that there is no such thing as false indicator.
False indicator simply means a contradiction between an indicator and the price movement of an asset.
Using the price action analysis, there is no such thing as making loss due to false indicator. Price action analysis also rotects a trader from making loss due to fundamental analysis which can cause the price direction to go against the normal techincal indication thereby causing a trader who base solely on technical indication to make loss.
Technical indicators can help in identifying future possible price movement and price action (Leading indicators). Some indicators can also help in identifying when and asset is overbought or sold which signals a trader to either buy or sell. But price action is the foundation of trading analysis therefore, combing both will yield a more profitable result and will also minimize loss.

CONCLUSION
Price action is the basis of trading and analysis because it deals directly with the price chart. Dealing just with the direction of the price chart, there is no need to be concerned about other external factors such as fundamental analysis and the use of indicators.
Taking this lecture by professor @lenonmc21 has widened my knowledge in the understanding of price action and its importance in trading.
Thanks a lot, Professor @lenonmc21 for this course.