It's always good to learn in the Steemit crypto academy. Much regards to professor @shemul21 for this lesson. Below is my homework task.
Explain Your Understanding of Moving Average.
The use of technical indicators for technical analysis have become a norm recently in crypto trading. There are several types of technical indicators, and traders can choose to make use of anyone and can also combine a couple of them for analysis. Moving averages is one of the most recently used indicators.
A moving average is a technical indicator that calculates the average price of an asset overtime and indicate a possible direction of price for the future. It is a very efficient trend and reversal detector. Moving averages go a long way in helping traders detect the support and resistance levels of a given market, in order to make a good entry, take profit when the time is right, and exit when it is necessary. It is a trend-based indicator that allows traders to detect potential price reversals.
There are various moving averages that are suitable for different time spans. For instance, a 50 moving average can be used to monitor price movements for a 50 day period. We also have a 200 moving average that calculates average price points over a 200-day period.
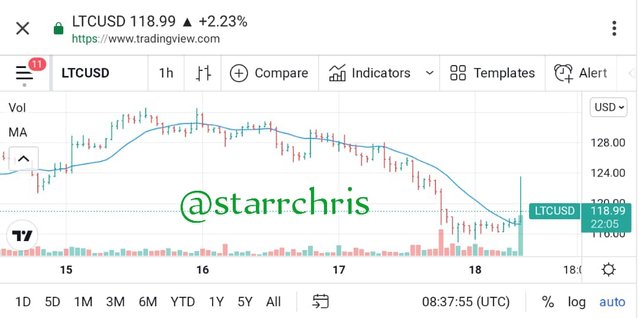
Looking at the chart above, a 14 close moving average is added to the LTCUSD chart to help identify the current trend of the pair. From what is obtained, there is a current bearish movement in the market and the moving average has signalled a downtrend.
2. What Are The Different Types of Moving Average? Differentiate Between Them.
There are basically three most used moving averages. They are; Weighted moving average (WMA), Exponential moving average (EMA) and Simple moving average (SMA).
Simple Moving Average
This is a technical indicator that uses the period of operation (time) of an asset to determine the average price of that asset. The simple moving average uses all the data available as well considers all the prices, therefore helping traders to know the true average price for that asset. With simple moving averages, the trend of the asset price can be identified and followed.
This indicator also makes use of data points to calculate the average price, meaning that the data points are important aspects of a simple moving average. When a new candle is formed in the chart following price movement, the simple moving average will shift, and as more candles are formed, the previous points will disappear and new points would be formed.
The simple moving average is calculated thus: P1+P2+...+Pn / n.
Where P = Price points for different time periods.
n = number of times.
Exponential Moving Average EMA
The exponential moving average (EMA) works like the simple moving average in determining the trend of price. However EMA is more complex when it comes to calculation. The complexity and advancements makes it more effective than the simple average in providing more accurate reversal signals isolaz price predictions.
It uses both past and current price data to provide a more solid result. However, it is more preferred and more efficient for traders who are into short term trading.
EMA can be calculated thus:
EMA = (Today's price - Yesterday's EMA x Multiplier + Yesterday's EMA)
It can be seen that this calculation is a little more complicated than that of simple moving average. It should be noted that EMA and SMA can be combined for a better result and price signals.
Weighted Moving Average
This is a moving average that uses the most recent prices of an asset to make a statistical computation of the average. This type of indicator does not pay much attention to the past data, but it also follows the trend just the other types of moving averages.
The weighted moving average uses the candles formed at each price level, and is calculated using a multiplier to get a weighted value. To calculate the weighed moving average, the following formula can be used.
[P1×t + P2×(t–1) + ... + Pn] / [t×(t+1)]/2
Differences between the simple moving average, exponential and weighted moving average
| SMA | EMA | WMA |
|---|---|---|
| Deals with the calculation of average price using all the data available. | Deals with the calculation of average price with the present-day price/data | Deals with the calculation of average with the latest data. |
| It is mostly preferred by long-term traders. | It is given preference to short-term trade. | It is suitable for both short- and long-term trade. |
| It can be computed easily. | It is more complex to calculate. | Its calculation rest upon the most recent data, and is also complex. |
| The level of accuracy is high when SMA gives a larger value. | It is more dependable when the value calculated is lesser. | Both a higher and lower value are weighted, hence they can be relied on. |
3. Identify Entry and Exit Points Using Moving Average. (Demonstrate with Screenshots)
Moving averages are vital tools for identifying an entry as well as exit positions in a market. Note that these two positions are the most important in trading. Once you miss it, you may be at a risk of making some losses. Now let's see how to make use of the moving average indicator to identify an entry and exit points.
Entry points with Moving averages
Once the moving average is set in motion, it will either be above or below the price, indicating a bearish or bullish movement. Once the moving average moves below the price, Traders can make an entry, buying the asset. This point is considered as the beginning of an uptrend. So it is essential to enter into the market at this point. The asset price will be on the increase and the trader will be making some gains here.
Let's take an illustration.
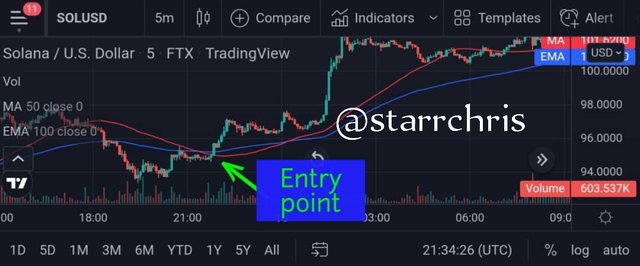
From the Solana chart above, a simple moving average of 50, combined with an exponential MA of 100 close were used to determine the entry position. The point where the MA went below the price is a perfect entry position. The price of SOL kept increasing till it got to about $101. Traders who made an entry at $95 or thereabouts, as indicated by the MA will be able to make some profit from the trade.
Exit points with Moving averages
The exit points can simply be detected with the use of a moving average. Here, traders will watch out for the point where the moving average crosses and moves above the price. This is an indication of a downtrend. At that point, the trader can simply sell the asset and exit the market. Once the price goes below the MA, it will keep on declining, and the profits made from the trade could be lost if the trader fails to exit the market.
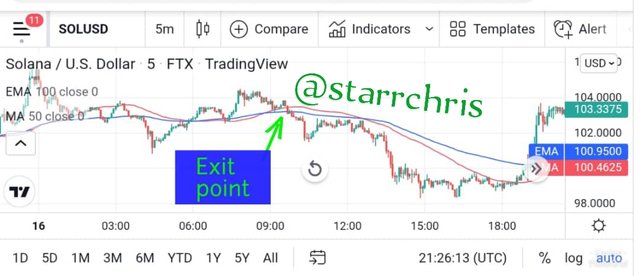
Looking at the chart above, the price of ETH went below the moving average and that was a sell signal. It can be seen that the price kept on declining thereafter. In essence, a sell signal which is also referred to an exit point is seen when the price is below the moving average.
4. What do you understand by Crossover? Explain in Your Own Words.
It is known that two or more technical indicators can be set in motion by a trader to monitor the price movements in a market. Similarly, A trader can decide to use a combination of two moving averages with different time frames for efficiency. In setting these two MAs, one will have a longer time frame while the time frame of the other would be shorter. These kind of technical analysis will work better than a single MA.
The longer period MA will send signals less frequently than the shorter MA. Since the shorter MA produces a more frequent signal, it is however more closer and responds faster to price movements.
At a given point, the shorter MA will cross the longer MA upwards, indicating a better buy position. This system of trading is referred to as the crossover system. Most traders often make use of crossover to boost their profitability level and reduce the overall number of signals gotten from the analysis.
A trader can combine two moving averages like the 100 MA & 200 MA, 25 MA & 50 MA , 50 MA & 100 MA, etc depending on the proposed span of their trade. There are several rules of crossover that enables a trader to know when to buy, when to take profit and exit as well as where to initiate a stoploss.
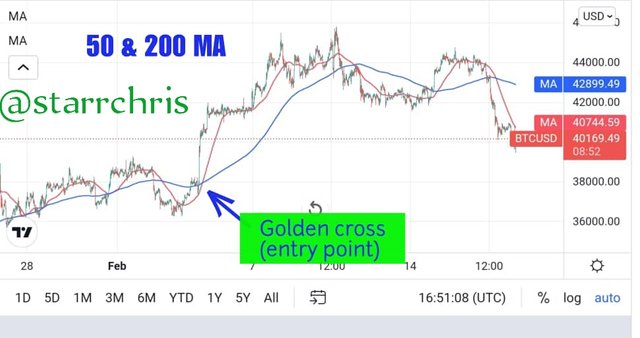
Looking at the 50MA and 200MA crossover of BTC, it can be seen that the 50MA (red line) is closer to the price and it moves faster than that of 200MA (blue line). At the point where the 50 MA crossed the 200 MA (golden cross), a better entry is indicated. The stoploss is set below the crossover while profit is taken at the peak before the death Cross.
The same is applicable to ETHUSD 50 and 200 MA. At the point where the smaller MA crosses the larger MA (golden cross), an entry is made and stoploss is initiated below the crossover.
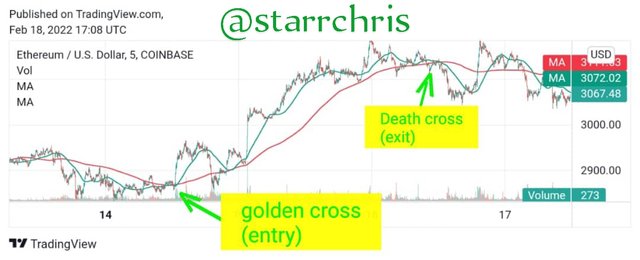
There was a bullish movement after that point. The price pumped from 2800 dollars to 3100 dollars before the death cross, where the 200 moving average overtook the 50 moving average. When the Death cross occured, a take profit signal was sent. Crossover trading is very important and can make trading easier for traders. However traders must understand the terms used in crossover, in order to increase their profitability level.
5. Explain The Limitations of Moving Average.
Moving averages have some limitations just like every other technical indicators. They are not 100% reliable, as they are trend-based, meaning that the signals gotten may be false.
- There are no clear trends produced by moving averages for a short time period. It is only when the time lag is wide that the trend is clearly presented.
- Moving averages are lagging indicators, which means that the signals are gotten after the event has occurred. Hence, a trader who relies only on them may not make an entry at the best points.
- The signals gotten from a shorter span MA are often many, and this may lead to many false signals as well as confusion. On the other hand, longer span MAs hardly send signals to the trader and this is also another form of limitation posed to the indicator.
- The signals gotten from MAs have to be confirmed by other technical indicators to avoid misleading informations. They are not standalone tool for analysis.
- Where there are market whales manipulating the prices, moving averages may not work effectively.
Conclusion
Moving averages are important in trading, especially in detecting the entry and exit positions. As trend-based indicators, they present traders with the direction of the market. As it is often said, "The trend is your friend", moving averages serve as a market friendly indicators. However, traders should be more careful in the timing of their analysis. They should also be cautious about false signals that could be sent, as moving averages are not absolutely safe. Also, it is better to use moving average alongside other technical analysis, to be able to filter the signals received, and also confirm it before taking actions.
Thank you so much for having me!
@dilchamo and @steemcurator02
This post will soon expire please 🥺
Downvoting a post can decrease pending rewards and make it less visible. Common reasons:
Submit