Explain and define in your own words what the Donchian Channels are?
Does it explain in detail how Donchian Channels are calculated (without copying and pasting from the internet)?
Explain the different types of uses and interpretations of Donchian Channels (With examples of bullish and bearish trades)?
Practice (Remember to use your own images and put your username)
Make 1 inning using the "Donchian Channel Breakout Strategy" and make 1 inning using the "Reversal and Retracement Strategy"

Introduction

Good evening sir hope your day went well? After going through your awesome lecture, i am happy and greatful for your impact me increasing my crypto knowledge. So therefore i made this post as an entry to your awesome lecture.

Explain and define in your own words what the Donchian Channels are?

What are Donchain Channel?
Donchain Channel is simply an indicator used in crypto trading market. They are also trending trade indicators ultilizing up-to-date price momentum to make decisions in the market.nThis indicator "Donchain" was invented by Richard Donchain An American Commodities and futures Trader in the early 1970s. The aim sited by Mr Donchain was to identify potiential breakouts or breakthrough and also retracement. When we mean breakthrough we mean a rise in a security price which could overshoot resistance level or drop down below support level. Donchain Channel could be said to be similar with the Bollinger Band in many instances, but the Donchain stands out massively from Bollinger band For instance:
• Donchain provides more reliable trading opportunnities
• Donchain seeks to identify extreme bullish and bearish signals that favors higher and lower breakouts and emerging trends.
• Donchain has a more balanced result calculation and it subsides impact of big high or low prints.
Donchain is a substantial indicator for volatility on market price, when prices are stable or possessed stability Donchain Channel will be relatively narrow, when there are fluantuations in prices the Donchain Channel becomes wider.
How does Donchain work?
Donchain Channel are three lines generated via moving average calculations which comprises of an indicator created by upper and lower band around the median band. The highest price of a security over a period of time is known as the upper band mark and the lowest price of a security over a period of time is the lowest band.
The three lines builds a visual map of prices overtime just like Bollinger Band the lines built indicates the bearish and bullish extent for a chosen period
The first line entails the extent of bullish energy critically showing the highest achieved price for a period through the bull-bear conflict.
The Mean reversion or median price is identified by the middle or center line. It highlights the middle ground Achievement for the period through the bull-bear conflict. At the end line we identify, the bearish signal extent the review of the Lowest price gotten form the period in respect to the bull-bear conflict. The word Bull-bear conflict means the corresponding up and down movements of the candlesstkicks which shows the signal in market charts.

How Can you Calculate Donchain Channel?

You can calculate Donchain Channel via a high channel, low channel or central channel
Calculating with a Low Channel:
• Pick a time period or range (could be Minutes, hours, days etc)
• Observe and compare the low prints for each minutes, hours etc
• Choose the lowest print them plot results.
For High Channel
• Pick your time range
• Compare the high prints for either minutes, hours days etc
• Choose the highest prints and plot results
For Center Channel
• Pick the time range
• Compare the both high and low prints per your time range
• Take Your Range from low channel and substract from the high channel, plot your results.
Bellow are formulas for Donchain Channel calculation
UC ( Upper channel) Highest prints in ranged time
LC (Lower channel) Lowest prints in ranged time
MC (Middle Channel) LC-UC/2
Periods are minutes, hours etc.

Explain the different types of uses and interpretations of Donchian Channels (With examples of bullish and bearish trades)?

We already know that Donchain Channel ecompasses round Volatility, analysis of trends and we critically observe the commodity chart candle sticks within the Donchain Channel indicator which has three (3) band. We have different interpretation approach if the band is lower, middle or upper, below is a little explanation of Donchain Channel and usage.
OVERSELL ZONE:
The OVERSELL ZONE entails bearish where by there is an approach to the lower band by the market price showing an interpretation of a down trend. This is an indication of oversale of that commodity at this process it is at the over sold region.
Note: OVERSELL ZONE gives explanation of bearish trend. When such signals are given.
There is a tendency of price increments or a fall in price there is always no certainty just hypothesis. Unlike bullish trends, the market price of an asset moves downward or if the price of an asset increases, it's moves to an lower band. It shows that the market is experiencing a bearish signal when the buyers of the asset are in control of the market at that moment. Bearish trend also signify that an asset has been oversold in the market at a particular period of time.
OVERBOUGHT ZONE:
This could also be referred to as bullish. When the price of the market approaches to the upper band, it simply indicates a sign that there is a bullish dominance showing to us an uptrend pattern.
If the market price of an asset, moves upward or if the price of an asset increases and even moves to an upper band, it shows that the market is experiencing a bullish signal and the sellers of assert are in control of the market at that moment. Bullish trend also signify that an asset has been overbought in the market at a particular period of time. All Signals are simply estimations of a possible outcome but there is a bullish trend when we see an uptrend approaching the OVERBOUGHT ZONE. If there is a fluctuation and continuous repeatation then there is a bullish dominance.
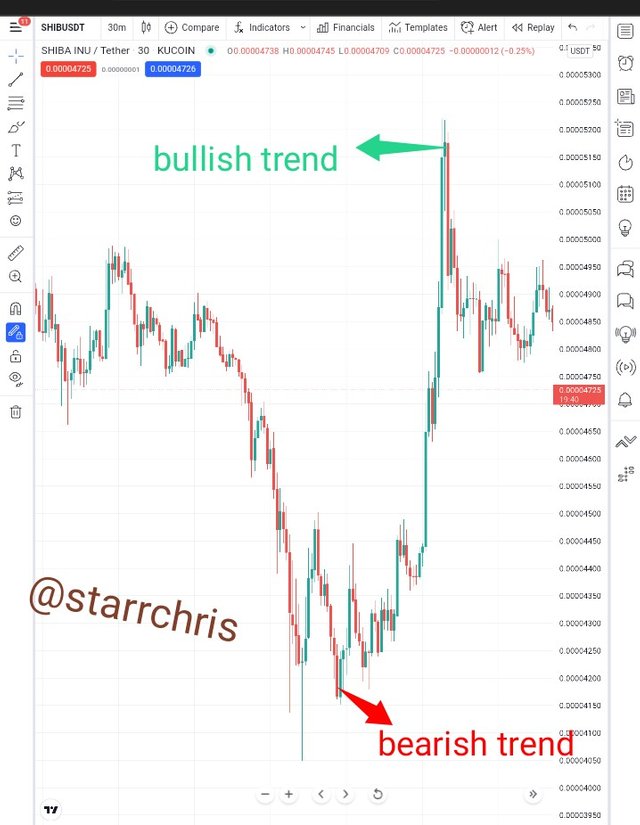
Source Shiba Inu/USDT
Volatility Review
The Donchian Channels is known to directly creates its channel with Highest High price of an asset, and the Lowest Low price of the asset.
It's best in predicting and detecting the volatlity of any asset at a particular period of time.
Volatility of an asset low when it's difference between the upper band channel and the lower band channel is not long and small, at this stage a price is said to be stable and the market is at a stagnant. While the Volatility is high if the difference between the upper band and lower band is large.
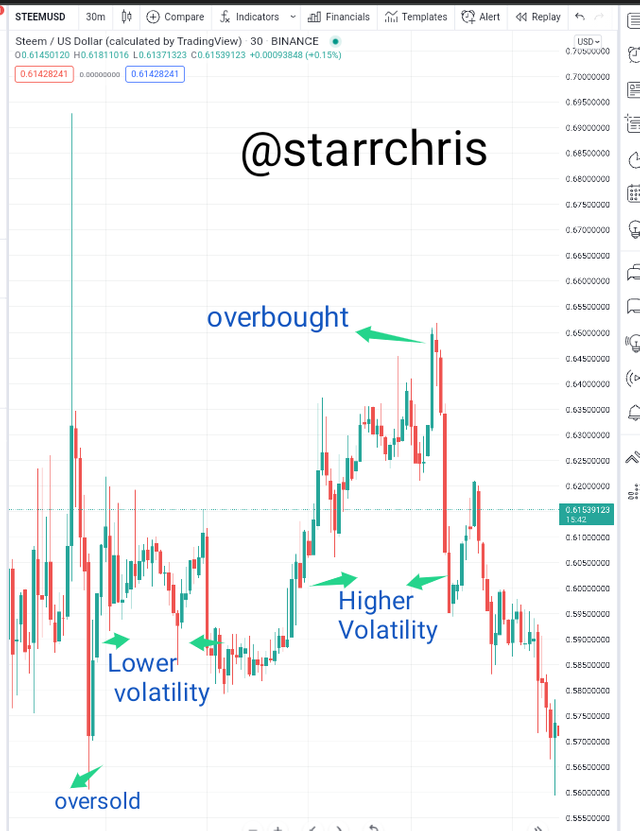
Source Steem/USD

Practice (Remember to use your own images and put your username)
Make 1 inning using the "Donchian Channel Breakout Strategy" and make 1 inning using the "Reversal and Retracement Strategy"

Donchian Channel Breakout Strategy
Getting the best in business is by having strategies and formats in crypto world. Knowing a 70% manner of approach to the market is very essential. Here is my strategy for Breakout as we all know most breakout strategies may not be successful.
Find a momentum breakout that is high no system is 100% accurate but there are lots of mediums to increase signal qualities in Donchain Channel
Observe high accurate entries with a trend filter.
To achieve this add a consistent moving average and look for breakouts when ever the price is below the moving average.
If the price a Japanese candle moves upward towards the upper band of the channel, it is expected to go up. New highest highs are gotten after a bullish trend of an asset. Even If they is downward movement of an asset price in the market, the is a tendency that it will bounce to hit a high band.
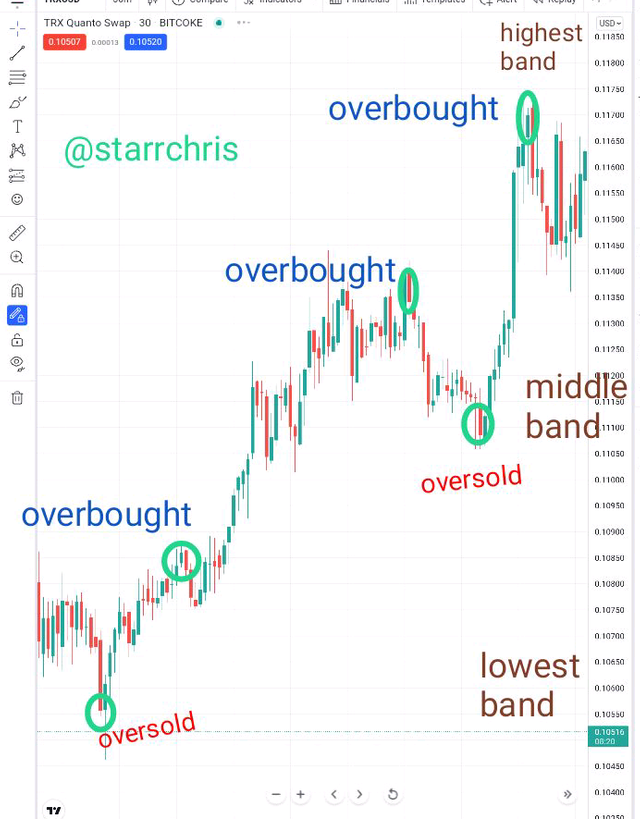
TRX/USD Source
REVERSAL AND RETRACEMENT STRATEGY
In this methodology, the aim is to pick an entry base on an anticipation that has to do with the reversals from current market price for a trend.
If the price decelerates to the lower band of Donchain Channel, just wait for it to go back to the channel.
- If the commodity channel index moves above -100 from the lower band place a buy order.
Steps
- Wait when the market is experiencing a bearish
Is experiencing a fall to a lower channel. - You close in its gain, the moment the market rallies above its middle channel/band
- Make an entry for a trade, and collect profit if it is price breaks after the middle band.
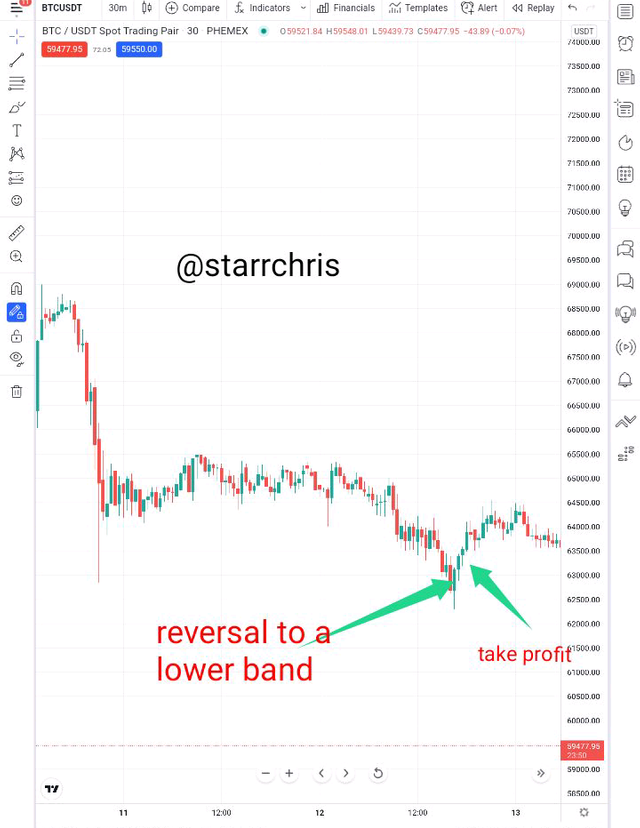
BTC/USDT
Few Registers use for this Assignment
Volatility:
Volatility extimates How much a commodity has moved either Upward or Downward.
Volatility affects Upper band and Lower band it shows how fast the price of an asset changes
Candle sticks:
Candlesticks are supports for more than one candles one which could be talk or slim and they are used in commodity charts
Commodity:
Something that can be bought or sold

Conclusion.

In this assignment , i was opportuned to know about Donchian Channel and how Donchian Channels work, its calculation and how to easily implement it. It is very important to apply this indicator, Thank you very much prof, i admire your strength and wisdom.