Question 1:Give a detailed analysis of BICHI STRATEGY. Staring from introduction, identification of trends, trend reversal in market, entry and exit from the market, one demo trade and finally your opinion about this strategy. (Screenshot required). [4 points]
Question 2:Define briefly Crypto IDX and Altcoins IDX. What is signal prediction trading. Is it legal or ill-legal in your country. (Explain briefly) [2points]
Question 3:If you want to create your own penny IDX, then which 4 penny assets will you choose and what what is the reason behind choosing those four assets. Define Penny currencies.(Explain, no screenshot required). [2points]
Question 4: Conclusion

BICHI Strategy

The BICHI strategy can simply be defined as the act of combining two powerful technical analysis tools which are known as "Ichimoku Kinko Hyo" and the "Bollinger Bands" this tools are used to carefully predict, calculate, analyze and check, movement in the of asset, trend and price of assets in a crypto market, at a particular moment.
The Bollinger Bands technical indicator produce a dynamic support and resistance for price trend at a period in time. That is to say it create boundaries which could be either upper and lower Price movement of the asset at a moment in time. Ichimoku Kinko Hyo on the other hand consist of so many attributes but for this topic we will be emphasizing on "Lagging span" of so many parts, but the part needed in this strategy is just the "Lagging span". This can be used to help in identifying the beginning and end of a trend, as well as trend reversals of an asset at a particular period of time.The combination of this two technical analysing tool would result to more strength while predicing the chart

Identification of Trends using the BICHI Strategy

To easily identify trends using the BICHI technical strategy, Bollinger Bands and Ichimoku indicator must be watched properly. There are two known trends, they are:
Uptrend
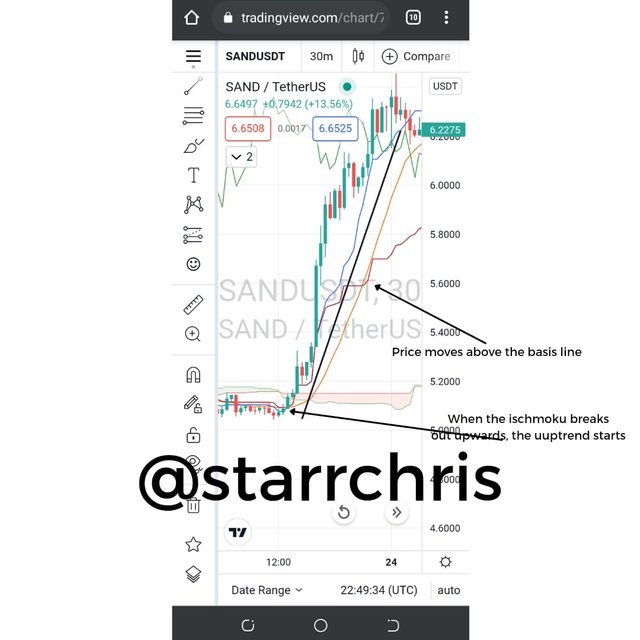
For chart to be said to be experiencing an uptrend,the Bollinger Bands indicator should be seen moving upwards while the baseline of the indicator should be located below the chart working as dynamic support in the analyze and Ichimoku would be crossing the price chart to move downwards of the chart.
Source: Tradingview
The image above is the 15min chart for SANDUSDT pair. We can see that the baseline of the Bollinger Bands technical analysing indicator is seen down below the asset chart, as normal it's always works like a dynamic support. The Ichimoku has successfully crossed the asset chart and is seen below the chart. The Bollinger Bands technical indicator can be seen moving upwards just as the with movement price of the asset . All these are taken into consideration when identifying an uptrend using the BICHI strategy.
Downtrend
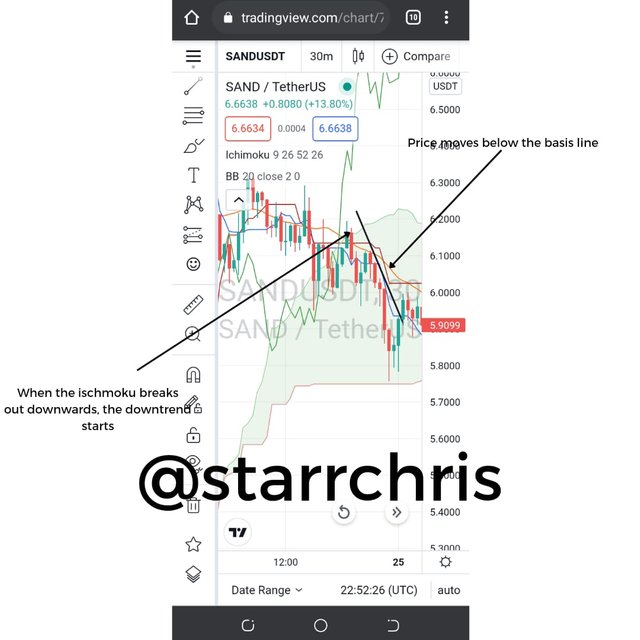
To easily indicate a downtrend with BICHI strategy, the baseline of the Bollinger Bands analysing indicator can be seen above the asset chart while ot is working as a dynamic resistance. The Ichimoku is then going to cross the price chart to move above the full chart for the selected asset. We can see if we examine closely, that the Bollinger Bands will move downwards just ast the with the price moves.
Source: Tradingview
The image above is the 15min chart for SANDUSDT pair. It is can be seen that the base line of the Bollinger Bands is placed just above the price chart acting as dynamic resistance. The Bollinger Bands is also moving downwards along with price movement. The Ichimoku crossed the price chart and is above price movement. All these are the conditions to note for identifying a downtrend with the BICHI strategy.

Trend reversal

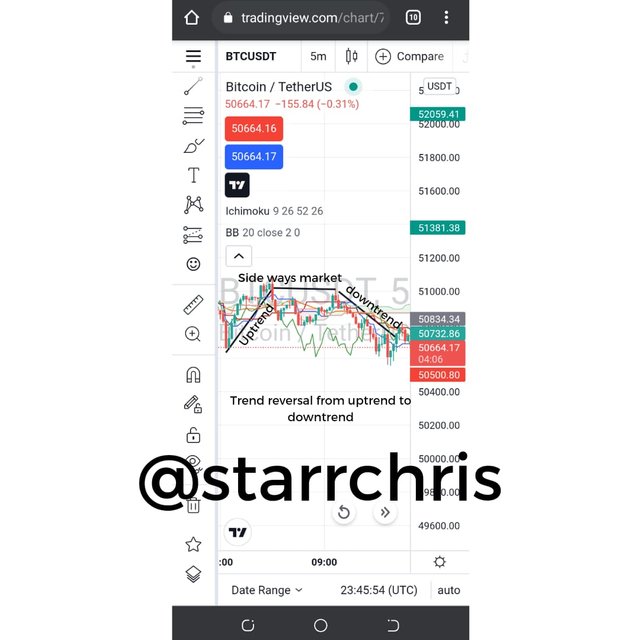
Trend reversal is said to be the condition whereby the price of a selected or chosen asset changes the direction of it's movement. That is to say if the price of an asset moves in an upward direction, which as i have said before is called an uptrend suddenly stop and changes direction and suddenly starts giving bearish signal, that is the opposite direction, which we all know is a downward direction of the price of the asset which is also called downtrend.
BTCUSDT
Source: Tradingview
Downward trend reversal (price change from downtrend to uptrend)That is to say if the price of an asset moves in an downward direction, which as i have said before is called an downtrend suddenly stop and changes direction and suddenly starts giving bullish signal, that is the opposite direction, which we all know is a upward direction of the price of the asset which is also called uptrend.To indicate the trend reversal from BICHI Strategy, i will advise we make use of the Bollinger Bands technical Indicator. When the Bollinger Bands indicator and the price moves n downward direction then after this condition the price of the asset will be seen moving in sidewalk direction.
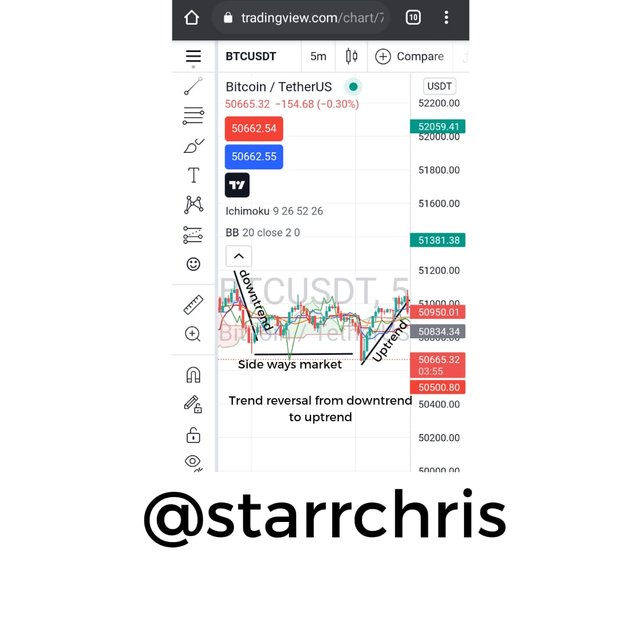
BTCUSDT
Source: Tradingview
the price of asset moves in sideways trend. At this point prices breaks the Once we confirm both these conditions in price of asset we can confirm that trend reversal is expected to happen and price of asset changes soon after sideways trend. Ichimoku Cloud is the expected to break price on so many occasions times.

Buying and Selling using BICHI Strategy

Buying Trade
For a buyer or a trader who wants to buy an asset or assets, he is expected firstly check and calculate chart, if the chart is experiencing uptrend, for an uptrend i can see the Bollinger Bands technical Indicator also i could see the price of the asset is above the baseline as i have said before that the baseline act as a support to the price of the asset.Then it's adviceable wait and see if the price of asset would break the Ichimoku Cloud in it bullish movement, as long as this is seen we are expected to make a entry or will i say a buy order.We take entry when we want to buy an asset on the chart, this is usually done after the breakout of Ichimoku Cloud is placed, as said before the stop loss should be placed where there is a support line.For example
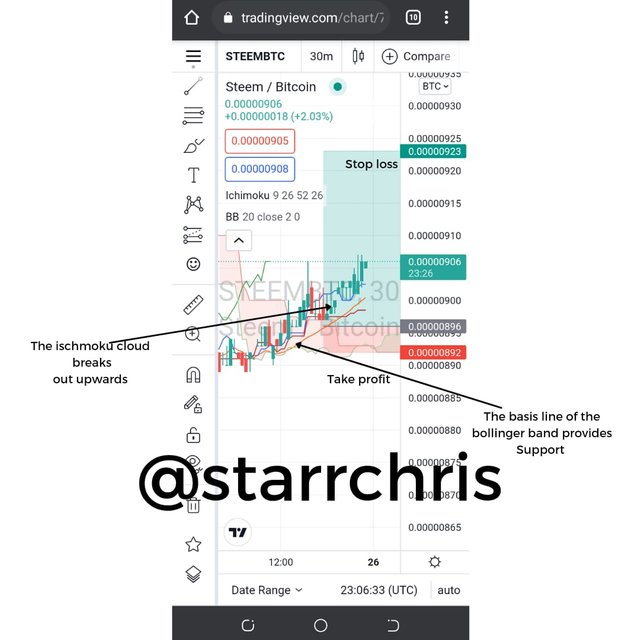
STEEMBTC
Source: Tradingview
Buy trade setup Source : TradingViewSell trade using Bichi StrategyWe place a sell side trade when the price of asset is in downward move.
Sell Trade
To make a sell trade, i will advise everyone to make sure the the price of the asset is experiencing downtrend. The price action should be seen below the baseline of the Bollinger bands that works as a resistance. The price is then seen then breaking the ichimoku cloud it's downward movement. I would advise everyone sht place their sell trade on the next candle and also place stop loss on the baseline level. We put our stop loss level as resistance basis of Bollinger Bands Indicator.
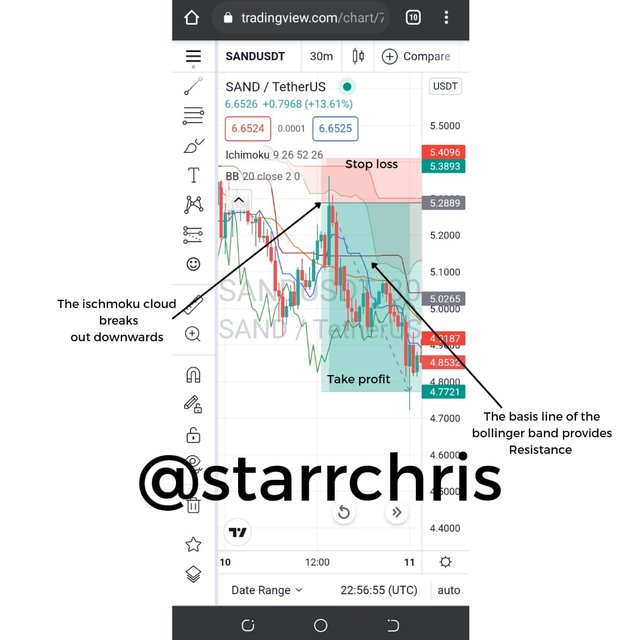
SANDBTC
Source: Tradingview

My Demo trade

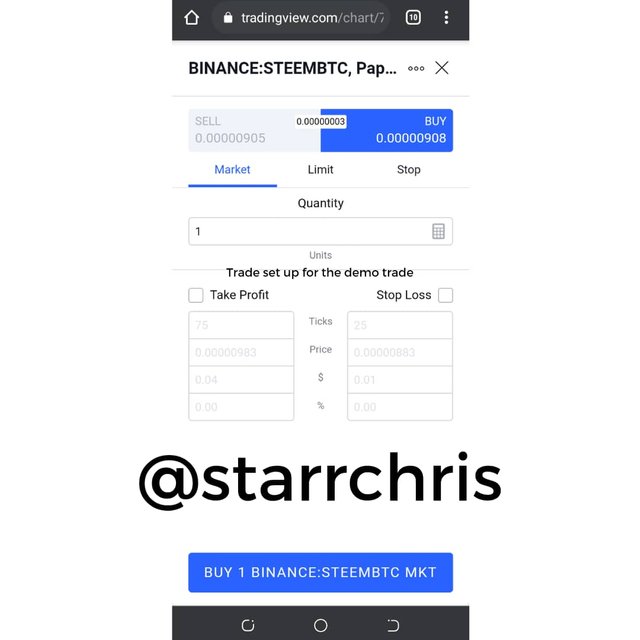
Source: Tradingview
Source: Tradingview
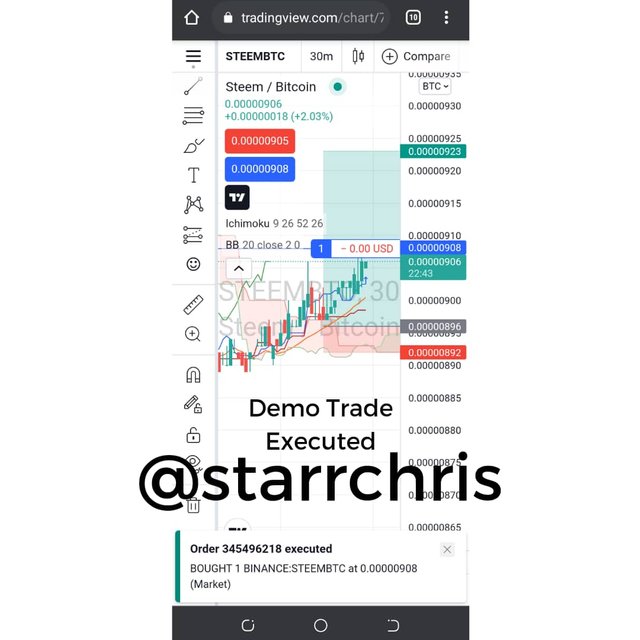
For this assignment , I did place a Buy trade trade on the STEEM/BTC chart with a timeframe of 30 minutes on TradingView platform. The ischmoku cloud break did out upward and then the baseline of the boiling band provide support for the trade.

Crypto IDX
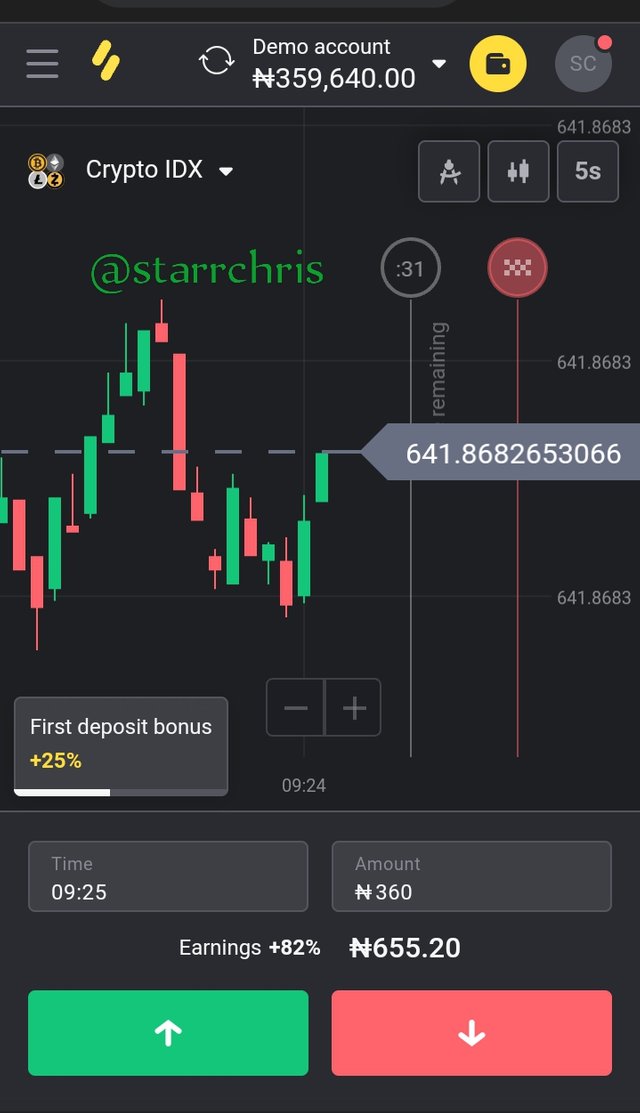
Crypto IDX is said to be a synthetic asset that is a product of the combination of 4 (four) different crypto currencies in the crypto market this crypto currencies are as follow:
• Bitcoin,
• Ethereum,
• Litecoin and
• Zcash.
The crypo IDX also known as Cryptocurrency Index, are crypto asset that sold and bought on a platform known as "Binomo platform". A synthetic asset can be defined as a derived asset that is to say a synthetic crypto asset from 4 different crypto currencies in the crypto market, this asset inherits the characteristics of of the cryptocurrency which form he asset. It's also inherits the trend of the cryptocurrency that forms it, so therefore it inherits, the supply and demands of the cryptocurrency that it up build the asset up.
Altcoins IDX
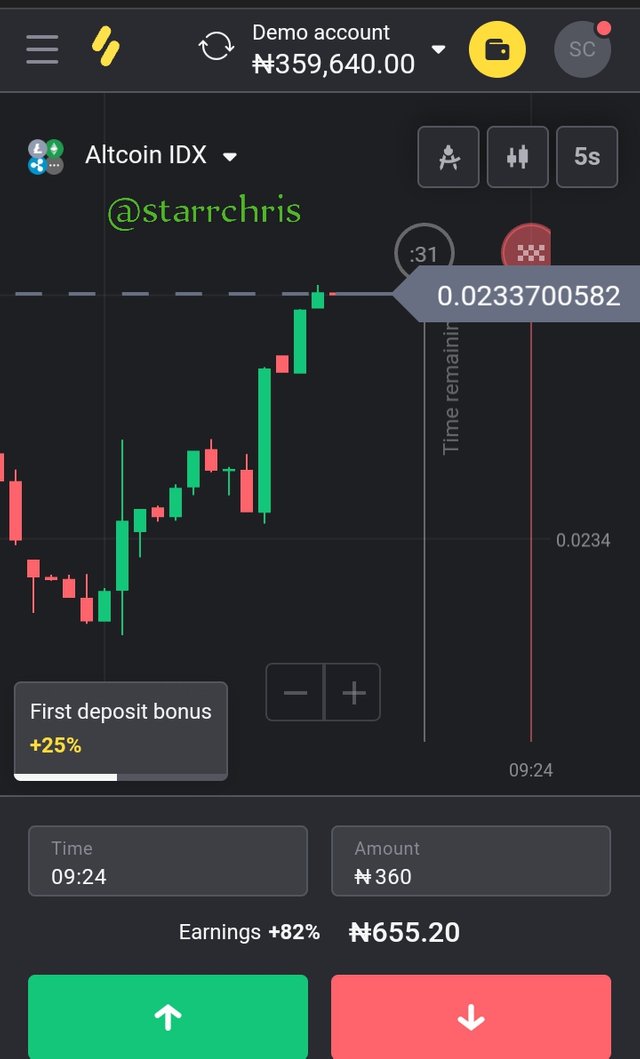
As we have said above in Crypto IDX, altcoins IDX Is a type of synthetic asset that is also a product of 4 different crypto currencies , in this case altcoins of four crypto currencies, which are
•Ethereum,
• Ripple,
• Litecoin and
• Monero.
The product of this combination called Altcoins, can only be bought and sold 24/7 on same platform as that of crypto IDX, which is called BinomoSignal Prediction TradingSignal prediction trading is the type of trading option found on Binomo platform. It's is type of trading that requires funding with your money to predict whether they asset will experience a bullish signal or bearish signal in specific period of time.

Is it illegal in my country?

Yes Signal prediction trading currently is legal in Nigeria my country . Do u know that, Binomo was officially launched in African and Asian continent in the year 2018, Binomo also announced Nigeria and a Nigerian, who is also a football star as one of Binomo official ambassadors.Due to Binomo association with Nigeria, Binomo permit the use of Naira as one of it's a currency for sending payment and the receiving of rewards as payment. The platform Binomo do permit the use of bank transfer from some Nigeria made bank.

If i am asked to create a penny index i would select
• Reef,
• Steem,
• Telos and
• XLM
Telos
.jpeg)
I selected (tlos) Because, Telos Is rated as one of the world most fastest and scalable developed Blockchain ever, in the crypto world. It is classified as part of the third generation Blockchain technology with added feature of web 3.0, it's has the capability and ability of running smart contracts the same way Ethereum do but it's very scalable in nature.Just like Telos and it's counterparts like Avalanche, Solana and Polkadot whose price has made wonderful movement recently,so therefore it's believed Telos still have a brighter future ahead. Currently Today (Tlos) is currently been at sold at a cost price of $0.666520 per Telos
Reef Finance.
.jpeg)
Reef finance is a Decenterlized Finance Defi aggregator, that satisfies the needs and wants of users or traders, with so many awesome Decenterlized Finance. Reef Finance was developed on polkadot and also has the strong security features of the polkadot ecosystem. This promising coin is usually used for interaction within polkadot ecosystem.Reef current selling price is $0.01967193
Steem
.jpeg)
I will definitely metion our own coin, steem if you notice that with latest project on ground called club5050, many users definitely will be holding their coins ,band when so many users hold their coins the would be so kind of scarcity of steem in market, this scarcity is expected to cause an increase and rise in the price of steem in no distance time. Today steem is sold at $0.4364.
XLM
_1.jpeg)
XLM is the known official symbol used by Lumens, it's was made the native token used to powers the famous Stellar Blockchain. I selected Stellar due to the fact that the project is seriously focused on transfer of currencies across different borders with a minimum costs. The XLM token helps to facilitates all transactions on the blockchain due to the fact that all fees are paid in the awesome currency. 0.00001 XLM is the fee paid for every transaction made. One awesome reason why i selected this token is that Stellar protocol operate on both institutional and individual level, thus fact makes its mass adoption very fast and popular.
Today XLM is sold at $0.295143.
What is Penny currencies ?
Penny currencies are crypto asset or currencies whose price are below $1 dollar. In this coin what traders are after are not the current price but the are after the probability that this Coins have a bright future ahead, just like my selected coins above, i believe they have a brighter future. This coins with great and bright future easily get adopted, one major aspect to check out while checking for coins with bright future is the condition or the use case of the coins due to the fact that help expose coins to investor's world wide.

Conclusion

After going through the awesome lecture and making some research, i would advise trader to always apply a technical analysing strategy or more when placing an order in the crypto market. The BICHI strategy is a type strategy that a traders to know about because its very effective and efficient, if used properly by any trader. Also i like the ideal of joining 4 awesome asset, such as coins and token such as Altcoin and Crypto IDX on Binomo platform, all thanks to the professor for the lecture now i can proudly say i am educated on how to use them.
Downvoting a post can decrease pending rewards and make it less visible. Common reasons:
Submit