
What is the difference between a simple moving average (SMA) and an exponential moving average (MME)? Explain how each is calculated and their typical use in trading. |
|---|

If you went through my last post you will notice that I said something about moving average technical indicators, if you can recall I said they are trend-based technical analysis tools. That is to say, they are used to check and predict the current trend in any crypto market or even the stock market. So therefore most traders trust and use these technical indicators because of their efficiency and effectiveness.
Although there are different types of moving average indicators cause of this topic, I would be talking about just two types of moving average indicators, these moving average indicators are very powerful tools that is to say when used efficiently and effectively and in the right method could generate you masterpiece information and data that you would cherished because of the profit is might generate you.
I will start with a simple moving average technical indicator, as the name implies simple moving average indicator one of the simplest types of moving average indicators. This is because they use the most simplest mathematical technique in generating their signals, that is to say, they use the famous arithmetic mean technique to generate data it is then seen as one of the simplest types of moving average indicator.
These sorts of indicators get their data from pre-existing price data that is to say generates data for historical price data seen on the chart. this collected historical price data and divided them by the number of period which was assigned to it. For example, if you use a 20-period moving average all the collected data would be divided by 20 to get a profitable trading signal.
For this reason, so many traders prefer to use this type of trading technique to make a profit and generate maximum trust in their trading strategy. The number of period In which a trader chooses depends on the sort of trade the trader wants to trade on and the time frame in which the trader is placing his strategies.
To calculate the Simple Moving Average we use the famous mean we were taught in secondary school. SMA= p1+p2+p3/ n, N= amount of periods selected. For example on a 50 period SMA, we would have to divide our total price by 50. My different price gotten is = 59,45,33,59,58...
Our SMA would be = 59+45+33+59+58 ,.../50
On the under hand we have the exponential moving average trading technique also known as EMA, this sort of trading technique is also a very effective influential, and famous sort of trading technique that has proven to generate profit and is trusted by so many experienced and profitable traders in the crypto market.
Unlike the other trading technique simple moving average trading technique, the exponential moving average trading technique is not simple because it uses a more intense and deep-rooted mathematical formula to trigger and find trusted signals for traders to use and generate maximum profit.
Also because of the working methodology of this EMA trading strategy, short-term traders prefer to use it to make maximum profit. This is because this trading technique known as exponential moving average possibly emphasizes and weights recent data which makes it very good at responding to the current market trend faster than other types of moving average techniques we have in the market
Exponential Moving Average (EMA)calculation
Cp: Closing price
Pp: Previous Price
Pd: Total EMA of yesterday
EMA = (closing price – previous day’s EMA) x weighting multiplier + previous day’s EMA
| Feature | SMA | EMA |
|---|---|---|
| Primary Function: | This is a very much simpler type of motion average that generates data from recent data points at a specific period of time | on the other hand EMA helps give more recent data or will I say latest data concerning the price movement at any period. This feature of this makes it much more complicated than the SMA |
| Calculation: | In this type of moving average they are metic mean of specific numbers last day points are used to predict the price movement | This type of moving average gives an emphasis or weight of recent data on the chart. This more weight gives it an edge over other indicators |
| Calculation formula | SMA= p1+p2+p3/ n | EMA = Cp * multiplier + EMA (previous day) * (1-multiplier) |
| Technical Usage: | This indicator is used for long-term traders in a less volatile market because of its time delays | Used by short-term traders because it's very fast to respond to the current price movement at every period. |
| LAG: | It's expected to have more lags because it focuses more on historical data | There is less data to work on because it focuses more on recent data. |

Explain what a 'Golden Cross' and a 'Death Cross' are in the context of moving averages. How do these setups influence trading decisions? |
|---|

The Golden Cross and the Dead Cross trading techniques are a very awesome and powerful trading strategy that every trader tries to have in mind while placing a trade, these two technical analyses are obtained by efficiently utilizing two moving average trading analysis indicators. It is very famous for its ability to produce profitable signals that would improve One price prediction while placing a trade at every period of time.
The Golden Cross and the Dead Cross are also self-explanatory that is to say whenever the word cross is mentioned, the first thing that comes to my mind is saying one indicator moving across the order indicator after some unique price movement in the crypto market at any period of time. I said is self-explanatory because whenever we hear the word golden it means something valuable or something precious that everyone wants and on the other side when you hear the word dead you should know they have to do with something falling or dying.
From my previous statement, you should understand by now what the term Golden Cross and Dead Cross means, in case you still don't get the full meaning I should break it down into a simple term that you would understand vividly. In the simplest format, I will say that the Golden Cross is the process whereby a faster moving average moves across the slower moving average (going upwards). In most cases, it is usually the 50-period Moving average (faster-moving average) that usually moves across the 20-period moving average.
On the other hand, the Dead Cross is a technical trading analysis strategy that shows that the faster moving average causes the slower moving average (going downward), also In most cases it is usually the 50-period Moving average (faster-moving average) that moves across the 20 period moving average is followed. This trading strategy gives traders the mindset of hope and signals that the price of the asset is going bearish or better still a sell signal.
In simple terms Golden Cross trading strategy has to do with a faster moving average crossing a slower moving average while moving upward, in most cases this signifies a buy signal. If gotten at the right time and noticed correctly it shows that a by pressure is around the corner so you can opportunity to place a buy order on the asset you intend on trading.

Looking at the chat above you say I set my time frame to 4 hours this is because I am using simple moving average lines to place my trade, as you can remember I told you it is most effective for long-term trade because of its delay.
After the Golden Cross, we could see that the price of Bitcoin went awesome hitting a new high, so therefore this is obvious evidence that The Golden Cross can help traders predict price movement at different periods.

In the above chart where I found a dead cross in a NEAR/USDT pair, also we can see that after the 50 period Moving average moved downward toward the 200 period Moving average. Looking at the chart, it's obvious with such an awesome trading technique a crypto future trader would make immense and very high profits in no distance time if the trader use this technique well.
Note: these trading techniques are indeed very important and very influential but I want to also say to you that this trading technique also needs other trading techniques or analysis tools to improve the price predictions.

Give a real-life example where Fibonacci retracements can be used to determine support and resistance levels on a trading chart. Use recent market data to illustrate your point |
|---|

Fibonacci retracement trading strategy is another awesome technical analysis tool that top traders all over the world use in conjunction with other indicators to predict the price movement of an asset at every given period. The main reason I love this Fibonacci retracement strategy is that its user interface is quite easy to understand and the indicator is usually friendly to set up even for new traders.
As the name implies Fibonacci recruitment strategy is a technical analysis that helps traders easily pinpoint any sort of retracement in the crypto market, this is because the Fibonacci retracement technical analysis tool is made up of horizontal lines that actors support lines or resistant levels. Because of the nature of this technical traders can now easily find support lines and resistance levels at a faster rate.
Also, it may amaze you to know that each line of the Fibonacci retracement varies in strength that is to say some lines tend to be more difficult to break through than other lines, for example, the 0.618 is stronger than 0.382 which is stronger than 0.236 Fibonacci retracement line, etc. although the other line could act as resistance line and support line 0.618 also known as the golden ratio is the strongest.
Also, it is expected to see a retracement in the price movement of the asset at any period it hits level zero (0)or level one (1), from my experience a retracement occurs almost 70% of the time the price hits the level zero (0)or level one (1) Fibonacci retracement lines. To know more on Fibonacci retracement, you can go through a post I made on it link.
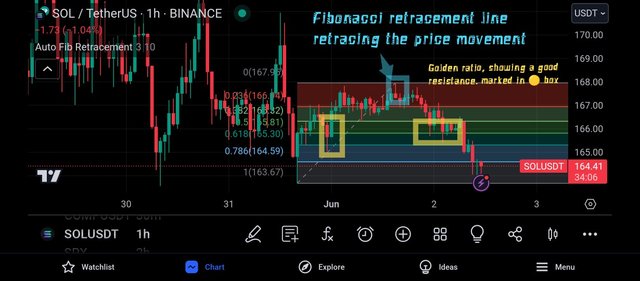
Plotting a chart of SOL/USDT, I added the Fibonacci with retracement trading strategy. As you can see the golden ratio which turned out to be found at Sol at $165.30, the line was tested numerous times before it finally broke free and the breakfast took it straight to $164.41. also, we could see how the price of Solana made an awesome retracement after hitting $167.9, it was also our point 0 on the Fibonacci retracement level.
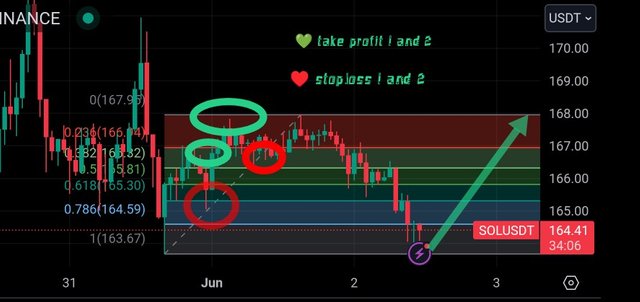
Also, the Fibonacci retracement strategy comes with a diagonal dotted line that helps us find stop loss and take profit efficiently and effectively. As you can see from the chat I carefully marked the stop loss and take profit which day dotted diagonal line usually black color identified Clearly to me.
Do you know why it's called Fibonacci retracement, instead of Fibonacci reversal? You might have noticed that all the price movement, happens between the points 0 to point 1. We all know retracement happens temporarily between a trendline and our trade rarely crosses from point 0 to point 1. So therefore as far as the price doesn't exceed point zero to point 1, the trend is undergoing a retracement, not a reversal.

Design a trading strategy using both EMA and Fibonacci retracements. Describe your approach to entering and exiting a position, as well as risk management. |
|---|

I have reason why I chose the trading pair FET/USDT, is that the asset has been facing difficulties and their a high chance of it crashing or having a serious bearish trend in fact a few known crypto exchanges have started deciding to delist the asset from the trading platforms. So with this fundamental knowledge, I believe the asset will experience a bearish trend very soon.
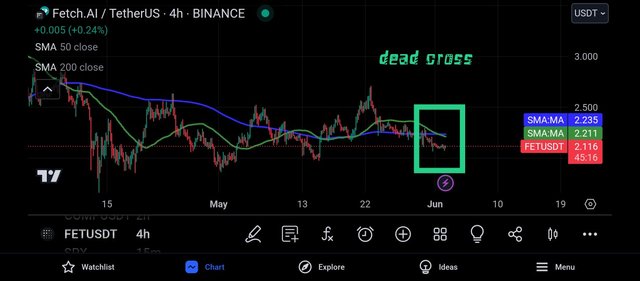
In the above chart, I am plotting a FET/USDT Pair in a 4-hour timeframe. To analyze the price movement of these two trading pairs I decided to use 2 SMA trading indicators, one of the SMA lines was a 50-period Moving average while the other line was a 200-period Moving average. Luckily for me, this strategy provided me with a signal as soon as I saw the Dead Cross on my trading chart. If you can remember vividly well I told you that dead Cross are very wonderful in producing sell signals.
As you can see the prize movement has started moving downward in a bearish direction just after the dead signal, and to confirm this I checked previous Dead cross signal and Golden Cross signals and I discovered this asset is very good in reacting with the dead cross signal and Golden cross signal.
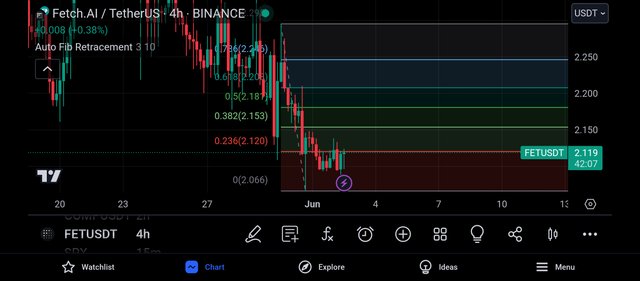
To confirm this Dead cross signal for my two SMA indicators, I added the Fibonacci retracement strategy and you might be amazed to see what I got. The price of the asset was seen retesting the 0.238 support line obtained from my Fibonacci retracement tool. For my observation, I believe the price movement will break the 0.238 support line to touch the point 0 line on my Fibonacci retracement strategy.
Risk Management.
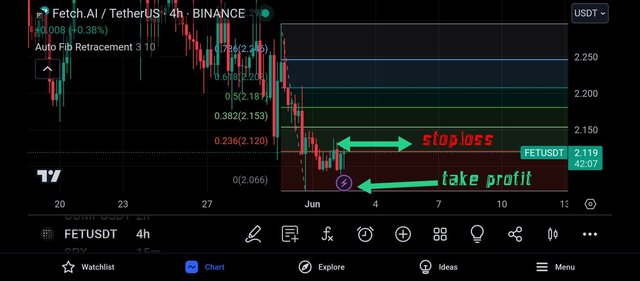
If I going to place that trade I would place a sell order, that is because my dead cross signal is telling me to move bearish. To be on the safety side I used a risk management technique known as take profit and stop loss. My stoploss would be 0.2120 and my take profit would be 0.2070, then my entry would be at the market price hopefully I believe it would generate me profit.

Analyze a historical trading chart of the STEEM/USDT pair where a 'Golden Cross' followed by a Fibonacci application led to a significant price movement. Explain how you would have negotiated this scenario. |
|---|

In the past few months, steem has been one of the most successful and outstanding cryptocurrencies because it has been growing smartly, although it had a small dip I know a retracement is inevitable and the retracement would take steem to the sky
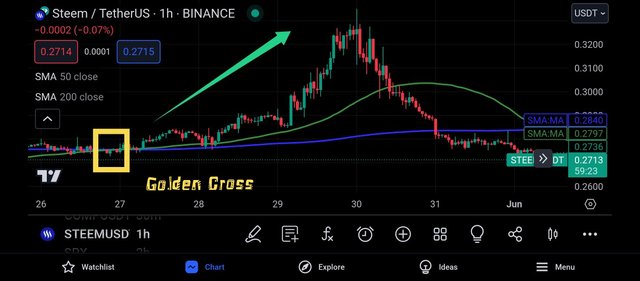
I have said numerous times the Golden Cross is a very awesome tool, as you can see on the 27th of May 2024 a Golden Cross was seen on a STEEM/USDT pair chart. It saw Steem move from $0.27 to 0.34 per steem within 3 trading days in the crypto market. Imagine seeing this signal on time and placing a trade, the amount of profit would have been massive and very very excellent.
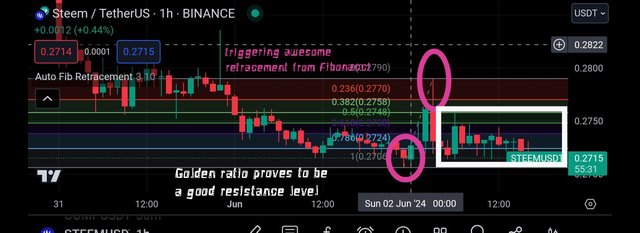
Similar things were seen in the Fibonacci retracement strategy, today at around 12:00 am the point 0 support line caused steem to retrace, moving from $0.2706 the 0.2770 and later moving back to 0.2710 after hitting the point 1 retracement resistance level.
Although it's currently the frighting the 0.238 Fibonacci retracement strategy which is acting as a support level, if it breaks the support level, we might see Steem going to the $0.2700 or $0.268 trading level before meeting the point zero support line that could send steem bullishly if it's strong enough to hold the sell traders.

In Conclusion |
|---|

I must say to you I appreciate the thing for creating such an amazing context, I learned a lot from this educational and inspirational contest. The moving average is a very powerful tool that has proven to be very influential are very effective when analyzing trade in the crypto market, in the same way, I will say the Fibonacci retracement strategy is also a wonderful technical analysis tool and I believe proper knowledge and timing it will make you maximum profit from your trade.
I wish to invite @kouba01 @sahmie, @liasteem, @drqamu and @hamzayousafzai @artist1111.
Upvoted! Thank you for supporting witness @jswit.
Downvoting a post can decrease pending rewards and make it less visible. Common reasons:
Submit
Upvoted. Thank You for sending some of your rewards to @null. It will make Steem stronger.
Downvoting a post can decrease pending rewards and make it less visible. Common reasons:
Submit
Greetings friend,
As always, I'm never surprised with your work rate and I must say that you hit the spot. The moving average and Fibonacci retracement strategy are indeed powerful tools in any kind of financial market and not just for cryptocurrency trading as these indicators help traders analyze trends and make informed decisions for maximizing profits. Therefore with the right knowledge and timing, these tools can be game-changers in the trading world. Keep exploring and utilizing these strategies for successful trading and good luck to you.
Downvoting a post can decrease pending rewards and make it less visible. Common reasons:
Submit
Thank you friend you know that your content and your comment means so much because of your expertise and your hard work you put into the platform. I appreciate you for honoring my invitation I'm making a comment on my article thanks I appreciate.
Downvoting a post can decrease pending rewards and make it less visible. Common reasons:
Submit
Great analysis! You've provided a thorough explanation of moving averages and Fibonacci retracements, highlighting their significance in trading strategies. The detailed breakdown of SMA and EMA, as well as the explanation of the Golden Cross and Death Cross, is very informative.
Downvoting a post can decrease pending rewards and make it less visible. Common reasons:
Submit
Thank you friend for such awesome comment I really appreciate your comment dear friend.
Downvoting a post can decrease pending rewards and make it less visible. Common reasons:
Submit
You have explained every section in a crystal clear manner. I felt connected to your write up .
Ah, that's true! The Golden Cross is a well-known indicator for predicting upward trends. I think you explained it very well, especially how it signals a potential buy opportunity. It makes sense why many traders rely on this.
I agree, this is a clear and straightforward explanation of the Golden Cross. It's helpful for beginners to understand how this crossing indicates a bullish market. I think using simple terms really makes it easier to grasp.
Yes, I think you're right about the Fibonacci retracement being a valuable tool. It's amazing how traders globally use it to identify key levels. Combining it with other indicators definitely seems to enhance its effectiveness in predicting price movements.
Ah, that's interesting! I didn't realize the different Fibonacci levels had varying strengths. It's fascinating how the 0.618 level is particularly strong compared to others. This detail is really useful for understanding how to use the retracement lines effectively.
Good luck .
Downvoting a post can decrease pending rewards and make it less visible. Common reasons:
Submit