Define the Commodity Channel Index (CCI), explain its role, calculation formula, components, main purpose, history, and interpretation of overbought and oversold values with real-world examples.
Explain overbought and oversold levels, CCI buy and sell signals. Show historical charts demonstrating the use of CCI to spot reversals, and discuss potential limitations of CCI and methods to mitigate them.
Discuss the advantages and disadvantages of CCI, its use with other indicators, the risks of false signals, and the impact of cryptocurrency volatility on the effectiveness of CCI.
Choose a recent Steem/USDT chart, use CCI to analyze and identify reversal points, annotate the chart, and explain the method used. Discuss the validity and usefulness of these reversals for trading.
Describe a CCI-based trading strategy, explain the buying and selling rules, provide historical or simulated examples showing the strategy's effectiveness, and discuss potential modifications to improve its performance.

Hey dear friends it's with great pleasure that I'm making an entry for this week engagement challenge in this awesome community, today I'll be talking about CCI technical tool and how to implement it in the best of my knowledge. I hope as you go to you learn more educative and interesting knowledge from the article.

The Commodity Channel Index (CCI) is a type of the very popular momentum-based oscillator used for technical analysis while trading, it's used to identify overbought and oversold conditions and potential trend reversals in a market most especially the crypto and commodity market.
The Commodity Channel Index (CCI) was created by Donald Lambert in 1980, he created
it initially for analyzing commodity market but it's now used in different market to analysis trades. The developer Lambert introduced this tool in an article for Commodities magazine. He created the the CCI trading tool to accurately calculate the variation of a security’s price from its average price, so therefore making it a useful tool for identifying cyclical trends in commodities.
Calculation Formula and Components
The Commodity Channel Index is calculated using the following formula:

Where:
•Typical Price (TP):
The typical price is the average of the high, low, and closing prices of a security for a given period:

•SMA:
In full means Simple Moving Average of the typical price gotten from the previous formula over a specific number of periods (usually 20).
• Mean Deviation: The mean is the average of the absolute deviations of the Typical Price gotten from its SMA.
• 0.015: This is a constant that helps ensures about 70-80% of the CCI values fall between -100 and +100.
Role of CCI in Technical Analysis
The main purpose of the CCI is to help traders identify potential buy and sell signals. It provides this data by generating the new extreme price levels in relative to the historical average price.
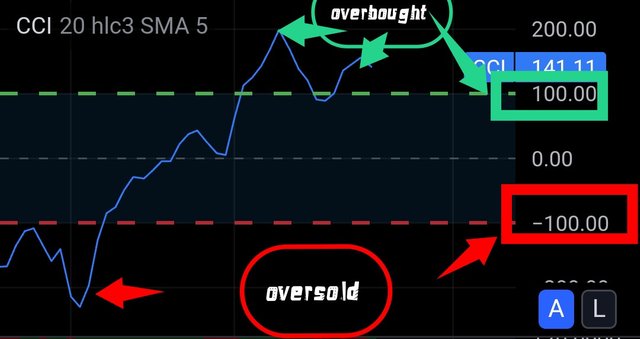
• Identify overbought and oversold Signals: A CCI is another excellent too that traders uses efficiently to marking overbought and oversold Signals, on the chat any signal above +100 is often marked as an overbought condition, while any signal seen below -100 is rated as an oversold Signal.
• Spot trend reversals::
In as much as the fact CCI is used to find overbought and oversold Signals, it can also give signal of a potential price reversal. That's to say whenever there is an upcoming trend reversal the CCI can be used to identify it and keep it's trader safe from loss.
Interpretation of Overbought and Oversold Levels
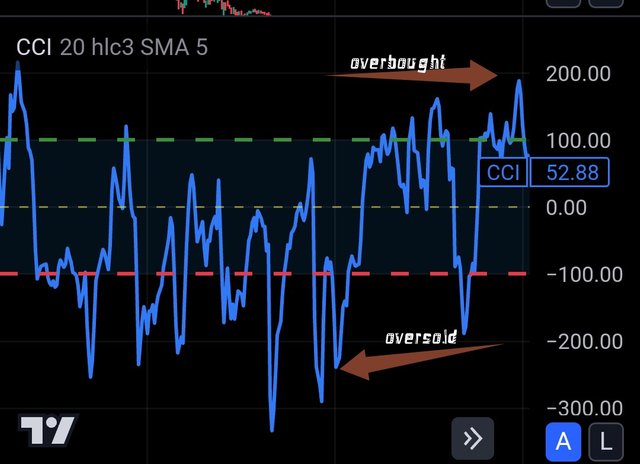
Trading view
• Finding Overbought signal:
When the asset price goes above +100, the asset is considered to be in experiencing an overbought trend, as we all know whenever there is an overbought signal there are high chances that they might be an upcoming sell pressure that might be leading the asset to move downward. As seen in the picture above when the price of the asset crossed the + 100 Mark point on the indicator CCI and the price of the asset started to move downward. So therefore in summary I will say the CCI indicator helps generate a sell signal by marking and overboard in the market.
• Finding Oversold Signal :
On the other hand, when the asset price goes downward and crosses they -100 point, the asset is considered to be in experiencing an oversold trend, as we all know whenever there is an oversold signal there are high chances that they might be an upcoming buy pressure that might be leading the asset to move upwards. As seen in the picture above when the price of the asset crossed the -100 Mark point on the CCI indicator and the price of the asset started to move upwards. So therefore in summary I will say the CCI indicator helps generate a buy signal by marking and oversold in the market..
Real-World Examples
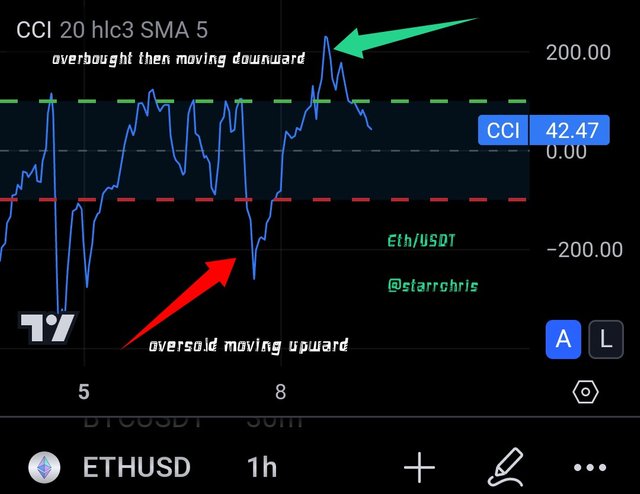
For this assignment I would be using a CCI indicator on ETH/USDT 1 hour time frame chart, with the help of the CCI indicator you can see that after it's signaled and overboard the cci started moving downward trying to find the place for it self below +100 Mark point. From this example it's obvious that it is producing an upcoming sell signal, which means is it is the best time for any trader to place a short trade.
Also on same chat before this overboard signal was found, there was an oversold signal which I marked in the picture above, and if you monitor the chat well you will notice that after that oversold signal the price of the asset started moving upward which means it would have profited any trader who longed that trade.

Explain overbought and oversold levels, CCI buy and sell signals. Show historical charts demonstrating the use of CCI to spot reversals, and discuss potential limitations of CCI and methods to mitigate them. |
|---|
One of the Major use case of this indicator is that it is mostly used by most traders to analyze, predict or find overbought signals and oversold signals in the different market it is used. As I've said previously whenever the cci moves above + 100 Mark point then traders begin to expect and overbought signal which also means a sell signal, on the idea and when the cci move below during - 100 Mark point it is said to be signaling an oversold in the market it is used, which in other words means a buy signal is on it way.
Oversold signal
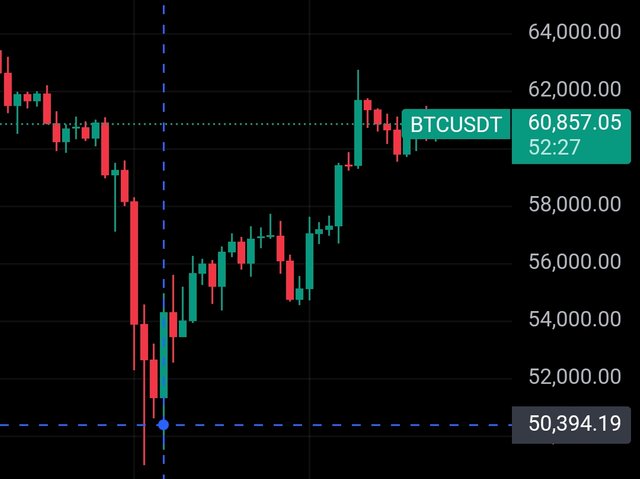
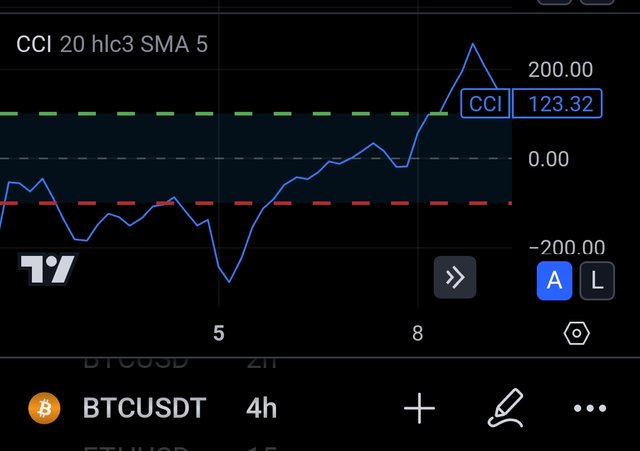
In the above chart I plotted BTC/USDT in a 4 hour time frame, on the 05/08/2024 the CCI moved downward below - 100 to generate an oversold signal. If you remember vividly well whenever I talk about and oversold signal I also link it to a buy signal because this is true. As you can see on the chat if investors bought BTC at the point where this cci technical indicator generated that oversold signal which is worthy around $50,000, that investor would have been in profit of $10,000 today because after they oversold signal came up they buyers took control of the market and the price of the asset moved bullishly or upwards.
Overbought
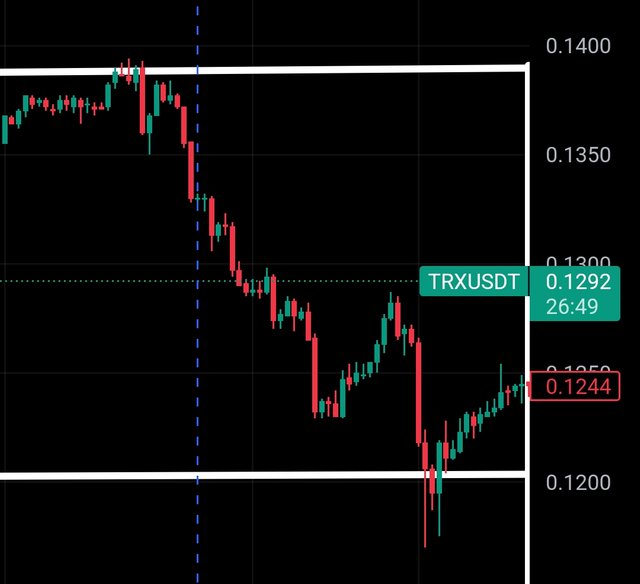
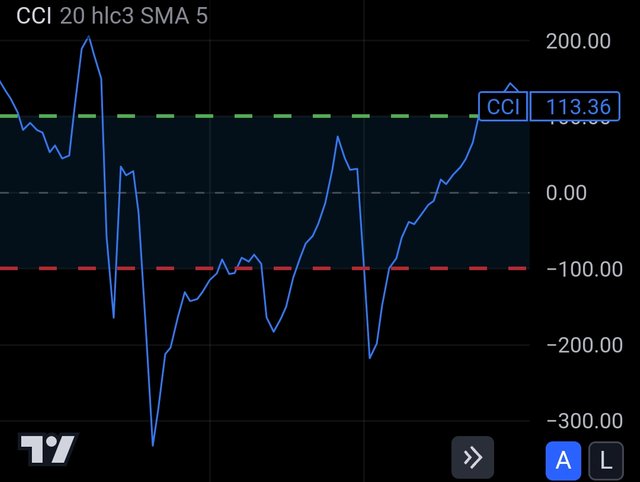
In the above chart I plotted TRX/USDT in a 4 hour time frame, on the from 29/07/2024 to 05/08/2024 the CCI moved upwards above +100 to generate an overbought signal. If you remember vividly well whenever I talk about and overbought signal I also link it to a sell signal because this is true. As you can see on the chat if investors had bought TRX at the point where this CCI technical indicator generated that oversold signal which was worthy around $0.1400, that future trader would have been in profit. because after they overbought signal came they sellers toook control of the market and the price of the asset moved bearishly or downward.
Limitations
If you have been consistent in reading my crypto articles you would know that my number one advice is that no trading indicator is perfect, so therefore I advise traders to add other trustworthy indicators, strategy, an analysis tools to to come up with a smart idea that would generate you profit in the more accurate manner.
Methods To Mitigate
The best way to mitigate such limitations when using the cci technical analyzing to is to wait for your confirmation signals before placing a trade that is to say you make sure you confirm those signals gotten from the cci technical analyzing tool. This is because it's not advisable to use just one technical analysis tool or just one strategy to Scott for signals is the crypto market. In other words add other technical analysis tools or strategy to increase the accuracy of your predictions.

Explain overbought and oversold levels, CCI buy and sell signals. Show historical charts demonstrating the use of CCI to spot reversals, and discuss potential limitations of CCI and methods to mitigate them. |
|---|
In as much as they are so many awesome benefits of using this technical indicator they are also downside that hold put any trader into loss if not carefully watched or used, I would be talking about the numerous advantages and disadvantages of using this technical analysis indicator tool.
Advantages of the Commodity Channel Index (CCI)
• It's Versatility:
One of the biggest advantages of using the CCI is that it's very versatile, this is because although it was originally designed for commodities markets, it can now be used
in almost every other market like stocks market, forex market, indices market, and crypto market.
• Identification of Overbought and Oversold Signal:
One of Commodity Channel Index (CCI) important use cases is to identify overbought and oversold signal in the Crypto market, that is to say it helps traders easily identify and generate trading signals wether buy signals or sell signals. Whenever it's signals and overbought experience traders sees it as a cell signal while whenever it showcase a overbought signal professional and experience traders sees it as a buy signal.
Speed:
Unlike so many other trading indicators which produce signals lately or during the actual event, they Commodity Channel Index often generates long and short signals before a trend reversal begin. This act of the indicator helps traders efficiently use signals at the right time to generate a lot of profit while trading any assets.
Ease of Use:
Unlike so many other types of technical analyzing indicators that turns out to be very difficult to read or understand, they Commodity Channel Index (CCI) indicator is very easy to read and understand. This is because the chat in which he present it's very clear and moves in a single direction at a particular period of time.
Disadvantages of the Commodity Channel Index (CCI)
• False Signals:
This is no news now as every experience trader in the crypto market knows that no technical analyzing tool his perfect, at times the CCI technical analyzing to usually generate four signals to trade as using them, that is why it is always advice to add up some other strategy and other technical direct you to to the CCI technical analysis of getting accurate price prediction
• Not to be used in a Short Timeframe:
Due to the structure laid on ground for the cci technical indicator tools, analyst and investors have advised that it is not wise or smart enough to use CCI indicators while trading on a short term timeframe. This is because the cci technical analysis indicator is most effective in long-time frame trading.

Choose a recent Steem/USDT chart, use CCI to analyze and identify reversal points, annotate the chart, and explain the method used. Discuss the validity and usefulness of these reversals for trading. |
|---|
Just like every other asset in the crypto ecosystem the STEEM price movement can be monitored using this commodity channel index indicator, below you will see how are you used the commodity channel index technical indicator to properly analyze the prize movement of Steem asset. Before that I will be talking about how to add the commodity channel index indicator to your trading chart through few steps.
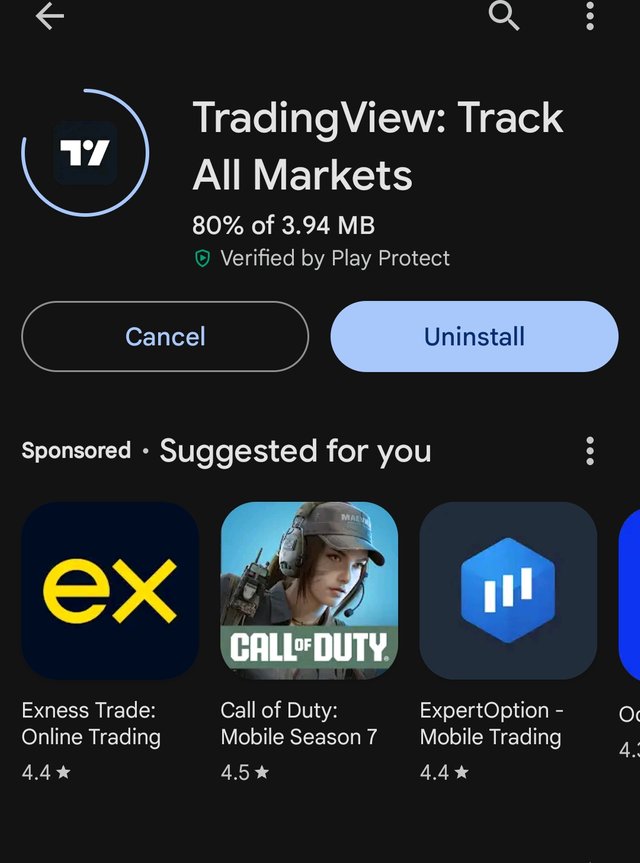
Step 1: I downloaded trading view from playstore
Step 2: I opened the application by clicking on it
Step 3: I click on the chat symbol to take me to different the chat.
Step 4: I typed in CCI on the indicator search bar and It appeared on the chat as seen on the image

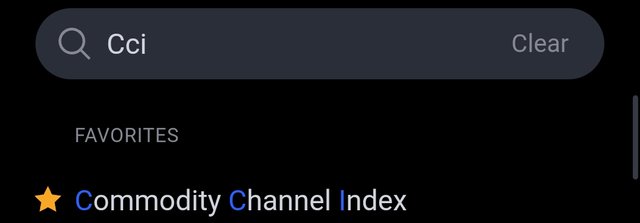

In the above image you can see how easily you can easily add the indicator to any asset you want to Monitor, below I'll be using the commodity channel index indicator to analyze the Steem asset efficiently and effectively.
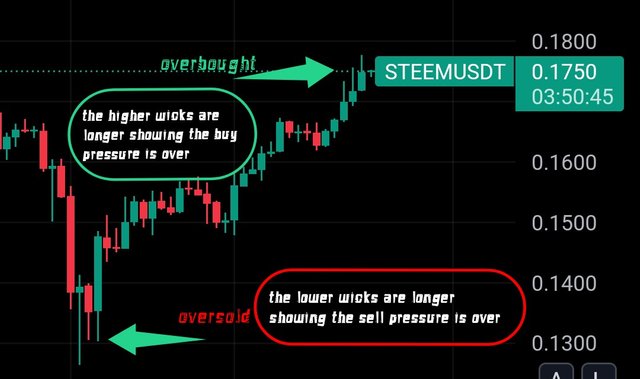
In the above chart I plotted STEEM/USDT in a 4 hour time frame, the CCI moved above + 100 to generate an overbought signal. Despite the fact that I have been seriously hoping to see steam go bullish in the nearest future, the cci technical analysis tool it's giving me overbought signal showing that in the nearest future the sellers will take control of the market for a little while before they main bullish one begins. Although I didn't make in-depth calculations with other indicators but my Japanese candlesticks is showing longer upper wick which shows that the buyers are gradually losing control of the market.
Mere looking at the chat I expects a price reversal very soon, that is if our CCI technical analysis indicator is not giving us a false signal. As I have said earlier in the post whenever the cci gives us an overboard signal or an oversold signal their high chances we see a price reversal in that asset as I have proved in other historical chat. If you can remember I said one of the main advantage of using this cci technical analysis tool is that it is very very easy to use, so therefore the method I use is I keep an eye on the cci movement and wait for you to cause the negative 100 or the positive 100 Mark point before I can make a a statement that there is high chance of a price reversal in distance time

Describe a CCI-based trading strategy, explain the buying and selling rules, provide historical or simulated examples showing the strategy's effectiveness, and discuss potential modifications to improve its performance. |
|---|
The popular commodity channel index technical analysis indicator is an excellent to that has proven its excellence by generating effective efficient and awesome by signals and cell signals to trade as to help them maximize their profit while trading in any type of market most especially the commodity market and the crypto market.
Sincerely speaking this commodity channel index also known as cci technical analysis indicators are very powerful and quite trustworthy when implementing or analyzing and assets with a long time frame waiting for an hour above. This is usually done to clear out my no impurities that could affect the accuracy of the signals generated by this commodity channel index technical analysis indicator.
Although it is not advised to use just the commodity channel index indicators while analyzing, for safety purpose it's advice you use other indicators strategies or technical tactics to add up with the analysis and signals gotten from this commodity channel index indicators, this will help improve the accuracy of the buy and sells signals given by the indicators.
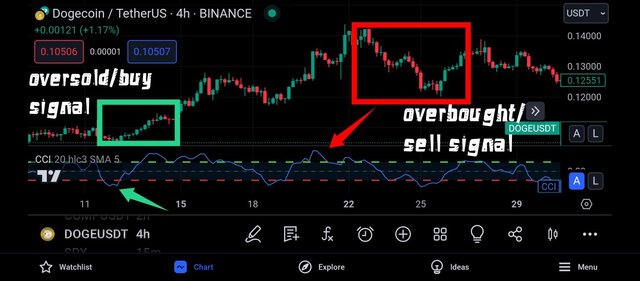
Mere looking at the DODGE/USDT on a 4 hour time frame, on the 12-07-2024 I was lucky enough to get two signals one was a buy signal and the other was a sell signal. The buy signal came after the commodity channel index technical indicator tool signaled an over sold on Dodge asset, shortly after they are signal there was a buy pressure that took dodge from $0.10 to$0.126 in flew days.
The sell signal came after the commodity channel index technical indicator tool signaled an Overbought on Dodge asset on 24-07-24, shortly after they are signal there was a sell pressure pressure that took dodge from $0.16 to$0.12 in flew days. If a trader had followed this signals within 2 weeks a trader would have been in massive profit because the signals given by the commodity channel index where accurate.

In Conclusion |
|---|
In the crypto market there are so many technical analysis tools but among those amazing technical indicators there is a very important tool known as the commodity channel index technical analysis indicator. This indicator has took a lot of traders into profit and is still taking more traders into profit, although it is very important and powerful it also have beside effect. So therefore I advice heavy trader to use this to with caution and carefulness.

I want to use this medium to invite @sahmie @eliany @rafk @hamzayousafzai @hooriarehman, thank you very much for going through I really appreciate your support, remember STARRCHIS cares ❤️ .
Upvoted. Thank You for sending some of your rewards to @null. It will make Steem stronger.
Downvoting a post can decrease pending rewards and make it less visible. Common reasons:
Submit
Thanks for going through my post
Downvoting a post can decrease pending rewards and make it less visible. Common reasons:
Submit
Hi my dear friend.
Greetings to you. I'm really excited to read from your entry.
You broke down your work Into simple understanding and in such a way that everyone visiting your post can I'm understand.
Analysing, you have define CCI really well stating it characteristics for overbought and oversold conditions.
Stating well the Formula to calculate CCI.
I appreciate your analysis on CCI on overbought and oversold conditions. Where we have to discuss on the +100 and -100 level of CCI values. Which clearly explains the price situation at the point.
I'm impressed with your explanation and demonstration of using CCI with other indicators to gain profitable market insights.
Your historical charts and demonstration in it effectiveness in real real life are all accurate.
Overall great mastery of work. Good luck in the contest sir.
Downvoting a post can decrease pending rewards and make it less visible. Common reasons:
Submit
I really appreciate your comment friend
Downvoting a post can decrease pending rewards and make it less visible. Common reasons:
Submit
I appreciate the detailed explanation of how CCI can be used to identify overbought and oversold conditions spot trend reversals and its advantages and limitations. The real-world examples you provided illustrate how CCI signals can be applied in practice which is really helpful.
Good luck with the contest!
Downvoting a post can decrease pending rewards and make it less visible. Common reasons:
Submit
Thanks for sharing your opinion on my post
Downvoting a post can decrease pending rewards and make it less visible. Common reasons:
Submit
This is good guide to understand about Commodity Channel Index. You explore details nicely that readers can take a key note from it and help them in their trading skills.
Downvoting a post can decrease pending rewards and make it less visible. Common reasons:
Submit
Thanks for the value you gave my post
Downvoting a post can decrease pending rewards and make it less visible. Common reasons:
Submit
You have an extensive and simple article too, you were so pratical in your article. You shared that the major weakness of the CCI indicator is false signals, it's crucial to always analyze these trade from higher time frames to get better approach of being successful in your trade. Above all it's important to combine the CCI with other indictors and technical analysis procedure to be a profitable trader. Success to you as see you and cheers in the challenge
Downvoting a post can decrease pending rewards and make it less visible. Common reasons:
Submit
Yeah friend, you spoke from serious wisdom
Downvoting a post can decrease pending rewards and make it less visible. Common reasons:
Submit