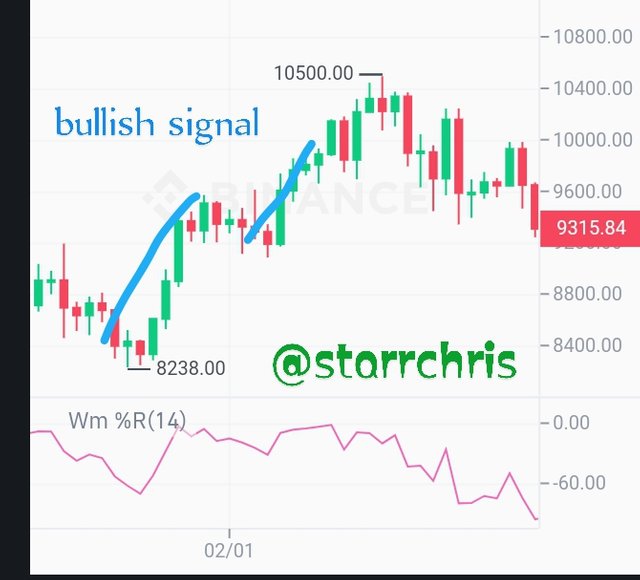
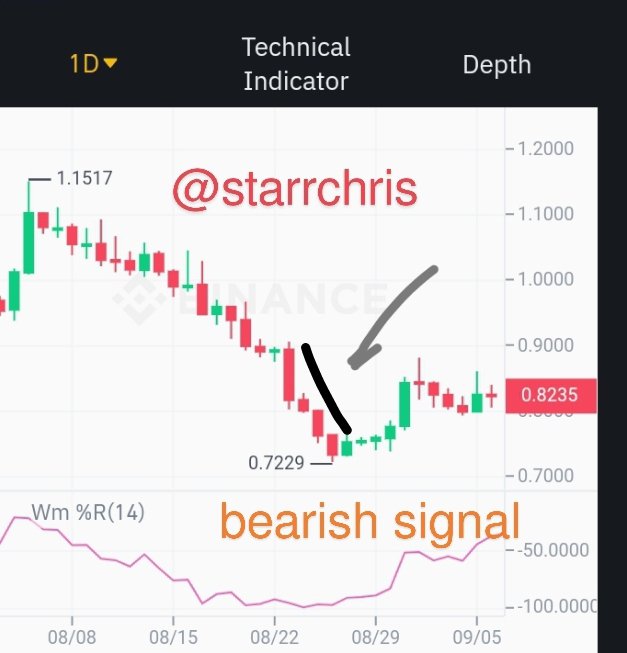
EXPLAIN THE JAPANESE CANDLESTICK CHART (ORIGINAL SCREENSHOT REQUIRED)
IN YOUR OWN WORDS, EXPLAIN WHY THE JAPANESE CANDLESTICK CHART IS MOST USED IN THE FINANCIAL MARKET
DESCRIBE A BULLISH AND BEARISH CANDLE. ALSO EXPLAIN ITS ANATOMY. ( ORIGINAL SCREENSHOT REQUIRED)

Good day lovely Steemians, how is your day going? After going through the tutorial made by our awesome prof @reminiscence01, i have decided to answer the questions which have been asked by our prof on this post.

EXPLAIN THE JAPANESE CANDLESTICK CHART (ORIGINAL SCREENSHOT REQUIRED)
Japanese candlestick can be defined as a graphical representation of the movement of price of asserts or commodities in the market. It was named "Japanese candlesticks Chart" because was founded and used first in Japan in the 1700's by a trader known as Munehisa Gonna.
The Japanese candlestick is so old that it was already in use before the innovation and invention of Cryptocurrency. It was famously used to determine the price, the opening and closing of any commodity or assert in the crypto market or exchange market. It is also used to check how the crypto or exchange market responds, to all these changes, the Japanese candlesticks, is known for its ability to determine, the next market move, that is if it will be bearish movement or bullish movement.
The Japanese candlestick has a simple and easy to understand structure, that is just by looking at the chart you would easily predict and see details about the technical analysis and the movement of price at that particular time.
A imagine of japanese candlesticks
.jpeg)
The Japanese candlestick is a combination of two colors which are green and red, the green signifies the bullish signal, while the red signify bearish signal in a green and red colour, that is green signifies that buyers have taken over the market while the red signify that sellers have totally taken over the market price at that period of time.
Note : This color combinations are default color combinations. These colours combinations can be configured as a user want.

IN YOUR OWN WORDS, EXPLAIN WHY THE JAPANESE CANDLESTICK CHART IS MOST USED IN THE FINANCIAL MARKET

• The Japanese candlestick as i have said earlier it is used for predicting movement of trade of asserts or Cryptocurrencies even the financial institutions also uses this "Japanese candlesticks" in analyzing price.
• Another reason why financial institutions, financial markets make use of the Japanese candlestick, it is because it has a simple and easy to understand structure, By mere seeing the charts, you can easily understand what each of those candlesticks stand for.
• The Japanese candlesticks Chart are wildly known to provides very reliable information and data, hence, the Japanese candlestick chart is a basic tool used in cryptocurrency trading, That gives a higher percentage rate of success in make trading decision.
.jpeg)
Reference
• The Japanese candlestick is most used in the financial markets, due to it good summary of price fluctuations.
• Japanese candlestick chart helps trader's to minimize chances of losing and maximize the chances of profit in trading as they are inform traders on a fast rates, the best period to perform trade on a particular asset.
• The Japanese candlestick help cryto traders detect when the market is giving a bearish siginal or bullish signal.
• Japanese candlesticks also inform traders on the strength of the the bearish signal and bullish signal detected.
• The Japanese candlestick chart helps trader's easily identify the major four components (low, close, open and high).

DESCRIBE A BULLISH AND BEARISH CANDLE. ALSO EXPLAIN ITS ANATOMY. ( ORIGINAL SCREENSHOT REQUIRED)

Bullish Candle

The Japanese bullish candlesticks, are usually green by default settings, it is usually indicates the increase in price of an assert at a particular period of time. The bullish candlesticks tells the buyers have taken control. It's the best time for sellers to sell their assert and make maximum profit. Because they are much sellers in the market, it can be said that the buyers are in control of the market at that moment.
Bearish Candle

The Japanese bearish candlesticks, are usually red by default settings, it is usually indicates the decrease in price of an assert at a particular period of time. The bearish candlesticks tells the sellers have taken control. It's the best time for buyers to buy their assert and make maximum profit. Because they are much buyers in the market, it can be said that the sellers are in control of the market at that moment.
Anatomy of a bullish and bearish Japanese candlestick chart.
.png)
The component of a candlesticks anatomy consist of :
- Open
- Close
- High
- Low
- Real Body
Opening price (Open)
The opening price also known as the Open shows the beginning or starting of the price movement of assert or Cryptocurrencies . The price is identified and marked as price move at a period of time. It also indicate the first price of the assert at that time.
Highest price (High)
As the name implies, This part the candlestick shows traders on the highest price of the assert at that particular period of time.
Lowest price (Low)
As the name implies it signify, identify and show traders the Lowest price of an assert the part of the candlestick shows the lowest price recorded within a specified time.
Closing price (Close)
As the name implies it's identifies, shows and signify the last price of an asset at that particular period of time, It also identify the end of price movement of the assert.
Real Body
The real body of a Japanese candlesticks shows the momentum of each candle. It also shows distance covered by price of asserts at a particular moment. It is the difference the opening price and closing price of the assert at that moment.
Conclusion
Thank you very much for the lecture prof, i am glad that i am informed and educated on the fact and knowledge about candlesticks Chart. Candlesticks are very reliable tools for predicting, movement of price of an assert in the market. I now know the difference between brearish and bullish candle. I now know the bullish candle inform me that it is the best time to sell my assert while bearish dose otherwise.
I must say Prof @dilchamo, you are doing well, you are very hardworking and i admire you for that, keep it up.
Cc
@dilchamo
Downvoting a post can decrease pending rewards and make it less visible. Common reasons:
Submit
Downvoting a post can decrease pending rewards and make it less visible. Common reasons:
Submit