Hello Steemians, it's a pleasure and a privilege to be here. Technical Indicators are traders' best friends because they help in technical analysis in highlighting critical points in trading. Prof @reminiscence01 explicitly detailed the concept of technical indicators. I will be doing the homework task from this study.

.png)
1a: In your own words, explain Technical indicators and why it is a good technical analysis tool.
.png)
Technical Indicators
Technical Indicators are mathematical derived patterns or symbols representing historical data of price action on the chart used to predict future price movement by traders during technical analysis.
During technical analysis, traders use technical indicators to help predict price movement from historic price data to ascertain trading entry and exit points. Technical indicators are graphically represented.
Price actions on previous market areas tend to repeat themselves because of the psychological cycle of traders and the law of supply and demand. Technical indicators help to identify such regions in the future and predict the price action.
Technical analysis is used by traders or investors when trading to analyze price movement to get good entry and exit points in the market. Technical analysts use heuristic technical tools to help predict market outcomes using data from historical happenings to supply and demand.
Technical indicators are an essential technical analysis tool because they represent data derived from mathematical calculations of historical data that helps technical analyst predict future price actions. When paired with other technical analysis tools, technical indicators help provide better accuracy in the trade signal given during technical analysis.
Technical indicators also help identify and interpret trend strength and direction, which is vital during technical analysis. For example, following the law of supply and demand, some technical indicators tell us when a market is overbought or oversold, indicating either an increase in demand or supply.
.png)
1a: Are technical indicators good for cryptocurrency analysis? Explain your answer.
.png)
Technical indicators are essential for technical analysis when trading cryptocurrency. This is because technical indicators help traders identify or confirm entry and exits points when trading.
Cryptocurrency is a highly volatile market. Therefore, trading on cryptocurrency without technical tools like technical indicators is considered foolhardy. Technical indicators, as stated earlier, are derived from mathematical calculations of historical data to help predict future price actions; this is important in trading cryptocurrency. It enables the trader to predict price movement even in its volatile state.
Furthermore, some technical indicators like the KDJ indicator use the concept of supply and demand to showcase when a price is being oversold and overbought. This is useful in cryptocurrency trading as this lets the trader understand the psychology of other traders and when it's safe to buy or sell.
Finally, technical indicators help crypto traders have good trade management. By giving early signals, the trader can set his stop loss and take profit as this helps limit losses and ensure profit.
.png)
1c: Illustrate how to add indicators on the chart and also how to configure them. (Screenshot needed).
.png)
Adding Indicator to Chart.
Adding Indicators on the chart is a straightforward process. There are many trading sites, but for this task, I will be using the Trading View Site to illustrate how to add indicators to a chart.
First, I visit the trading view site using the link above. Then, on the trading view homepage, I click on the chart.

The chart page on Trading view. ADAUSDT pair.
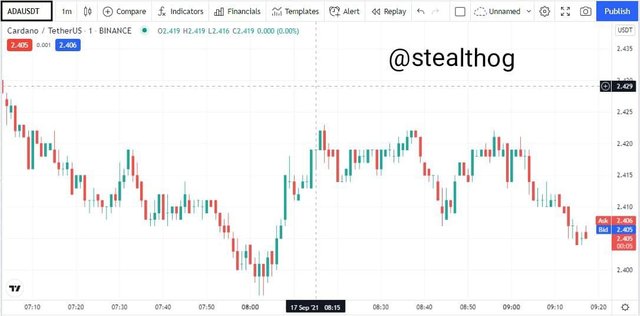
Click on the indicator button as shown below.
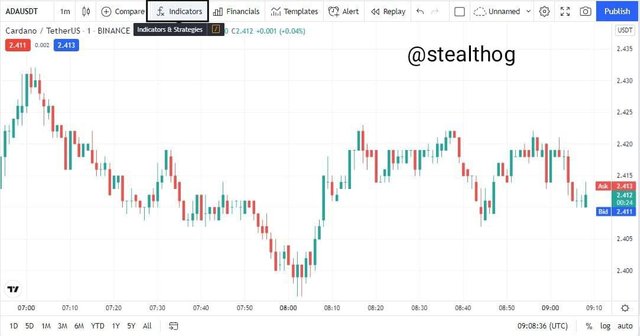
After I click on the indicator button, a search bar appears to type and search the indicator of your choice. When the indicator searched appears, click on it.
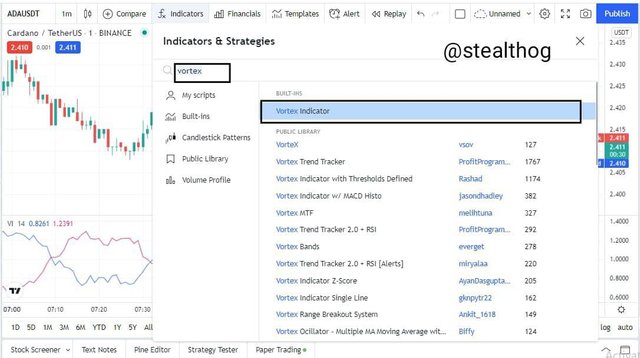
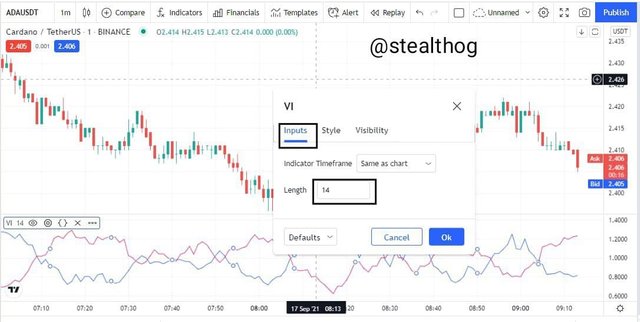
After clicking on the indicator of choice(I chose the vortex indicator, which falls under the Volatility based indicator category), It was added to the chart. As shown below
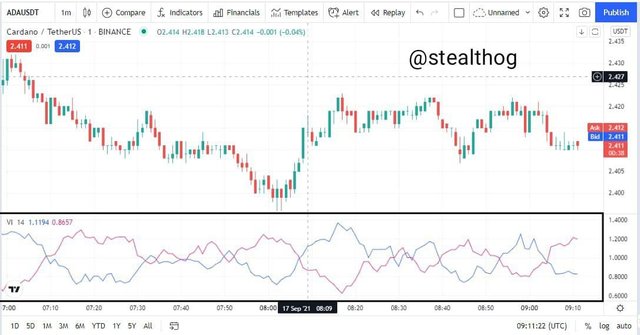
Indicator Configuration.
To configure the indicator, we click on the indicator settings.
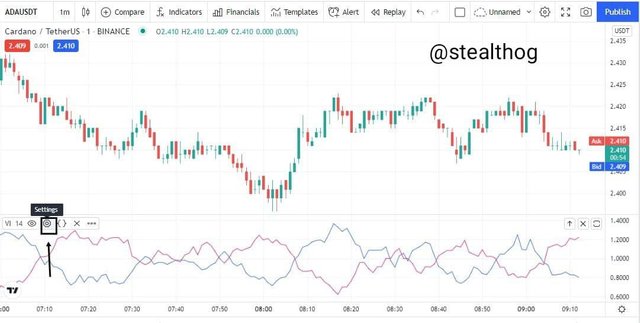
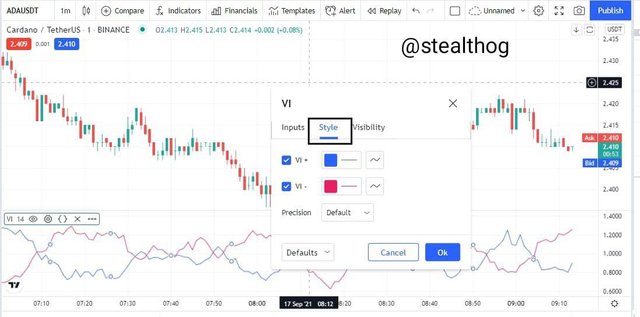
A pop-up appears consisting of 3 aspects of the indicator settings, which include Style, Visibility, and Input.
The VI+ line is set as blue on the Style setting, and the VI- line is set as red.
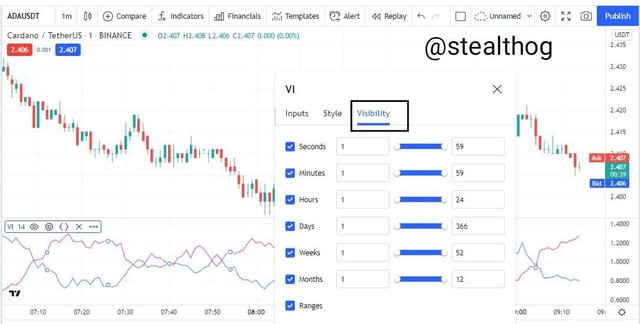
On the Visibility setting, the parameters are left on default.
On the input settings, the length is set to 14 as it is the recommended period for the vortex indicator.
.png)
2a: Explain the different categories of Technical indicators and give an example of each category. Also, show the indicators used as an example on your chart. (Screenshot needed).
.png)
Categories of Technical Indicators
Technical indicators are divided into categories as they each tend to different trading styles of traders. These categories are outlined below.
Trend Based Indicators.
The whole idea of trading is to either buy or sell, which is determined by the direction of the trend. A market can either be on a downtrend, uptrend, or on a range. Therefore, trend-based indicators come in handy to help traders identify the current trend direction and strength.
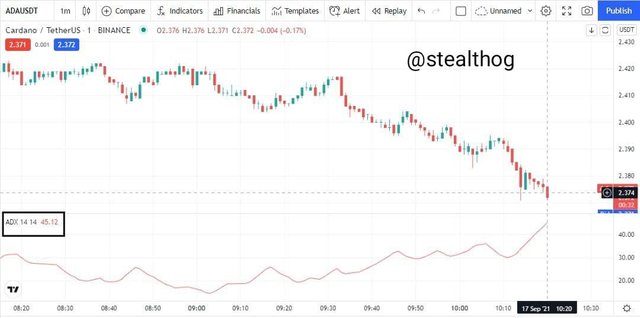
An example of a trend-based indicator is the Average Directional Index that helps traders interpret trend direction and strength. The graphical illustration below shows the ADX showing trend direction and indicating strength on a 1-100 scale (Downtrend and trend strength 45).
Volatility Based Indicator
Volatility-based indicators are indicators that measure the upswing and downswing of a market. In a volatile market like crypto pairs, volatility-based indicators measure how high and how low the market swings occurred. This helps traders buy at a meager price and sell at a very high price.
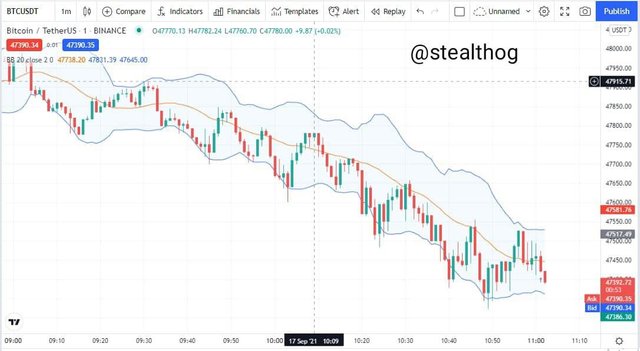
An example of a volatile-based indicator is the Bollinger Bands indicator, which helps traders identify low swing points to buy and high swing points to sell.
Momentum Based Indicator
Price movement or action is heavily dependent on the principles of supply and demand. When there is high demand or high buying pressure, the market moves in an uptrend. Also, when there is high supply or high selling pressure, the market moves in a downtrend. In such cases, the market might get overbought, meaning the market has been overvalued or oversold, suggesting the market has been undervalued.
The Momentum Based Indicator is an indicator that shows if the distance price has moved in the market and indicates if the market has been overbought or oversold. This allows traders to identify good trade points in the market. For example, it is advisable to buy in an oversold market, and in an overbought market, it is advisable to sell.
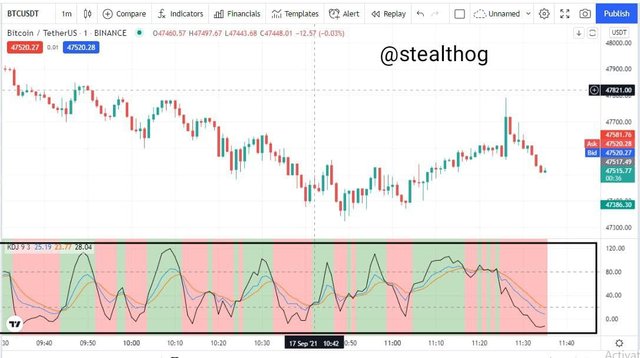
An example is the KDJ Indicator that shows overbought and oversold levels and the convergence of the KDJ line indicating trade signals.
.png)
2b: Briefly explain the reason why indicators are not advisable to be used as a standalone tool for technical analysis.
.png)
Technical indicators are not advisable to be used as a standalone technical analysis tool because the signals given by technical indicators are heuristic meaning it does not provide perfect signals.
Also, technical indicators have strengths and weaknesses, and these weaknesses can be curbed with the addition of other technical analysis tools to confirm trade signals. Furthermore, technical indicators use historical data to predict future price action, and this can sometimes be misleading as other factors can affect the market and change how prices may react.
It is advisable and essential for traders to use more than 1 technical analysis tool when trading as this helps reduce false signals and confirm trade signals. Good market observation also goes a long way in ensuring accurate trade signals.
.png)
2c: Explain how an investor can increase the success rate of a technical indicator signal.
.png)
Understanding the purpose of each technical indicator and being able to interpret its signal goes a long way to ensure the success rate of that indicator. Configuring the indicator with its recommended settings and parameters increases the accuracy of the signals given by the indicator.
Technical indicators are divided into 3 categories, and each of these categories tends to a particular purpose. The combination of indicators from different categories helps solidify the accuracy and increases the success rate of the signals given by the indicators.
Overall the indicator's success rate is only as good as the trader using it. This is to say the trader has to be able to do intensive research on the market to be sure of the technical indicator(s) to use and also use other technical analysis tools to have a confluence of confirmation on a trade signal.
.png)
Conclusion
.png)
In trading cryptocurrencies or other financial markets, technical analysis is essential as it gives the trader the ability to predict price action.
Technical indicators are technical analysis tools used by traders when analyzing to predict future price actions has it uses patterns derived from mathematical calculations of historical data.
Technical indicators are of different categories and are best used with other technical indicators or technical analysis tools to predict price actions better.
.png)
Hello @stealthog , I’m glad you participated in the 2nd week Season 4 of the Beginner’s class at the Steemit Crypto Academy. Your grades in this task are as follows:
Observations:
That's true. This helps to know when demand is higher than supply and vice versa. A trader needs to information to predict price reversals.
That's correct.
Recommendation / Feedback:
I'm impressed with your submission. You have proven your understanding of the lesson in this post. Thank you for participating in this homework task.
Downvoting a post can decrease pending rewards and make it less visible. Common reasons:
Submit