Hello everybody.
Welcome to this post. Hopefully, all of you will be good and happy and enjoying your good health with the grace and blessings of Almighty Allah. Today, I am here to present the homework post for dear professor @fredquantum in Week 2 of Season 6 of the Steemit Crypto Academy. So, let's start the task without any wastage of time.

There are some questions that are asked by the professor as the homework for this week and I will explain all of them in the given order.

(01)
What is your understanding of Triple Exponential Moving Average (TEMA)?
The triple exponential moving average was designed to smooth price fluctuation and filter out volatility thereby making it easier to identify without the lag associated with moving averages. Many traders find it to be a useful tool in identifying strong buy, long-lasting trends. But maybe of limited use in a range bounded market, with short-term fluctuations.
The triple exponential moving average is quite similar to the double exponential moving average but the name suggest DEMA uses two exponential indicators but TEMA uses three exponential moving average indicators. When we are using Triple exponential moving average there is less lag as compared to DEMA.
If we plot 200 EMA and a triple exponential moving average then we can easily guess that TEMA is faster but faster EMA does not always mean better. Triple exponential moving average reduces the lag of traditional Moving Average making it better and more responsive and better suitable for short-term trading. Shortly after developing the DEMA in 1994 Patrick Mulloy took the concept step further and create TEMA.
As triple exponential moving average gives more information about the recent trends in the market, so by applying TEMA we can easily determine the support and resistance level in the chart and also uptrend and downtrend in the market. Triple exponential moving average hold good in the trending market but not good in sideways/choppy market. Because it can produce many false signals. We can buy when candlestick closes above the line and sell pr go short when candlestick closes below the line.

(02)
How is TEMA calculated? Add TEMA to the crypto chart and explain its settings. (Screenshots required).
As we know that Triple exponential moving average use three moving averages so the formula for calculating TEMA is given below:
- TEMA= 3* EMA - 3* EMA(EMA) + 3* (EMA)(EMA)
In the above formula
3* EMA is equal to the exponential moving average, 3* EMA(EMA) is the exponential moving average of 3EMA and 3(EMA)(EMA) is the exponential moving averages of 3* EMA(EMA)
In order to set up the triple exponential moving average indicator on the chart, we have to follow the instructions given below:
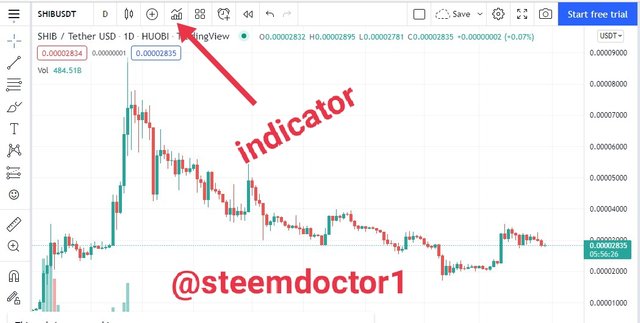
- 1st of all we have to choose the cryptocurrency on which we want to implement the TEMA indicator here I chose the SHIB/USDT pair. After that click on the indicator icon as I show with an arrow in the screenshot.
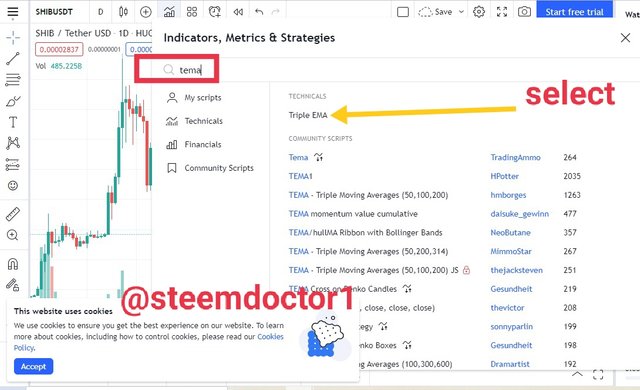
- After clicking on the indicator a page shown that gives the option of search l, here we have to search the TEMA indicator and select the triple EMA
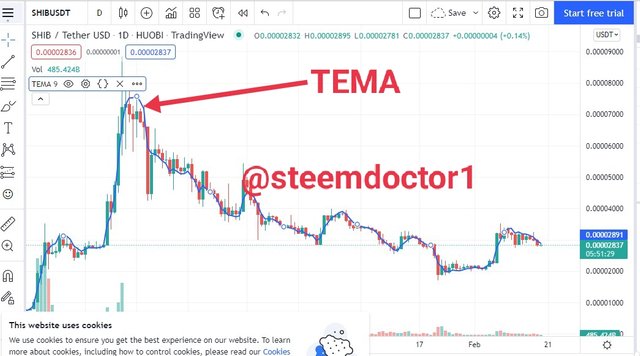
- After clicking on the triple EMA we see that TEMA is applied on the chart.
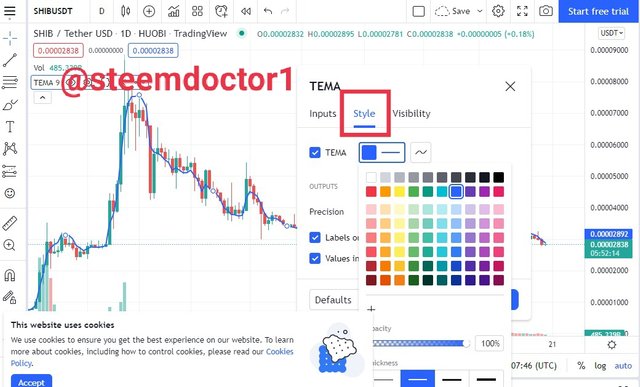
- After applying the TEMA indicator on the chart we can change its settings by just double-clicking on the indicator line anywhere on the chart. After that, we see this type of window as shown below. In input we can change the average days of indicator here default is of 9 days but I changed it to 20 days.
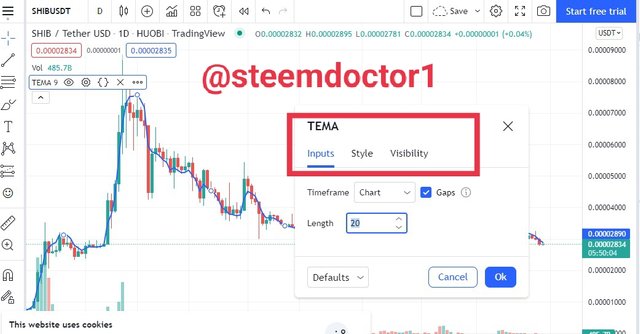
- Here we can change the style of the indicator we can change its color and the width of the line of the indicator.
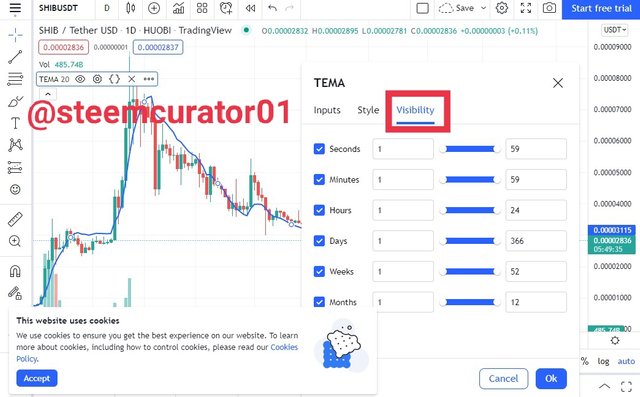
- In the last, we can change the visibility of the different indicators whether we need single TEMA or multiple TEMA indicators on the chart.

(03)
Compare TEMA with other Moving Averages. You can use one or two Moving Averages for in-depth comparison with TEMA.
TEMA and SMA
These all are moving average indicator that indicates the price movement trend in the market. Comparing TEMA with SMA we can see that SMA is the simple arthritic mean of the average price of the market in defined days. SMA gives equal weight to all observations while in the case of TEMA there are three exponential moving averages are used to indicate the recent price changes. TEMA mostly focuses on the recent price changes in the market. The lag feature which takes place in simple moving averages does not happen in the Triple exponential moving averages indicator.
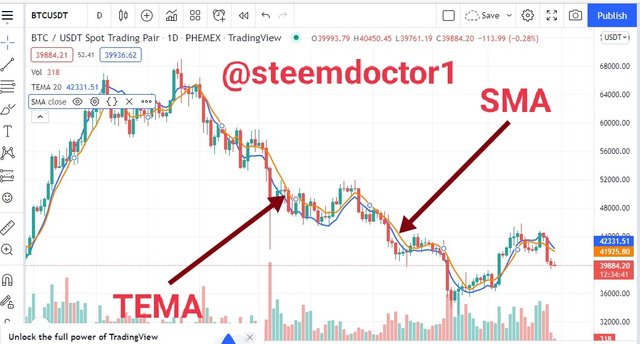
SMA indicator is not useful for short period trading because of lagging of price while in TEMA there is not lagging of price takes place so we can use TEMA for even short term trading. Due to more changes in the price movement, there is Whipsaw can occur in TEMA but whipsawed can not occur in a simple moving average indicator. Whipsawed is the abrupt fluctuations is the price when the market is moving in one direction and suddenly start moving in opposite directions.
TEMA with EMA
Triple exponential moving average and exponential moving average both the indicator was designed to overcome the lag that was occurring in the simple moving average indicator. So the reduction in lag is more in TEMA than EMA. In EMA only one exponential moving average indicator is used while in TEMA there are three moving average indicators are used.
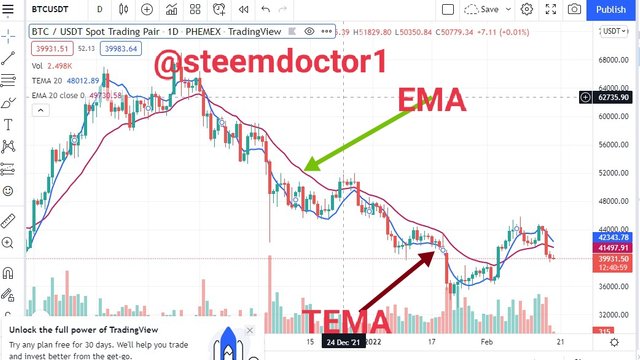
The formula for the calculation for both indicators is different which means that these will give different results for the calculation. By using the triple exponential moving average we can understand about ranging market but by using EMA we can not determine the ranging market.

(04)
Explain the Trend Identification/Confirmation in both bearish and bullish trends with TEMA (Use separate charts). Explain Support & Resistance with TEMA (On separate charts). (Screenshots required).
As we have already known Exponential Moving Average indicators are the market trending indicator. We can predict the trend by using these indicators. Here we can also predict the bullish and bearish trend with the help of the Triple exponential moving average indicator.
Bullish trend:
The angle of the triple exponential moving average indicator can be used to indicate the short-term price direction. As the formula of TEMA is somewhat complex and actually subtracts out some of the lag.
When the price is moving above the TEMA it helps to confirm the price uptrend. When we see that TEMA is going above we should wait for two to three candles as the price moves slightly above the TEMA then we should go for buy condition because there is an uptrend that will come next. The reason for waiting for two to three candles is that when the price moves slightly above the TEMA then TEMA acts as a support line.
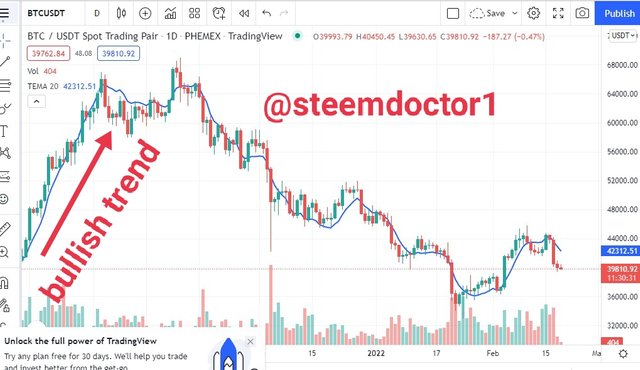
Here in the above screenshot, we can see that when the TEMA moved above then we saw that bullish trend and price action line is slightly above the TEMA so it is a bullish signal
Bearish Trend:
A bearish Trend means that prices will go down in the next trend in the market. We can predict the bearish trend by using the TEMA indicator. When the price is below the TEMA it helps to confirm the downtrend. Here we should go for sell short in the trading and one thing kept in mind that wait for at least two to three candles to go for sell short in the trading market.
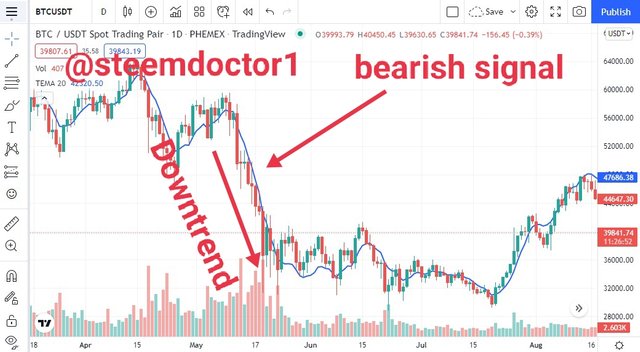
Here in the above screenshot, we see that we price moves down the TEMA indicator than the bearish trend start and the price is moves downward.
Support and Resistance with TEMA
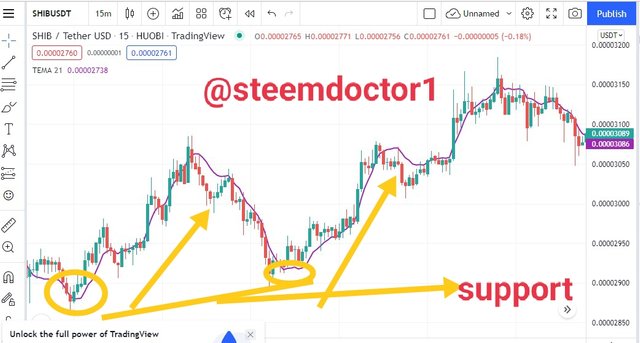
The triple exponential moving average is different from other EMA indicators in terms of support and resistance. In other EMAs when the market is moving downward those indicators act as dynamic resistance but in the case of TEMA situation is different. When the market is going downward then TEMA will act as a support. When the market is moving downward and hits the TEMA line then it will reject the further downtrend and act s support. This will be. Bullish signal and we have to go for buy long here.
In case of resistance when the price movement is in an uptrend TEMA will act as a resistance to price movement, unlike other indicators that act as support in this case.
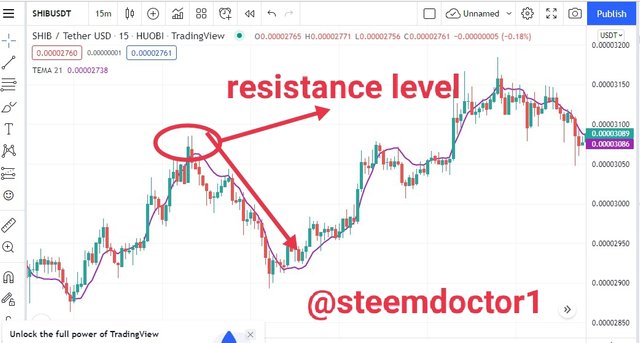
In the above chart, we can see that when the price movement line reaches the dynamic resistance line of TEMA resistance rejected it and it starts a reversal trend.

(05)
Explain the combination of two TEMAs at different periods and several signals that can be extracted from it. Note: Use another period combination other than the one used in the lecture, explain your choice of the period. (Screenshots required).
Cross over is the phenomenon by which we can understand the uptrend and downtrend in the market. For crossing over we use indicators with two different periods. One will act as shorter which is of fewer days average and the other will act as long which is of more days average.
Here in order to explore the combination of two indicators I have chosen indicators with different days average. One is of 25 days which is faster and the other is 50 days on average which will be slower. When shorter TEMA crosses the longer TEMA and moves upward then this will the uptrend signal and the market will go up.
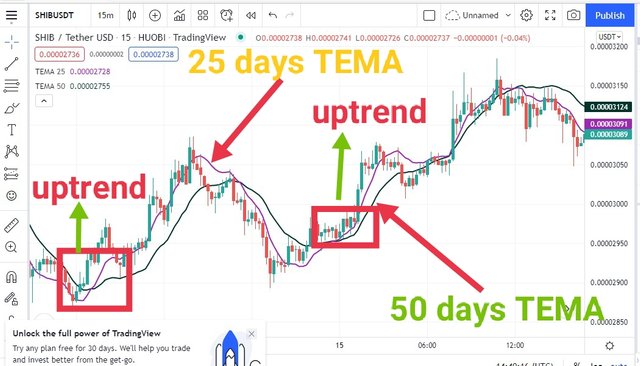
Here in the above screenshot, we can see that we 25 days TEMA cross the 50 days TEMA and then moves upward then the market is making bullish trend and price will go up here we will go for the buy decision.
In other cases when longer TEMA cross the shorter TEMA and moves upward then this will be the bearish trend and the market will go down
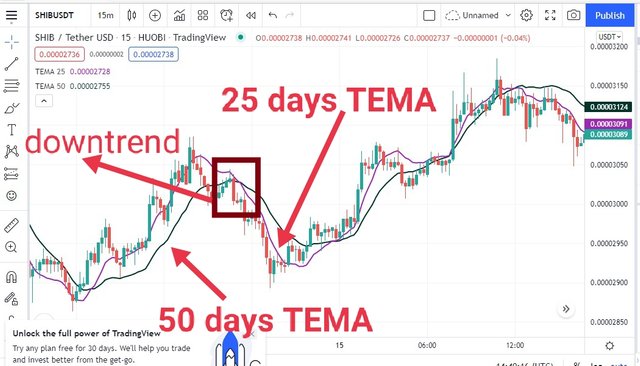
Here we can see that when the longer TEMA line crosses the shorter TEMA and moves up direction then the market is going down and it is the bearish signal.

(06)
What are the Trade Entry and Exit criteria using TEMA? Explain with Charts. (Screenshots required).
In order to enter the market or to exit from the market, we should follow proper instructions and should have proper knowledge about the market trends. If we enter the market without any knowledge then we may face a huge loss.
Entry in market
In order to enter the market, we should follow the following points. For entering the market I prefer a cross-over strategy by using indicators with different days average. So for this, We need to follow these outlines
First of all select two TEMA indicators with different days average to understand the cross-over. From these two indicators, one is of short days average and the other is long days average.
Then in order to enter the market wait until TEMA with shorter days averages cross over the long days TEMA indicator. The short TEMA indicator is faster while the long indicator is slower.
One thing kept in mind is don't go quickly as you see shorter days TEMA cross the longer days average TEMA indicator wait for at least two candles and then enter the market.
Always keep in mind previous support and resistance while entering the market.
Stop-loss will be at lower longer days TEMA indicator.
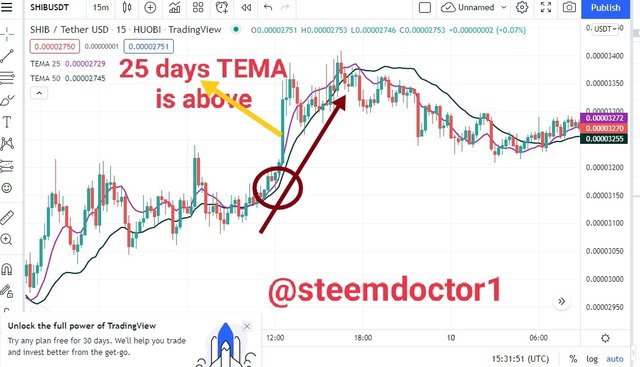
Here in the above screenshot, we can see that SHIB/USDT pair is selected and when the shorter TEMA crosses the longer TEMA and moves upward then is a clear uptrend in the market.
Exit from market
In order to exit from the market by using a cross-over strategy, we need to follow these instructions.
Select two indicators with different days' average value. One is of short days supposed 15 days while other of long days average supposed 30 days average.
Then in order to exit from the market or go for sell short than wait until longer TEMA crosses the shorter TEMA. After that market will go down and we should exit from the market.
But here we also wait for 2 candles because sometimes the price goes up or down for a shorter period of time and then moves again in the same direction such as in ascending and descending triangles.
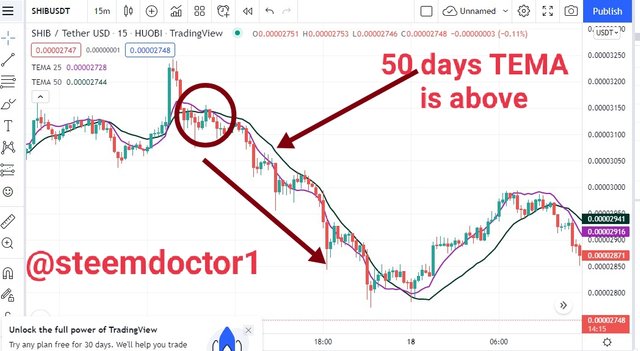
Here in the above picture, we can see that we longer TEMA cross the shorter and remain up from 25 days TEMA then there is a clear downtrend in the market and the market is moving downward.

(07)
Use an indicator of choice in addition with crossovers between two TEMAs to place at least one demo trade and a real margin trade on an exchange (as little as $1 would do). Ideally, buy and sell positions (Apply proper trade management). Use only a 5 - 15 mins time frame. (Screenshots required).
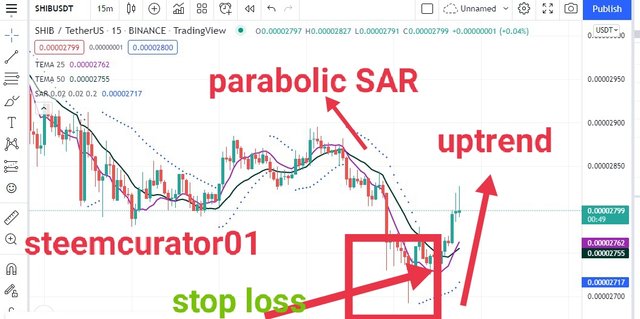
For 15 minutes chart Demo trade, I choose SHIB/USD pair. I will use a cross-over strategy here along with other indicators.
As I open the trading view I saw that 25 days TEMA which is shorter TEMA crosses over the longer TEMA.
At this point, I did not go for trade because I want to confirm with another indicator.
so after that I apply the parabolic SAR indicator.
In parabolic SAR dots were below the price movement trend which means that it is an uptrend in the market.
I put my stop loss at longer TEMA which is below the 50 TEMA indicator.
Real trade sell short
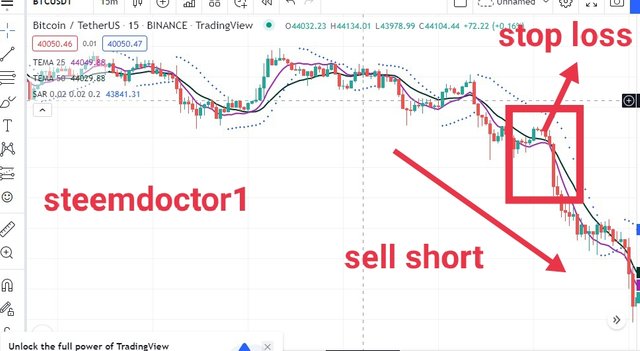
For trade, I choose Binance exchange for margin trading and sell short BTC/USDT as you can see in the screenshot given below
1st of all I saw the TEMA indicator in which the larger TEMA indicator crosses the shorter TEMA so it is the indication to go for sell short so I go for sell short in this case.
Then I further confirm with parabolic SAR in which dots are above the price movement trend so it means that the market will go down further
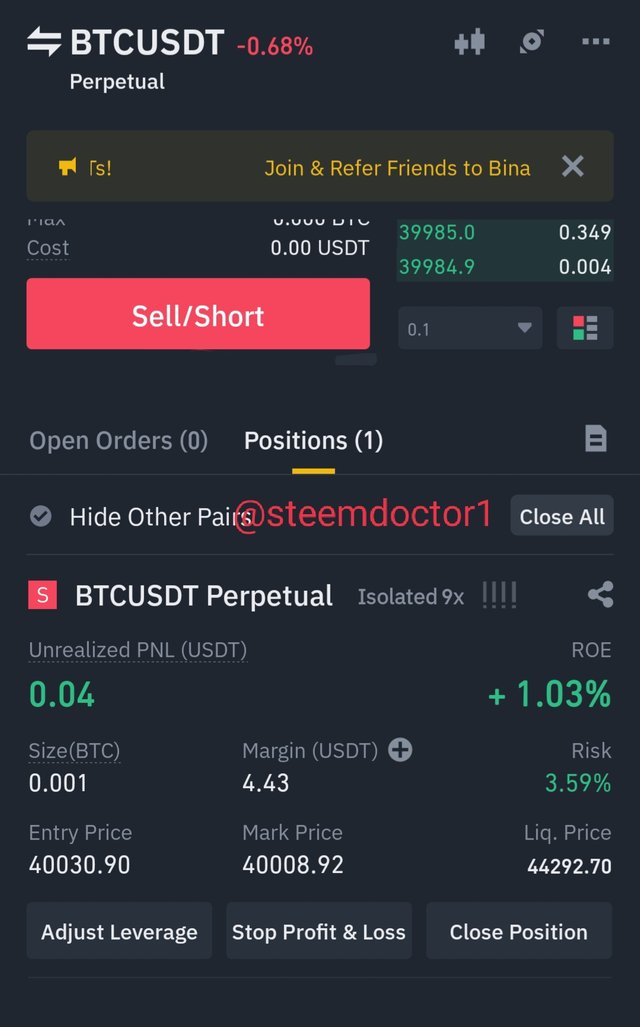
Here is the screenshot of Binance exchange apps where I did my trade and got profit which shows that My prediction that was done with TEMA indicator and Parabolic SAR went well.
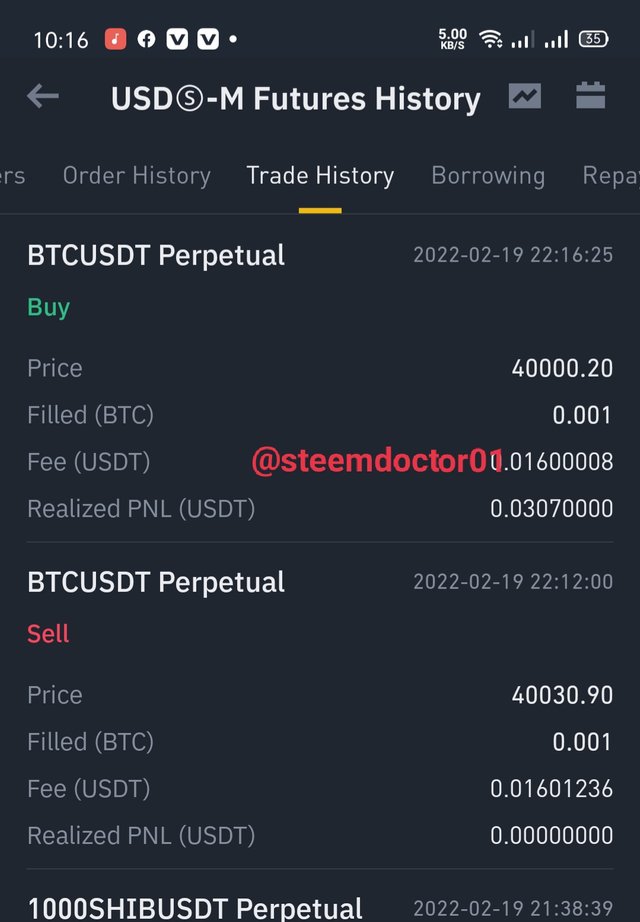

(08)
What are the advantages and disadvantages of TEMA?
Advantage of TEMA
The triple exponential moving average indicator has a certain advantage over other indicators because of its Advance form from other moving averages. These advantages include:
TEMA indicator gives more importance to recent price changes and responds very quickly to price changes.
There is no lagging that takes place in the TEMA indicator. So this may reduce the delay in the signals.
TEMA is the trending directional indicator so it can be used to determine the future trend in the market.
We can find dynamic support and resistance by using the TEMA indicator.
By using a cross-over strategy in the TEMA indicator we can predict the market trends and also our entry and exit points.
TEMA can be used for long and short-term trading because there is no lag in the TEMA indicator.
Disadvantage of TEMA
There is certain Disadvantage of TEMA that includes:
As with other moving average indicators TEMA also only work in the trending market but does not work in sideways or choppy market.
some people don't use the TEMA indicator because it creates a lot of signals and also includes false signal.
TEMA alone can not be used for understanding market trends because it may prove very risky and cause loss.

Conclusion
The triple exponential moving average indicator was designed for smooth price changes and to filter out volatility. This may similar to DEMA but here we use three moving average indicators. TEMA is faster than other moving average indicators. TEMA also reduce the lag feature present in other indicator and so it can be used for short-term trading. Triple exponential moving average works best in the trending directional market. When the price is above the TEMA it helps to confirm the price uptrend and when the price is below TEMA it helps to confirm a price downward trend.
By using the TEMA indicator we can predict the bullish and bearish trend as well as support and resistance level in the market. Comparing TEMA with other moving averages indicators can also give important information about TEMA as it works best to detect even minor changes in the market. A cross-over strategy can help us to indicate the market trends including bullish trends and bearish trends. We can also predict the entry and exit from the market by using a cross-over strategy.

So, that's all about the homework post for this week. Hopefully, all of you will like it. Thanks to dear professor @fredquantum for such an amazing lecture.
Note: All the screenshots/images are taken from TradingView
Writer: @steemdoctor1 (Crypto Student)


Downvoting a post can decrease pending rewards and make it less visible. Common reasons:
Submit