Hello everybody.
Welcome to this post. Hopefully, all of you will be good and happy and enjoying good health with the grace and blessings of Almighty Allah. As we know that there is a new initiative in the Crypto Academy Season 6 that is Crypto Trading Competitions. Thanks to the Steemit Team for providing us with such an amazing opportunity to utilize the knowledge that we gained from the academy so far in the real trades.
This is my 2nd trade this week. So, let's start the task without any wastage of time.

| The coin that I selected for trading is SHIB/USDT pair and the exchange for this trading is Binance exchange I will do spot trading on binnance |
|---|

Coin and Exchange Name
Fundamental analysis of Binance Exchange:
I have chosen Binance for this purpose because I am fully aware of Binance features and working in Binance since 2020, and this exchange also has certain benefits over other exchanges. Binance is the world-famous cryptocurrency exchange that was founded in 2017 based in Malta and it is now spreading all over the world. Binance never accepts every cryptocurrency it only accepts those currencies which actually exist in reality.
There is no dummy coin in the Binance and this is also safe and secure for trading purposes. On Binance we can do three kinds of trade including spot trading, futures trading, and margin trading. The most important benefit of Binance is that it gives more than 125x leverage on most trading pairs. In order to buy or sell cryptocurrency on Binance, we use the P2P option where we can buy or sell the cryptocurrency.
Changpeng Zhao is the main man behind building Binance as the world's largest cryptocurrency exchange. Since its launch Binance until now boasts over 450 trading pairs with 155 coins and 100 wallets and the trading volume is about 1 billion dollars with the growing trends in initial exchange offering the IOS system and Binance also launch their own token sale platform.
Fundamental analysis of Shiba Inu coin
- Background History:
Shiba Inu was created by an Indian onymous person known as Ryoshi in August 2020. It was intended as an altcoin of dogecoin and this meme coin was named after the Japanese dog breed Shiba Inu. It feels like the Shiba Inu coin was built into existence and is now insanely popular among major crypto exchanges through the power of its following crowds' meme persistent and a cute dog.

Shiba Inu coin is a decentralized community-building cryptocurrency developed with the Shiba Inu ecosystem and built on top of Ethereum Blockchain. It is a meme coin that was launched as a rival of dogecoin or we can say, doge killer. It has already taken over some dogecoin markets. This coin is increased almost 48000000% since its launch. One US website named US gold is accepting Shiba Inu for payment. We can buy gold with the Shiba Inu coin. If we talked about the algorithm then Shiba Inu is based on proof of work consensus.
- Coin market capitalization of Shiba Inu coin:
In order to see the information about the market capitalization of the Shiba Inu coin, I searched CoinMarketCap and I have found all the information that I will mention below about the Shiba Inu coin.
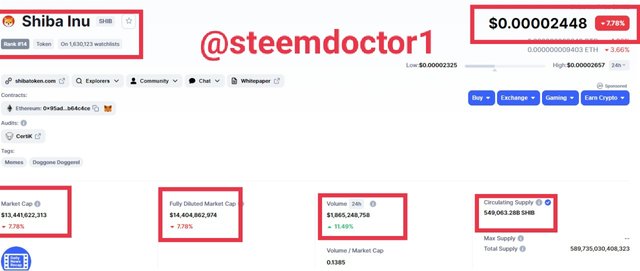
| Name | Shiba Inu |
|---|---|
| Market cap | $13,441622313 |
| Fully diluted market cap | $14404862 |
| Volume | $1865248758 |
| Circulating supply | 549063288 shib |
| Rank | 14 |
| Price | $0.00002448 |
| Volume/Market cap | 0.139 |
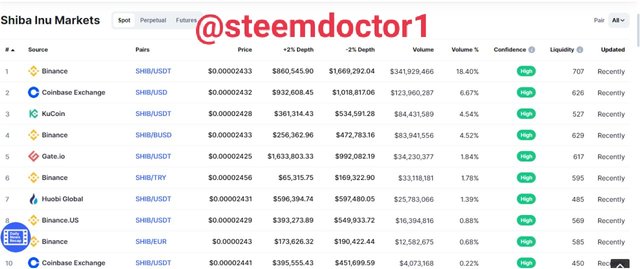
- Shiba Inu Markets:
Shiba Inu is a highly famous coin and is present in many exchanges. Those include Binance, kucoin,Gate.io, Huobi global, etc
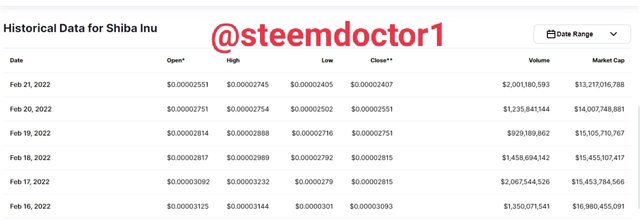
- Historical prices of last 7 days of Shiba Inu coin:
The price of Shiba Inu keeps on fluctuating. So the last 7 days price is given below

Why are you optimistic on this token today, and how long do you think it can rise?
I am optimistic about Shiba Inu coin for some reasons such as Shiba Inu coin is at rank number 14 in cryptocurrency which is a good number and also its market Capitalization and volume keep on increasing day by day. For example, in previous 24 hours, its volume is increased up to 10%.
Another reason is that Elon mask is taking so much interest in meme coins and Shiba Inu is one of them. We can see that he tweeted recently that he would like to own a Shiba pub that hyped the crypto market and its price increase by 300 percent. Due to its popularity, it can have a significant influence over large investors in the crypto market. According to investing cube.com Shiba Inu will rise again and its price will reach almost 0.00061 in 2024-25 which is an almost 600% increase from the recent price.

How to analyze the token? (using the analysis knowledge learned from professors’ courses)
Technical analysis is the study of past market actions or we can say price and volume to forecast future price movement. Technical analysis is used to evaluate investment and to find trading opportunities.
We can say that technical analysis is just like weather forecasting it doesn't give 100% absolute true prediction about the future but it helps you to forecast what is likely to happen to prices over time. So technical analysis is a must for entering the crypto market and to gain profit otherwise without technical analysis you are just at the risk of losing your money within no time. Here in order to do a technical analysis of the Shiba Inu coin and in order to buy a trade, I will use some indicators and also cross over the strategy that I have learned in previous lectures.
Parabolic SAR:
Parabolic SAR is an interesting indicator that is very popular among traders. This was made by j wells wilder jr. And it is used to find the direction of the trend. Parabolic SAR can also be used as an entry signal generator and stop-loss indicator and also used as an exit signal generator. This is one of those rare indicators like Ichimoku clouds that tries to show different kinds of information on its own. Parabolic SAR is so much easy to use and also easy to understand. The parabolic SAR indicator also shows a bullish trend and a bearish trend.
Once you added parabolic SAR to your chart we can see that parabolic SAR is represented by dots above and below the price movement line. After applying the Parabolic SAR indicator we can change its settings by double-clicking on the chart and changing its settings.
When Parabolic SAR dots are below the candles the market is considered to be in an uptrend so in this case, we can enter the market as a buy long.
When Parabolic SAR dots are above the candle pattern the market is considered to be in a downtrend and we can enter a short position.
We should wait for 3 to 4 dots above or below the candles in order to enter or to exit from the market.
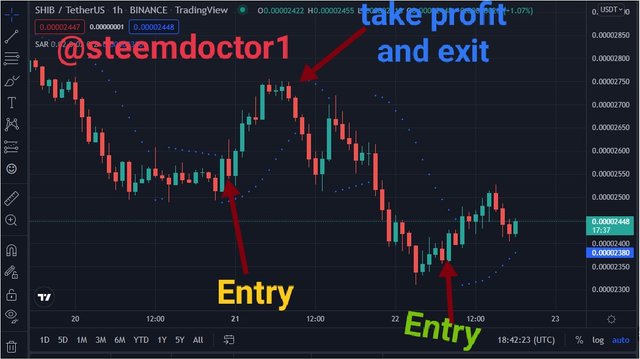
Sometimes parabolic SAR may also give a false signals so to avoid these false signals we should use 200EMA along with Parabolic SAR. So in this case, if the price is above 200 EMA then we should go for buy when the dots flip below the candles we will enter the long position. We will set the stop loss below the dots and we should remember to wait for the candle to be completed since parabolic SAR is a lagging indicator and if the price is below 200 EMA we should go for the sell position.
Relative Strength Index indicator:
RSI stands for relative strength index and it is an indicator that you apply to your charts that are often used to identify overbought and oversold markets.
In RSI there are two lines that indicate the market condition at that time.
One line is of 70 on RSI, everything above that 70 RSI value will be considered as an overbought region. When the RSI line touches 70 it means that the price of the assets is very expensive. Here traders exit the market by selling their assets.
One line is of 30 on RSI everything that is at or below 30 on the RSI will be considered as an oversold region. When line touches the 30 value of RSI it means that assets are very cheap now. Here the trader enters the market in order to buy a long position.
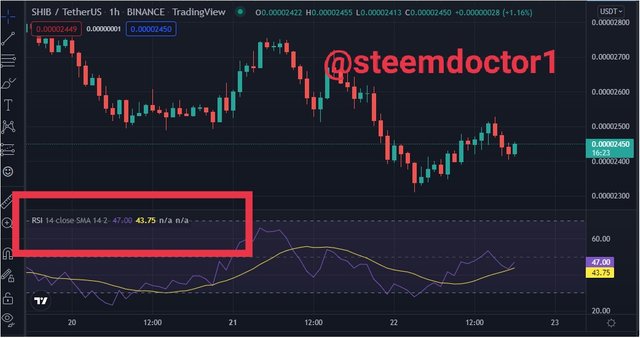
Sometimes RSI may give a wrong indication than we should go for the divergence concept. Divergence is when the price is going up and RSI is going down people consider it as an uptrend but it is actually a bearish trend and sometimes the price goes down but RSI is going up then this will be the bullish signal.
*Triple exponential moving average indicator:
This indicator is also very useful for recent price changes as compared to other moving averages. Other moving averages give equal weight to all observations but triple exponential moving average gives more weight to recent price changes so this is also useful for short-term trading.
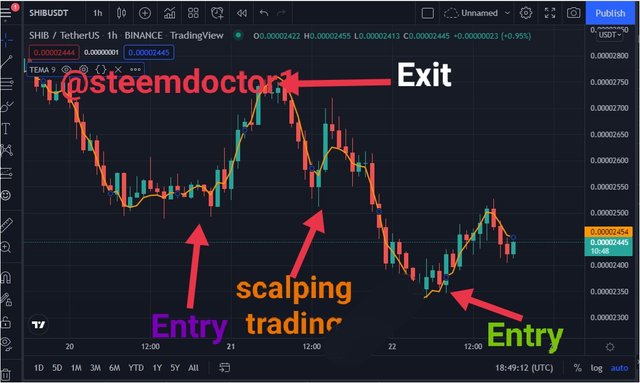
The triple exponential moving average uses three exponential indicators and is represented by a single line along with a price movement candle. When the price movement line is a little above the triple exponential moving average indicator line than this will be bullish signal and it's time to enter the market as buying long. When the price movement candle is below the line of the triple exponential moving average indicator then this will indicate the exit from the market and go for sell short in futures trading.
Real trade of SHIB/USDT pair
So now according to the requirements of this week's lectures, I am going to make my real spot trade on Binance exchange and I choose SHIB/USD pair. As You can see I give you details of the three indicators above so I also apply these indicators on the price chart of SHIB/USDT pair.
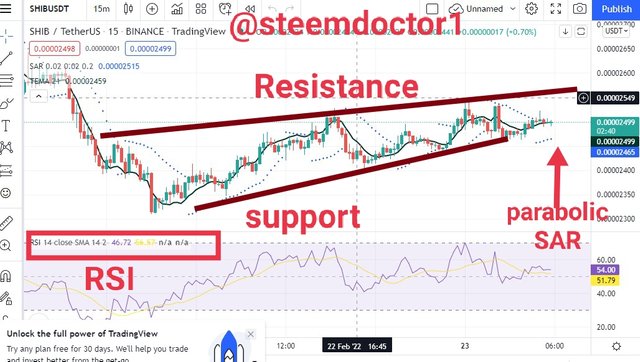
After seeing the chart I applied the following instructions on the chart:
First of all, I applied the support and resistance line on the candlestick chart of Shib/USDT pair in order to have a better understanding of the market trends.
Then I applied three indicators to the chart. 1st of all parabolic SAR indicator you can see that in the above screenshot dots of parabolic SAR are below the price movement candle which means that price will go up and there will be a bullish trend in the market.
Next, I applied triple exponential moving average indicator and you can see that price movement lone is slightly above the TEMA indicator line which also indicates to enter the market and buy long because there will be a bullish trend in future.
In the last, I confirm with RSI indicator as its value is at 46.72 which means that market still goes up until it reaches to 70 value
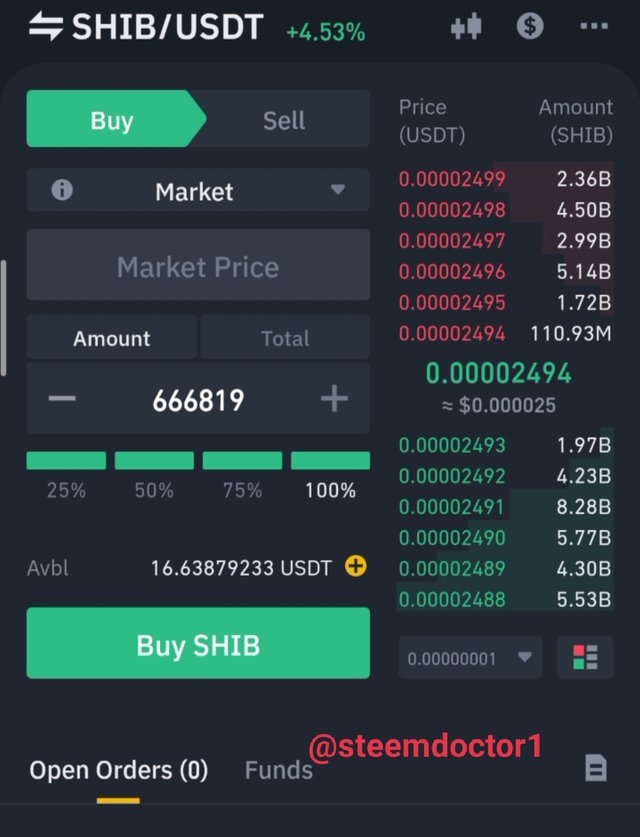
So after seeing all this I go for spot trading of buying long of Shib/USDT pair.
 |  |
|---|
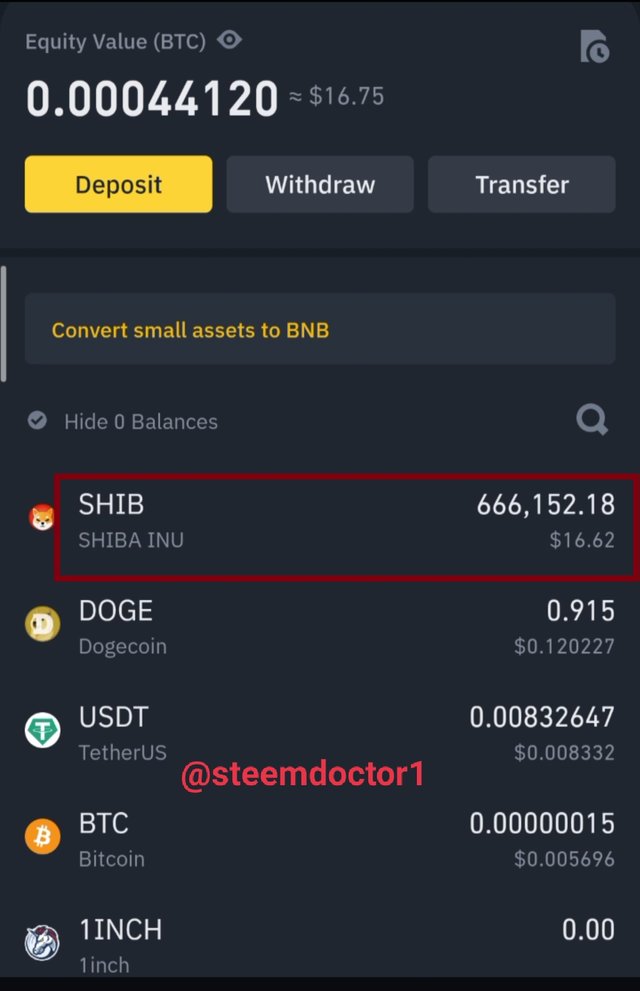
So in the above screenshot, you can see that I have bought SHIB/USDT pair and now it comes in my spot wallet.

Your plan to hold it for a long time or when to sell? Do you recommend everyone to buy? and the reasons for recommending/not recommending
Nowadays market is a bit low and especially altcoin even break their support level so here we have to decide whether we should hold our Shiba Inu coin or sell it. As I am not so much an expert in the market trends and future predictions but from the fact and figures I have seen that price will go up due to some reasons such as many exchanges going to list Shiba Inu coin such as Bitstamp which was listed in December but due to some reasons it may going to list very soon. The other is Robinhood which works in backend integration in order to get SHIB on board.
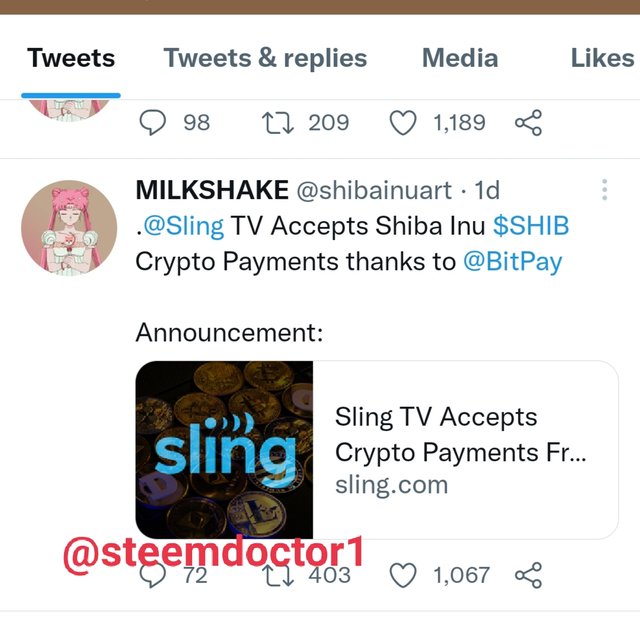
Many businesses are going to accept the Shiba Inu as payment such as @slingtv is going to accept Shiba Inu as payment so now we can buy tv by paying Shiba Inu coin. Shiba Inu also establish its own burning pool so after burning and increasing in market capitalization its price will increase in the future. In the future Amazon may also accept Shiba Inu for payment. There is also a great story of metaverse to be started for Shiba Inu which would be a great intuitive for an uptrend in the Shiba Inu coin. so according to the above prediction if one has the capacity to hold the Shiba Inu he/ she holds the Shiba Inu. As far as I am concerned I am not financially strong so I mostly do daily trading or scalping trading for a small profit. So when the trend reverse I will sell the Shiba Inu coin.

Anything other users want to share about the token/project.
As we know that nowadays social media is so much powerful source of information so we can get information about Shiba Inu from the Twitter account of Shiba Inu coin.

The white paper is an experiment for community building in a decentralized and spontaneous systems. This can be read from the below link given as:

Conclusion
So this was the overall trading lecture from this week. Here I do a spot trading on Shiba Inu/USDT pair and I do spot trading in Binance. First, we have learned about the introduction of Binance Exchange and also about fundamental analysis of Shiba Inu coin. Technical analysis is the most important factor in trading so proper understand about technical analysis is very necessary in order to have more and more control over the market. I had made a entry in the market by analyzing all the indicator that was discussed above and than due to some ground realities we should hold shib for some time in order to gain profit.
Thanks to dear professors @kouba01 and @fredquantum for such an amazing opportunity by leading an amazing team.
Writer: @steemdoctor1 (Crypto Student)

Downvoting a post can decrease pending rewards and make it less visible. Common reasons:
Submit