Assalamualaikum everyone!
Welcome to the post. Hopefully, all of you will be ding well and enjoying the time with the grace and blessings of Almighty Allah. Today, I'm here to be a part of the week 4 contest in our beloved SteemitCryptoAcademy community. The topic of discussion for this week is Death Cross Vs Golden Cross. So, let's start the fun without any wastage of time.
Explain in your own words, what is the golden crossing and what is the crossing of death?
The death cross and the golden cross are very common but useful terms in the cryptocurrency trading. The golden crossing and the crossing of death serve as trail markers for cryptocurrency traders, signifying the possible trend changes in market direction. Let us discuss these two terms in more details.
- Gold Cross:
This pattern indicates a future bull market (an upward trend). It happens when a shorter-term moving average (MA) indicating recent price movements crosses above a longer-term MA reflecting the overall trend. Consider it the shorter-term momentum gaining potential and gradually overtaking the established trend.
Imagine two lines on a price chart. The shorter-term MA (e.g., 50-day) functioning as a nimble hiker, reacting rapidly to current price movements. The longer-term MA (e.g., 200-day) functioning just like a guide, indicating the overall direction of the market. When the nimble hiker catches up and overtake the guide, it indicates a possible shift towards an upward climb.
The same is the scenario in the market. When the short-term MA (50-day) crosses the long-term MA (200-day), and after crossing it, moves above the long-term MA, it is said to be as a Golden Cross. A golden cross indicates the increased purchasing pressure and investor confidence, thus shifting the market trend towards the Bullish Trend.
- Death Cross:
This pattern points to a future bear market (downward trend). It's the inverse of a golden cross, in which the shorter-term MA crosses below the longer-term MA. Just consider the nimble hiker losing momentum and falling behind the guide, indicating a possible decline.
Imagine two lines on a price chart. The shorter-term MA (e.g., 50-day) functioning as a nimble hiker, reacting rapidly to current price movements. The longer-term MA (e.g., 200-day) functioning just like a guide, indicating the overall direction of the market.
When the short-term MA (50-day) crosses the long-term MA (200-day), and after crossing it, moves below the long-term MA, it is said to be as a Death Cross. A death cross indicates the increased selling pressure, thus shifting the market trend towards the Bearish Trend.
Use the BTC/USDT pair to show the golden crossover and the crossover of death, in tradingview. Also use the STEEM/USDT pair to show the golden cross and the death cross. Screenshots are required.
- Golden Cross in BTC/USDT Chart:
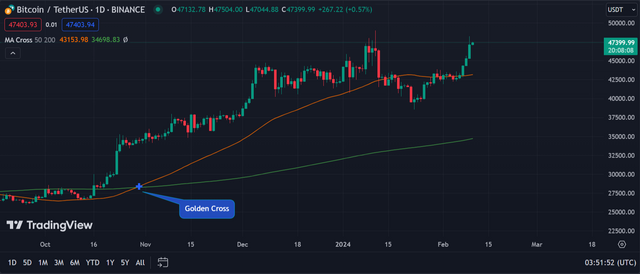
In the above chart, you can see a very clear Golden Cross. You can see that the Orange Line (50 days MA) crossed the Green Line (200 days MA) and started moving above it. At the same time, you can see that the market entered the Bullish trend and thus it is the representation of the Golden Cross.
- Death Cross in BTC/USDT Chart:
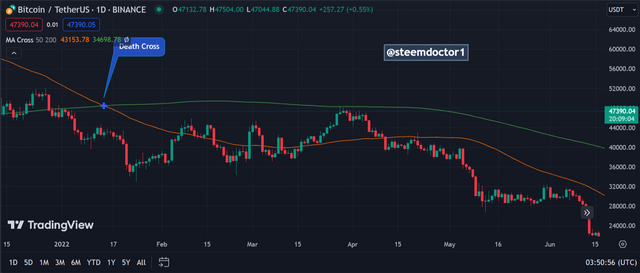
In the above chart, you can see a very clear Death Cross. You can see that the Orange Line (50 days MA) crossed the Green Line (200 days MA) and started moving below it. At the same time, you can see that the market was already in the Bearish trend and this cross supported the trend. Thus, it is the representation of the Death Cross.
- Golden Cross in STEEM/USDT Chart:
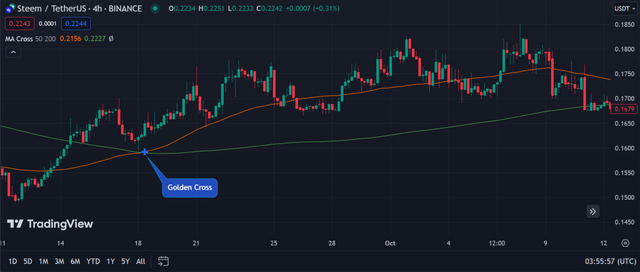
In the above chart, you can see a very clear Golden Cross. You can see that the Orange Line (50 days MA) crossed the Green Line (200 days MA) and started moving above it. At the same time, you can see that the market entered the Bullish trend and thus it is the representation of the Golden Cross.
- Death Cross in STEEM/USDT Chart:
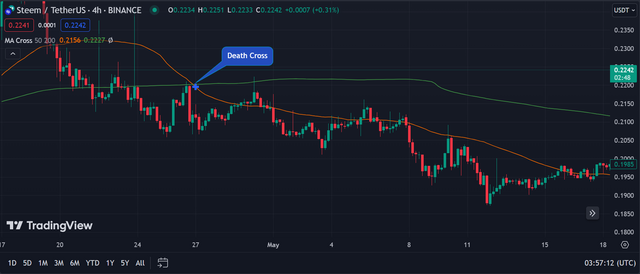
In the above chart, you can see a very clear Death Cross. You can see that the Orange Line (50 days MA) crossed the Green Line (200 days MA) and started moving below it. At the same time, you can see that the market entered the Bearish trend and thus it is the representation of the Death Cross.
What is the difference between the golden crossover and the death crossover?
| Heading | Golden Cross | Death Cross |
|---|---|---|
| Meaning | This indicates a future bull market (upward trend). This happens when a shorter-term moving average (MA) passes over a longer-term MA. This signals rising pace in the short term, which could lead to an upward trend. | Signifies a possible bear market (downward trend). This happens when the short-term MA falls below the long-term MA. This shows that momentum is fading in the short term, potentially leading to a negative trajectory or bearish trend in the market. |
| Visualisation | Consider the shorter-term MA to be a quicker runner who has caught up with and surpassed the slower, longer-term MA. This indicates a potential shift towards an upward trend. | Consider the quicker runner loses speed and falls behind the long-term MA. This indicates a possible downward trend. |
| Technical Details | 50-day MA crossing above the 200-day MA. | 50-day MA crossing below the 200-day MA. |
| Interpretation | Increased buying pressure and investor confidence, potentially leading to price increases. | Increased selling pressure and bearish sentiment, potentially leading to price decreases. |
| Time of Occurrence | A Golden Cross usually occurs at the end of a bearish trend to identify the trend reversal towards the bullish one. It may also occur during a bull trend to support it. | A Death Cross usually occurs at the end of a bullish trend to identify the trend reversal towards the bearish one. It may also occur during a bearish trend to support it. |
In addition to these two chartist patterns, what other indicator would you add to make the technical analysis more effective at the moment of making a decision?
We all know that no technical indicator is perfect and we can not relay entirely on a particular chart pattern or indicator. So, it is very much important to combine two or more technical indicators before making any decision in the market. Some of the important technical indicators that can be used alongside the Golden and Death crosses are listed below.
Volume Indicators:
- On-Balance Volume (OBV)
- Chaikin Money Flow (CMF)
Momentum Indicators:
- Relative Strength Index (RSI)
- Stochastic Oscillator
Trend Confirmation:
- Moving Average Convergence Divergence (MACD)
- Bollinger Bands
So, the above are some important and beneficial indicators which can be used alongside the death and golden crosses. The choice of the indicator which are you going to use is totally dependant on your own trading style and strategy.
I am going to use the OBV and the RSI indicators along with the Death and Golden crosses in order to confirm the signals which are given by the crosses. Remember that, these confirmatory indications are very much important before making any decision in the market.
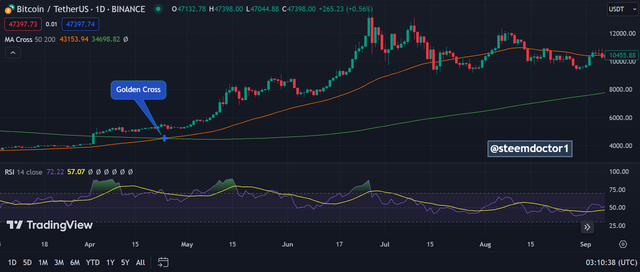
In the above screenshot, you can see that the Golden Cross appeared in the market and you can see that the RSI indicator also indicated a bullish signal with the appearance of the double top pattern in the RSI line. So, this is a bullish signal confirmation by the RSI along with the Golden Cross.
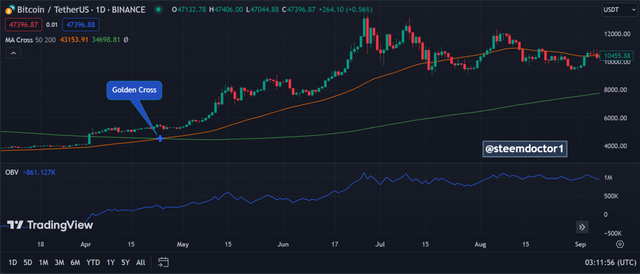
In the above screenshot, you can clearly see a Golden Cross pattern and at the same time, the OBV line was also moving upward with is the confirmation of the Bullish signal by both of these indicators.
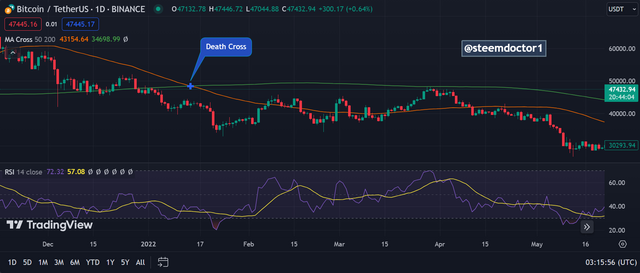
The above screenshot is a clear example of the Death Cross confirmed by the RSI indicator. At the time of the formation of the death cross, the RSI line was also moving in the downward direction which is saying that the bearish trend is coming soon. That is why, the death cross is confirmed by RSI.
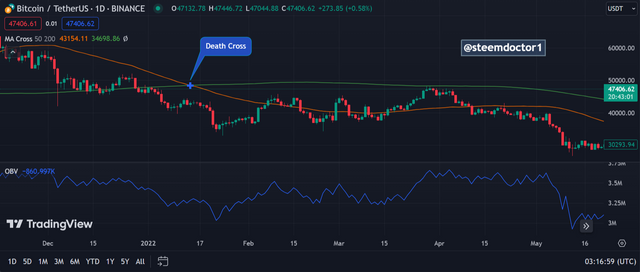
In the above screenshot, you can see that I have mentioned a Death Cross and at the same time I applied the OBV indicator. At the time of the crossover, the OBV line was moving downward which means that the volume was declining and it indicates an upcoming bearish trend. So, the OBV indicator is confirming the death cross.
Death Cross and Golden Cross are very common and beneficial technical analysis tools that are used to determine the upcoming trend of the market and the possible trend reversals. When the short-term MA crosses above the long-term MA then it's the Golden Cross and when the opposite happens, it's the Death Cross. It is very much important to combine other technical analysis tools to verify the signals that are given by these crossover patterns.
 |  |  |  |
|---|

X Share Link:
https://twitter.com/mrsheraz7588/status/1756332045951771039?t=qj3-ABbcPIy5hK8XyIwA4g&s=19
Downvoting a post can decrease pending rewards and make it less visible. Common reasons:
Submit
Upvoted. Thank You for sending some of your rewards to @null. It will make Steem stronger.
Downvoting a post can decrease pending rewards and make it less visible. Common reasons:
Submit
Greetings friend,
As always, you've really blown me away with your entry. I must say, you hit the nail on the head with your understanding of the Golden Cross and the Death Cross. These patterns are absolutely crucial for traders and investors to grasp. They provide valuable insights that can help navigate the complexities of financial markets. By combining these patterns with supplementary technical indicators, traders can optimize their trading strategies and make well-informed decisions as the market progresses. It's all about staying ahead of the game and leveraging these patterns to your advantage. You're doing an incredible job. Keep up the great work and keep impressing us with your knowledge.
Downvoting a post can decrease pending rewards and make it less visible. Common reasons:
Submit
Thank you so much for your beautiful words dear friend
Downvoting a post can decrease pending rewards and make it less visible. Common reasons:
Submit
Dear friend
° you have clearly explained what death cross and golden cross is to my satisfaction. Your usage of the btc chart to explain the two chart patterns was awesome.
° you also outlined the differences between the two chart patterns which was very unique with unique subheadings
° I also appreciate the way you highlighted the indicators to be used together with the GC and DC based on their type - momentum, trend and volume.
Wishing you the best in this engagement.
Downvoting a post can decrease pending rewards and make it less visible. Common reasons:
Submit
Thank you friend ☺️
Downvoting a post can decrease pending rewards and make it less visible. Common reasons:
Submit
Nice to go through your well written content.
The analogy of these crosses being like trail markers provides a vivid understanding of their role in guiding traders through the dynamic landscape of cryptocurrency markets, helping them anticipate and navigate potential shifts in trends.
You have highlighted the fundamental concept behind a golden cross, emphasizing how the orientation of short-term and long-term moving averages reflects increase in buying activity and positive investor sentiment, ultimately influencing a shift towards a bullish market trend. And reverse is observed in death cross.
Good luck
Downvoting a post can decrease pending rewards and make it less visible. Common reasons:
Submit
Thanks for your beautiful comment dear brother
Downvoting a post can decrease pending rewards and make it less visible. Common reasons:
Submit
Está clara la definición de la cruz de oro y la cruz de la muerte.
No conocía este indicador para revelar la tendencia futura a largo plazo.
Como ningún indicador es infalible, está bien el uso de otros indicadores que corroboren el análisis. El uso del RSI y OBV es adecuado.
Has demostrado el dominio del tema con las palabras adecuadas que facilitan el entendimiento de los lectores menos expertos, en un gran aporte en el conocimiento.
Gracias por compartir, saludos y éxitos.
Downvoting a post can decrease pending rewards and make it less visible. Common reasons:
Submit
Thanks a lot for your beautiful words dear friend.
Downvoting a post can decrease pending rewards and make it less visible. Common reasons:
Submit
your post explains Death Cross Vs Golden Cross, important terms in cryptocurrency trading. you talks about how these patterns show changes in market trends using examples from BTC/USDT and STEEM/USDT pairs. you also says it's important to use multiple indicators like volume and RSI for better decisions. Screenshots help understand better. It's helpful for traders learning about crypto trading. Thanks for sharing with us
Downvoting a post can decrease pending rewards and make it less visible. Common reasons:
Submit
Thanks for the good words dear brother
Downvoting a post can decrease pending rewards and make it less visible. Common reasons:
Submit
Your most welcome my Dear friend 💗
Downvoting a post can decrease pending rewards and make it less visible. Common reasons:
Submit