
On-chain Metrics

Q1-What is the difference between Realized Cap & Market Cap, How do you calculate Realized Cap in UTXO accounting structures? Explain with examples?

Market cap:
Also known as the market capitalization is the worth of an asset calculated by taking the product of the total supply of the coins and its current value.
Differences with RC:
- It combines both the spent and unspent UTXO balance and is therefore and overvalue worth of the network.
- It changes with the change in the unit price of the coin
- It is mathematically very easier to calculate
Mathematically it is calculated as:
Total coin supply X unit price of the coin
Example:
Market cap of LTC
Current price: $165.85
Supply of coins:66,752,614.52 LTC
Market cap: $11,070,806,710
Realized cap:
Also known as the realized capitalization represents the worth of a coin based on the unspent coins. It is calculated by taking the product of unspent coins and the price at which they were last transacted.
Differences with MC:
- It is a more genuine picture of the asset’s value.
- It is commonly less than market cap
- It involves only unspent coins UTXO
- It changes when the unspent coin is transacted
- It is less volatile than the market cap
Mathematically it is represented as:
Realized Cap=Number of UTXO X Price created [USD] (of all UTXOs)
Example:
Let’s consider:
6 LTC has not moved since 2015 and the last time it was moved, its price was $27, 7 LTC has not moved since 2018 and the last time it was moved its price was at $8 then
RC= (6x27) + (7x8) = 218$

(2) Consider the on-chain metrics-- Realized Cap, Market Cap, MVRV Ratio, etc., from any reliable source(Sentiment, Glassnode, etc), and create a fundamental analysis model for any UTXO based crypto, e.g. BTC, LTC [create a model for both short-term(up to 3 months) & long-term(more than a year) & compare] and determine the price trend/predict the market (or correlate the data with the price trend)w.r.t. the on-chain metrics? Examples/Analysis/Screenshot?

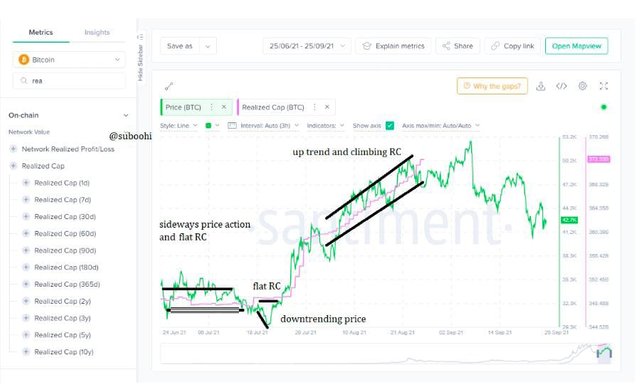
Realized cap short-term chart
In the bullish phase, there is a steep upward movement and in the sideways there is a flat movement of the Realized Cap. In the downtrend we again see a constant movement it is due to the fact that the investors still trust the market and look forward to keep their UTXO balance maintained thus we do not see a downward steep.
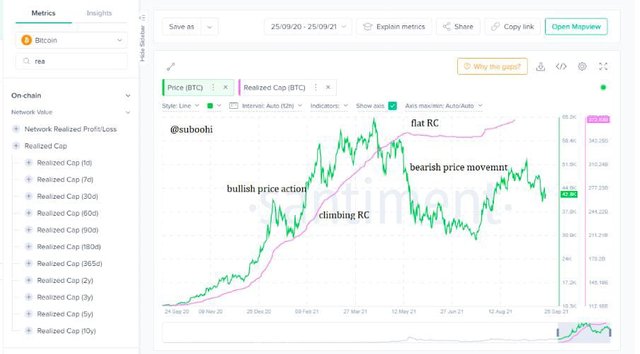
Realized cap long-term chart
The long-term bullish trend too is supported by the parallel upward motion of the RC. After its ALL time high in April the price dropped from $65k to $29k but the RC maintained a sideways or flat movement.
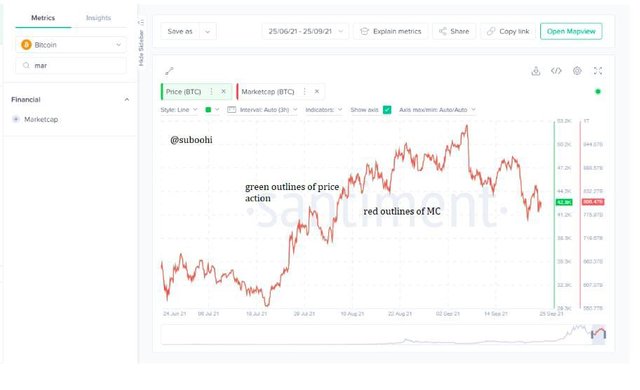
Market Cap short-term chart
In the Market-cap you can hardly locate the price action line. It is because the price action and the market cap move together in the same trend. When the price increases the MC increases and an uptrend of the both the lines is seen the same happens in a downtrend and therefore locating them separately becomes hardly possible.
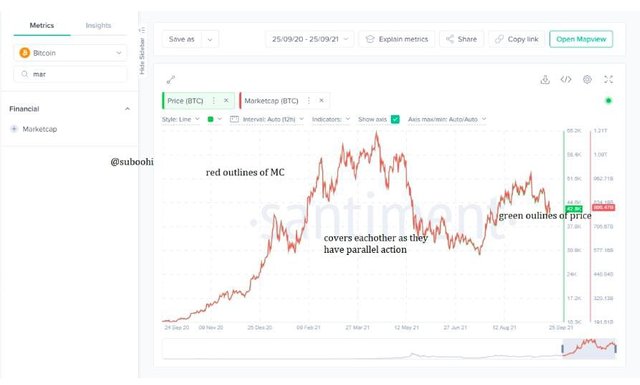
Market Cap long-term chart
The long-term chart of MC is also symmetrical to the price movement. It is too because the MC is calculated with the current price and the total supply of the coins and it might be change as the price of the underlying asset willchange. For example on 7th September BTC peaked to $52.7k and the Market cap was $991 Billion but as it dropped to $44.8k on 13th the MC dropped with the same percentage to $844 Billion.
MVRV Ratio short-term chart
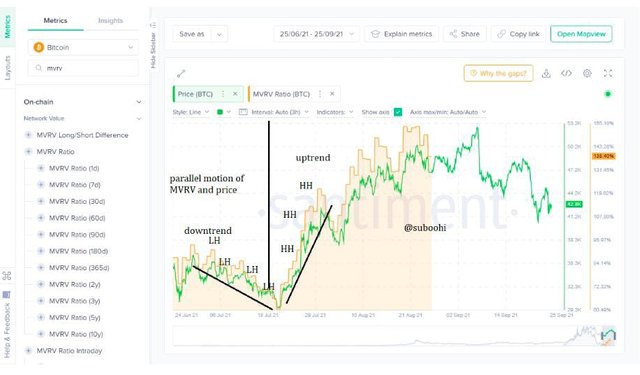
MVRV is calculated as the ratio of Market cap to Realized Cap. Its movement is very symmetric to the movement of the price action. It is a leading strategy that helps in predicting the behavior of the market. It is plotted between 0 to 200 and above. If it is below 100 and consists of LH and LL then the market is in negative state and if it is above 100 the market is in a fairly positive stage as indicated in the chart below.
The price of BTC moved to $30.1k, and the MVRV ratio went up to 61.1%, and the market was in a negative state here a bullish reversal could be expected.
Later according to the prediction the price moved to $48.6k on the 20th of August 2021 and the MVRV ratio moved to 153.51%.
MVRV Ratio long-term chart
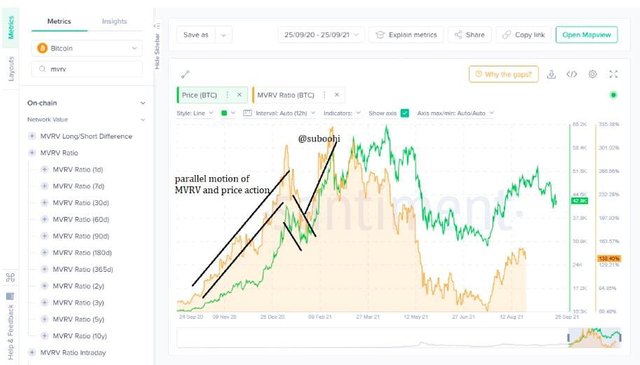
In the long-term chart we again see a direct relation between the price action and the MVRV ratio. On historical point of view the higher points of the MVRV ratio are followed by slight lows in price and the lows in MVRV ratio are followed by highs in the price action.

(3) Is MVRV ratio useful in predict a trend and take a position? How reliable are the upper threshold and lower threshold of the MVRV ratio and what does it signify? Under what condition the Realized cap will produce a steep downtrend? Explain with Examples/Screenshot?

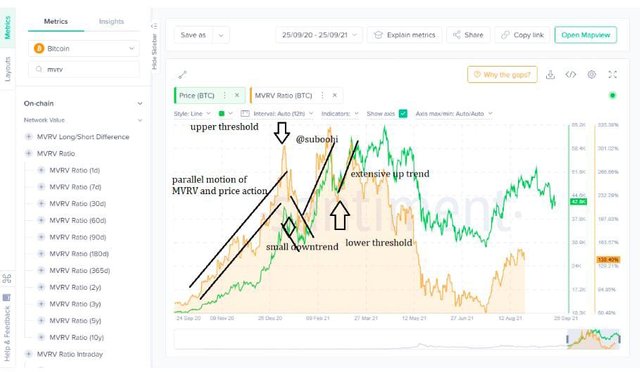
MVRV is actually used by long-term investors to predict market trends and take a position. We already discussed above that the MVRV oscillates with price from 0 to 200 and above percentages and the upper and lower thresholds can predict market reversals and thus can be used as a trade setup by traders who trade at reversal patterns. The MVRV ratio shows the relationship of buying and selling pressures govern by supply and demand on the charts.
The Upper threshold is acts as a resistance zone is relatively less reliable as it is followed by temporary downtrends patterns of the market. Historically as the trend is bullish these downtrends are not that reliable. Still the upper thresh hold is used as a selling signal.
The lower threshold is relatively more reliable as due to an overall bullish trend the lower thresholds are always followed by increase in the price. These therefore are used to place buy signals.
Steep downtrend and RC
No, RC cannot form a steep downtrend. The reason behind this even in a downtrend the investors have a trust on the crypto asset. It is due to the wide adoption of cryptocurrency. Since RC depends on the UTXO balance and the investors to maintain their UTXO balance during a downtrend the RC line fluctuates a bit or remain constant. Otherwise a steep could be formed if the investors lose trust and start to trade their unspent coins.

Conclusion

The different on-chain metric correlates price action with factors like supply, demand and buying and selling pressures. MVRV is commonly used as a leading signal as it moves parallel to the price but can also predict price reversals.