Greetings Everyone and the Entire Steemit Academy community.I humbly welcome you all to the 3rd week of the 5th season in the crypto academy. In this week's task, the professor @lenonmc21 dished out a full package that talked about the perfect entry strategy. The class was a blast and the effort of the professor is appreciated.
INTRODUCTIONUnderstanding the various ways to perform trade with the very best of the entry strategy is simply one priority to be set by any trader to avoid too many losses. For these classes, some of the criteria to be met to execute a trade with the perfect trading styles are hence, discussed below. Enjoy!!!
.png)
[image edited on canvas]

State in your own words what you understand about the Perfect Entry Strategy (Place at least 2 examples on crypto assets)?

The perfect entry strategy can be referred to as a method used by a trader to take a buy position in a trade to get profit. This involves the application of certain indicators like the stochastic oscillator and 200 Moving Average (MA), these two indicators are used in alliance with the Japanese candlestick in a trending market.
Steps taken before executing the perfect entry strategy.
Know the market structure: Before executing the perfect entry strategy, a trader should be able to identify the direction in which the market is trending, a trader should know if the market is experiencing a bearish trend or a bullish trend or if it is ranging.
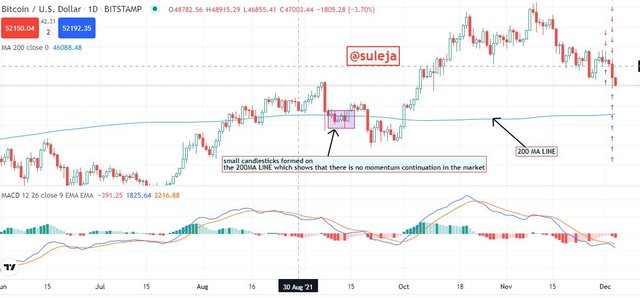
Verify if candlestick flows with the 200 moving average: The 200 Moving Average (MA) should be in accord with the Japanese candlestick before a trader executes a perfect entry strategy.
[screenshot from tradingview]
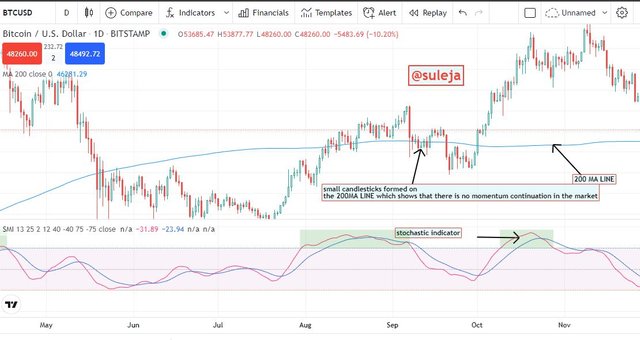
- Stochastic Indicator. This is also one very important aspect to pay keen attention to executing a perfect entry strategy. This simply indicates that when the market is simply trending and therefore meets with the line of 200 MA this simply indicates that all conditions are met and hence the Stochastic indicator plays an important role. This would be explained in the chart below.
[screenshot from tradingview]

Explain in your own words what candlestick pattern we should expect to execute a market entry using the Perfect Entry Strategy.

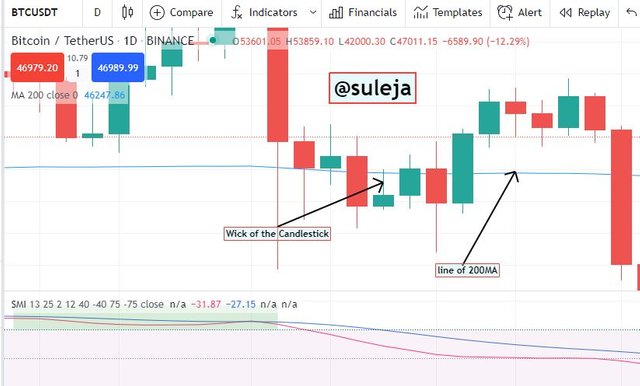
For the execution of a perfect trading style, there are candlesticks that best suits this aspect of trading with a perfect trading style. For this, I will say that the Triger candle sticks. These are simply candlestick patterns that do not move with full momentum. There is simply the type of candlesticks with what's known as long wick attached to them. This wick is simply very tiny and is attached to the body of the candlesticks.
[screenshot taken from trading view]
What this wick does is the ability to slow down the momentum of an asset price in the market. There would be an initial full force movement on the market but when it approaches the line of 200MA it weakens/slow down the pace or momentum.

Explain the trading entry and exit criteria for buy and sell positions in any cryptocurrency of your choice (Share your own screenshots)

It is very wise to set market entry and exits conditions/criteria. Knowing what is expected of the market and having in mind that not all trading would yield out profit or positive results so in trying to make 90% of all trading been done by a trader or an investor, these criteria must be met and also set.
Having in mind when to leave the market and also when to enter the market is already a key to successful trading in advance. Hence, there are these criteria that have to be met and some are therefore explained in the subsequent paragraphs below.
One of such criteria is simply making sure that the structure of candlesticks formed during a market trend simply cut across or form above or below the 200MA. This is simply the right time to enter the market. This is a simple sense would mean that the indicators 200MA and the Stochastic indicator are present in the chart.
Furthermore, having met all due conditions as stated above, it would be wise to enter the market by either buying or selling. But on the other hand, if the already stated conditions fail, the best thing to do is wait for another setup to be formed on the market chart of the asset. Hence, this is been done to ensure that there is a perfect market entry.
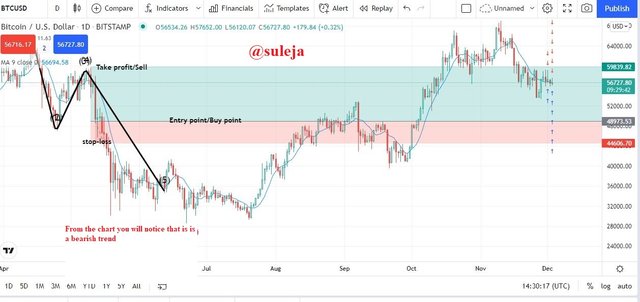
Also, it would be wise to understand the trend of the market at that time. This is to say that the structure of the market/asset you are about to trade must be valid. You have to know if the current trend of the market is bullish or bearish this is to prevent being caught up in a false trend.So, therefore, since all conditions are set and duly observed, there is no need to wait. To enter the market would be the best option then. The screenshot below will display an example of how to enter or exit the market contained in it the
stop loss,take profit/target, and lastly theentry pointof the market.
[screenshot fromtrading view]

Trade 2 demo account trades using the "Perfect Entry" strategy for both a "Bull" and "Bear" scenario. Please use a shorter period to execute your entries. Important you must run your entries in a demo account to be properly evaluated.

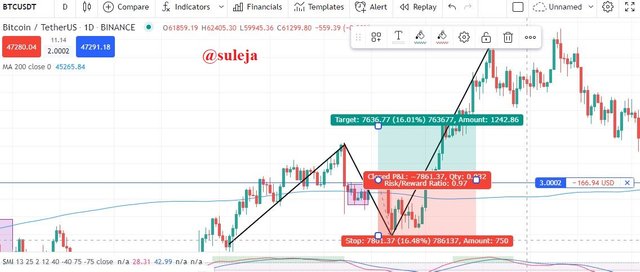
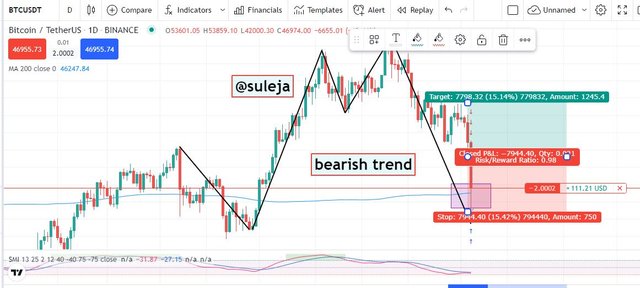
This trade will simply be executed using the BTC/USD token. It would be done using the tradingview site and tools on it. With all protocols and criteria duly observed. Below are charts of both the bullish and bearish trends.
TRADING FOR THE BULLISH TREND
With all of the above criteria explained in question 3 above, I had made sure all criteria were met, I had set my stop loss, entry, and take profit points as demand for a short period. This is shown in the screenshot below.
[screenshot taken fromtradingview]
TRADING THE BEARISH TREND
Similarly as applied above, the same thing is to be done here but in an opposite direction. The coin to be traded here is BTC/USD token.
[screenshot taken from tradinviiew]

CONCLUSION

In a nutshell, having an understanding of how these trading strategies work and how there are been applied is something that would help boost the success of any trade being done.
Knowing when is the right time to enter the market, when is the right time to exit the market, when is the right time to either buy or sell all these can be done with the perfect trading strategy put in place.
Also, another very important thing that is to be noted as a trader or an investor is to simply, first of all, understand the trend of a market. understanding the present or preceding trend of the market is also part of these perfect trading strategies for this would be helpful so we don’t get caught up in a false trend.
However, it is paramount to know your trends. These are simply the Bullish trend and the Bearish trend. The bullish trend indicates when the price of an asset is rising that is trending upward while the Bearish trend is the direct opposite of the bullish trend. This has to do with the downtrend of an asset price.

All thanks to professor @lenonmc21 for this very wonderful class. I must say, the class was knowledge filled, therefore impact was made.
Best regards:
All images present were generated by me.
CC: @lenonmc21

