GREETINGS EVERYONEIt feels great to be part of this very Academy Season. It feels nice to be among those who are been privileged to participate. The previous season has been very significant and wonderful all thanks to God for the success of the entire Academy session.
INTRODUCTION.png)
[edited in https://www.canva.com/]
The crypto market is simply made very effective through the contribution/involvement of what is known as TREND. The trend is merely a combination of movement of the crypto assets in the market.
Hence, these movements can simply be of the rising side of the falling side (this is to say, When a market of an asset increases, that is simply referred to the rising Trend and on the other hand, when the crypto asset is simply on a div/falling from it risen state it hence becomes a falling trend). All these are best described by what is known as Bullish & Bearish Trend Where the Bullish simply stands for a rising Trend and the Bearish Trend stands for the Falling Trend Respectively.

QUESTION:1) a) What do you understand by a Trending market? b) What is a bullish and a bearish trend? (screenshot required)
Question 1aFrom the concept of Trade, you will agree with me that this is simply a process/act by which buying and selling of goods and services inclusively assets/tokens at all levels.

image source
The trading market simply has to do with the increase in demand and supply of a particular asset. In a broader and self-explanatory sense, a trading market can be said to be mean securities (A negotiable financial instrument that holds some type of monetary value in its possession). The market whose prices trend has no definite level of increase or decrease with very few members/participants other than the professionals.
Also, Trading Market is simply a market discipline that aims to increase the demand with a sufficient supply chain readily available at all levels.
Question 1bBULLISH TREND:
The term is said to have originated from a painting that was made by a man called William Holbrook. He called it at that time the Bulls and the Bears in the market. Which seems to have represented the U.S stock crash of 1873.

image source
The term Bullish is also referred to as Bull. Hence, it is said that the Bullish trend is simply based on the belief that an asset will rise in price. This ideology is gotten from the bull which seems to always attack upward with its horn.
A more acceptable definition of the Bullish trend can be said to be the movement of assets price in the positive direction. This simply means the up-rising of an asset from 20% recovery from a market div/bottom.
Furthermore, a bullish trend is simply an upward trend in the price of an asset/a token or the general/overall rise in the price of an asset that is simply characterized by a very high investment or an investor’s confidence. A bullish trend simply indicates the recovery of an upward trend of an asset over a certain period. This is therefore illustrated in the screenshot below.
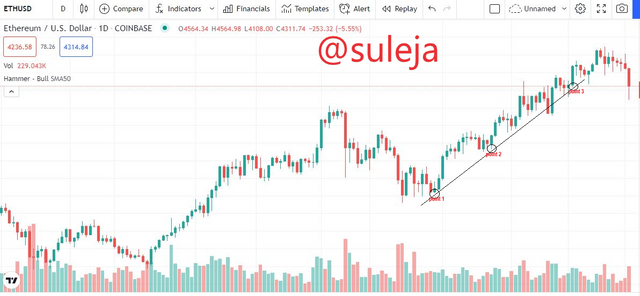
[screenshot from @tradingview.com]
For example, If an individual is been said to be a Bull or Bullish, it simply means that person has a positive attitude and hence has the making money ability. This is better explained when I say; I am Bull/Bullish for the SHIBA COIN. This simply means that I think/have the feeling that the SHIBA COIN will rise.
In a nutshell, the Bullish Trend simply has to do with the rise/upward movement of an asset over some time.
BEARISH TREND:
The Bearish Trend can simply be referred to as a Down Trend. This on the other hand is the exact opposite of the Bullish Trend. This can simply be referred to as the decline in the price system of an asset. It can also be seen as the overall fall of an asset in the market.

image source
Also, this can simply be said to mean a situation in the market where assets prices are continuously falling. Or we can say when there is a continuous dip in the price system of an asset.
The term Bearish comes from a Bear which strikes downward hence indicating that the price of a commodity or an asset will fall or decline from its Bullish state over some time. The Bearish trend in an asset can last for a day, a month, a year, etc. This is simply to say it can last for over a long period. This can be hence demonstrated in the screenshot below.
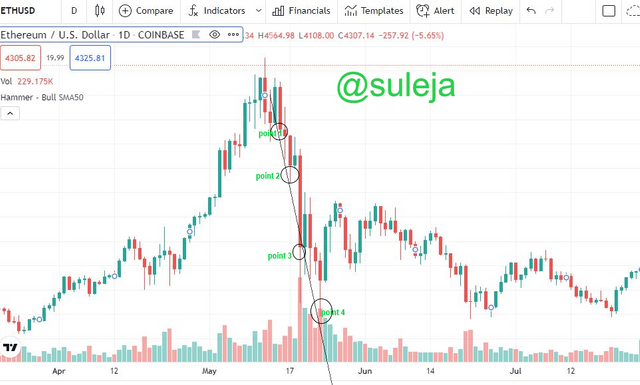
[screenshot from @tradingview.com]
The Bearish trend seems to occur/happen over an investor’s negativity/negative mindset (i.e pessimism) about a declining market price. Therefore, it is said that a decline in price from 20% is said to be bearish.
In a nutshell, the Bearish simply refers to the Downward trend/movement of an asset's price.

QUESTION:2) Explain the following trend identification and give an example of each of them. (Original screenshot needed from your chart). Do this for a bullish and a bearish trend. i) Market Structure. ii) Trendlines
Question 2i
MARKET STRUCTURE
Among other ways of identifying the state of a market, the market structure is one of such very important ways in the identification of a market structure.
This concept is simply not only based on the cryptocurrency aspect, it hence also deals with both economics and also marketing.
In a simpler term, I will say a market structure helps the traders/investors make important decisions. It is said that in decision-making activities, the market structure has an important role through the impacts it makes on the decision-making domain. This is best explained with the use of the Bullish and Bearish trends.
You will agree with me that in the decision-making aspect, using the bearish trend helps the trader make decisions on when to enter the market based on the low price movement of the assets. This is also applicable to the Bullish Trend for when the market gets high the trader hence knows it is time to sell.
To crown it all, I will submit by saying; a market structure is simply the simplest form of price movement in the market. It has to do with the simplest support and also opposition levels on the graphs, charts, etc. On the other hand, the market structure is simply referred to as PRICE ACTION.
Bullish Trend: The Bullish Trend demonstrates the upward trend of an asset market price. Simply plays a vital role in market structure.
No matter the way or manner a chart is been looked at, one very distinct feature to always watch out for is the key for consistency in the Higher-high and also the Higher-low. The understanding of how this works will help the trader operate in the market structure with ease and also aid in the various decision he/she wishes to take.
This is demonstrated in the chart below. A price Trend of ETH/USD. Showing the Bullish Trend of the token.
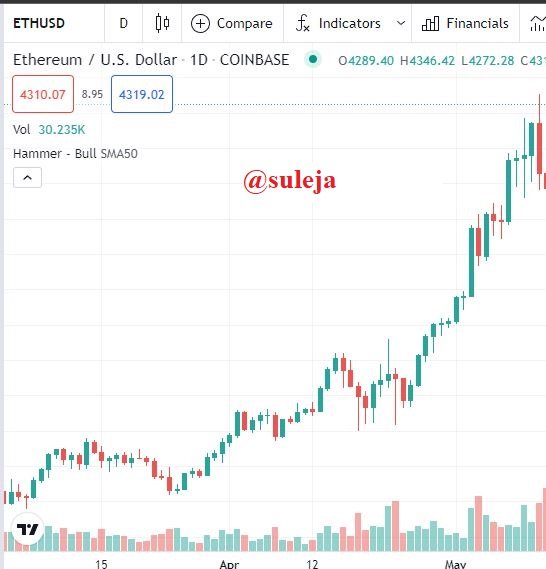
[screenshot gotten from @tradingview.com]
As shown above, in the screenshot, you will then agree with me that a bull market is one that constantly increases in prices.
Bearish Trends: This trend is simply a notion that works when the price of an asset seems to be depreciating from the already risen price.
Therefore, for the Bearish market structure, the market price tends to swing below the already risen price of the asset which in turn forms the Low-high and Low-low. This movement pattern is what simply makes up the structure of the Bearish market. For any successful trading to take place, the traders must first understand how these works as does he for the Bullish trend.
For a more appropriate result, a market is said to be truly bearish if it has fallen below 20% or even more from the recent increment. This can be simply best explained as shown in the chart below. A chart of ETH/USD.
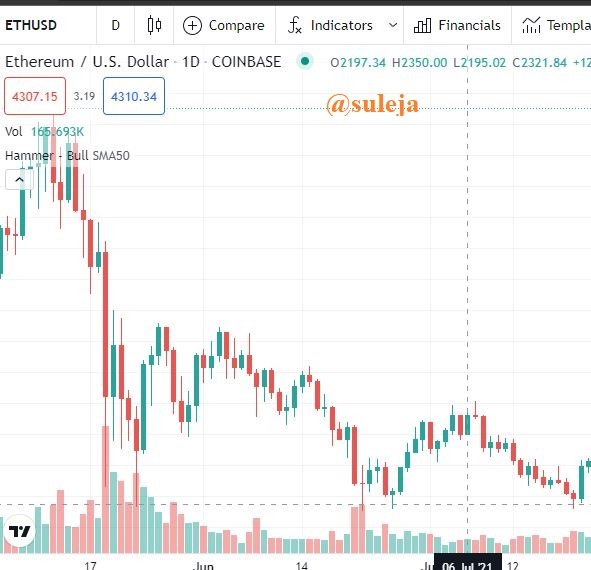
[screenshot gotten from @tradingview.com]
The screenshot above best demonstrate the total decline in the market system/structure of the ETH/USD assets.
Question 2ii`TRENDLINES
Trend lines are a series of recognizable lines that are been drawn on a chart by traders to connect a series of prices. Hence, from the line drawn it simply then gives the best fit of where the investment value may go. The trend lines can simply be drawn to show the current directions of an asset price these drawing patterns are usually drawn in a pivot high or pivot low forms.
A good Trendlines simply helps indicate best fits for some data utilizing a single line or even curves. Hence on a simpler note, a trendline is been added to a chart to bring out a clearer picture of the trend.
Very importantly, every trader does his/her trading at their comfort zones it will therefore interest you to know that the period been analyzed with the exact points used in the creation of a trendline differs from trader to trader.
In a nutshell, a trendline is one of the most importantly used technical analysis tools used by a technical analyst. Here instead of a trader going look for past price history/transactions he simply initiates the use of the trends in price action giving himself more better and suitable trading results.
An example of a trend line is shown below. For Bullish trendlines, the prices of the given asset tends to have an upward trend.

[screenshot from @tradingview.com]
THE BULLISH TRENDLINESAlso, for the Bearish trendlines, the asset is seen declining downward hence, forming a downtrend.

[screenshot from @tradingview.com]
THE BEARISH TRENDLINES
Explain trend continuation and how to spot them using market structure and trendlines. (Screenshot needed). Do this for both bullish and bearish trends.
TRADING CONTINUATION
Mere looking at a price chart on a market system, everything there appears to be very random movement, yet within these price movements are patterns.
Hence Trading continuations are simply indications in which traders look up to make sure that the price trend is likely to continue the play (i.e continue in either the uptrend/downtrend). Also, these patterns simply occur in the middle of a trend which holds that once a pattern is completed, the trend is likely to resume.
Market Structure: In a market structure, price movement creates the higher-high and also the higher-low which happens during a trading period. The cause of these actions helps keep the traders on track. The downtrend that is been formed only indicates that the buyers are to enter the market.
Hence after a retracement, for the price to continue in its original direction after the higher-high or higher-low trends are formed this is simply an indication that the sellers are still very much in control of the market and it would be very unwise for the buyers to come in at this point.

[screenshot gotten from @tradingview.com]
This is simply an indication that the price chart breaks and also continues. Where the price movements stop and then continue pumping. (Bullish Trend>

[screenshot gotten from @tradingview.com]
Similarly for the Bearish trend, which shows that the buyers can enter the market due to the continued formation of the downward trend.
SPOTTING CONTINUES TRADING USING TRENDLINES
As earlier discussed, a trendline is one of the most importantly used technical analysis tools used by a technical analyst. Here instead of a trader going look for past price history/transactions he simply initiates the use of the trends in price action giving himself more better and suitable trading results.
Trendlines are simply gotten through the combination of two (2) points which can be, The Breakpoint and the continue point. This is best described as when there is an uptrend and hence the price drops by a bar or two (Denoted by red) without falling down below the previous low points and then continues with an uptrend (Denoted by Green).

[screenshot from @tradingview.com]
From the chart above, you will notice where I labeled step1 and so on. This is an indication of the breakpoint and continued point. As earlier said that trading lines are a combination of two points.

4) Pick up any crypto-asset chart and answer the following questions - i) Is the market trending? ii) What is the current market trend? (Use the chart to back up your answers).
The market is trending. I choose the ETH/USD asset for this practical.
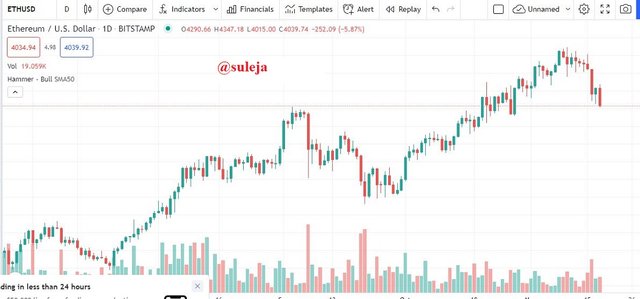
[screenshot taken from @tradingview.com]
From the chart above you will see that market has a bullish trend. This simply indicates that the asset price is hence on the rising side. From the chart above you will notice that the market structure comprises of many things.
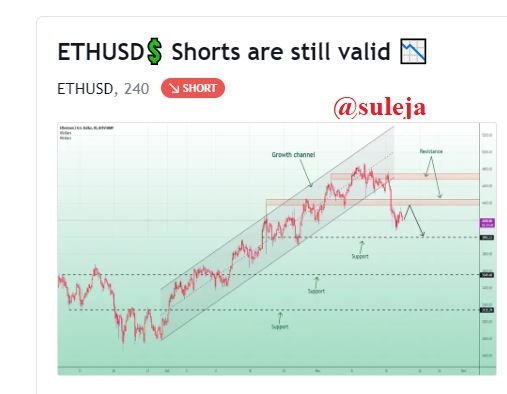
Despite the resistance level, as shown above, there is a certainty that the market price would definitely still rise and hence this shows the sellers are still in control of the market and it is not very wise for buyers to enter the market for now.
[screenshot taken from @tradingview.com/symbol/ETHUSD]
You will notice that at the level the asset is now it is very difficult to find an entry point into the market. Hence, there is a likelihood for a pullback from the resistance level into the market again.

CONCLUSION

In a nutshell, it is simpler to understand the bullish trend all you need to know is that the bullish trend stands for the increase in an asset price over a period of time which is also known as an uptrend.
Similarly, for the bearish trend, this justifies that the movement of an asset price falls down. Which is also known as a downtrend.
I will conclude by saying the class was very interesting and was knowledge full. All thanks to prof. @reminiscence01 for this very interesting class.

Hello @suleja, I’m glad you participated in the 1st week Season 5 of the Beginner’s class at the Steemit Crypto Academy. Your grades in this task are as follows:
Observations:
What is a trending market not trading market. Pay attention to the questions asked before answering them.
Recommendation / Feedback:
Thank you for submitting your homework task.
Downvoting a post can decrease pending rewards and make it less visible. Common reasons:
Submit