Hello everyone hope so you all are well and good so finally i was able to spare some time for the homework post for the Professor @sapwood and yes it is all together a whole new experience of learning i really enjoyed.

Question 1:
What is a HODL wave, how do you calculate the age of a coin(BTC, LTC) in a UTXO accounting structure? How do you interpret a HODL wave in Bull cycles?
Answer 1:
Hodl Wave:
The term Hodl is always misspeled as it's meaning is Hold which means to hold a particular coin for a certain duration of time which can be anything from 1 months to as long as few years.
Hodl Wave simply means the holder of that coin do not want to transact that coin and prefer to hold it in a particular address without even transacting it from a longer period of time.
As the number of address holding the coin increases the price tend to flaten up making less movement as the majority of the coins are on hold and the holders prefer not to transact it making the price stable.
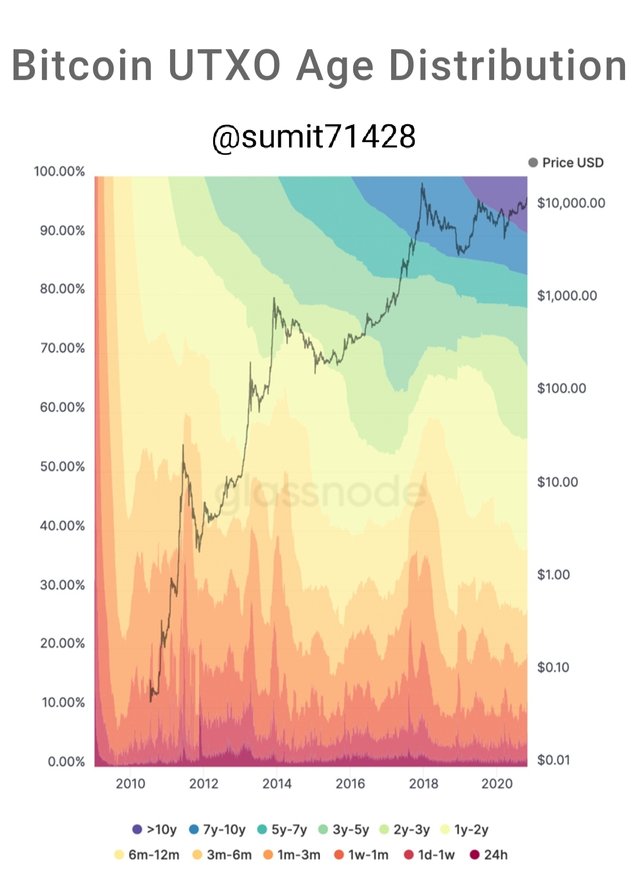
src
Image of HODL wave
HODL wave is a very common chart pattern which can be easily witnessed after a rally as after that market tends to HOLD them in there respective address.
Calculate the age of a coin:
Very often people interpret that the age of a coin means the date on which that coin was launched in the market but that's not true as the age of a coin is calculated from the date from which the coin is stored at a particular address.
We can calculate the age by the UTXO accounting structure where UTXO stands for Unspent Transaction Output.
Age of the coin= Amount of coins in a wallet × For how long the coin was HODL in that wallet.
Whenever a particular coin is transferred from one wallet to another it leads to a generation of new UTXO.
Interpreting the HODL wave in a bull cycle:
Before a bull cycle we very often see a HODL wave as when a major holding of that coin is left un transacted it tends to create a sell pressure among the existing holders which creates a demand and as the supply being low eventually leading to the increase in the price and this lead to the bull run.
In past we have witnessed HODL Wave many a time in bitcoin as bitcoin being the sole currency so it is very important to monitor it's HODL.
Question 2:
Consider the on-chain metrics-- Daily Active Addresses, Transaction Volume, NVT, Exchange Flow Balance & Supply on Exchanges as a percentage of Total Supply, etc, from any reliable source(Santiment, Coinmetrics, etc), and create a fundamental analysis model for any crypto[create a model for both short-term(up to 3 months) & long-term(more than a year) & compare] and determine the price trend (or correlate the data with the price trend)w.r.t. the on-chain metrics?
Answer 2:
Application of On-Chain Metrics:
There are few websites through which the application of on-chain metrics can be done. I am using https://coinmetrics.io/ for this purpose and will use btc and do my analysis.

At first open the link and then go to chart section and go to network data.
After that you will get the option to select the coin so i have selected Btc for it.

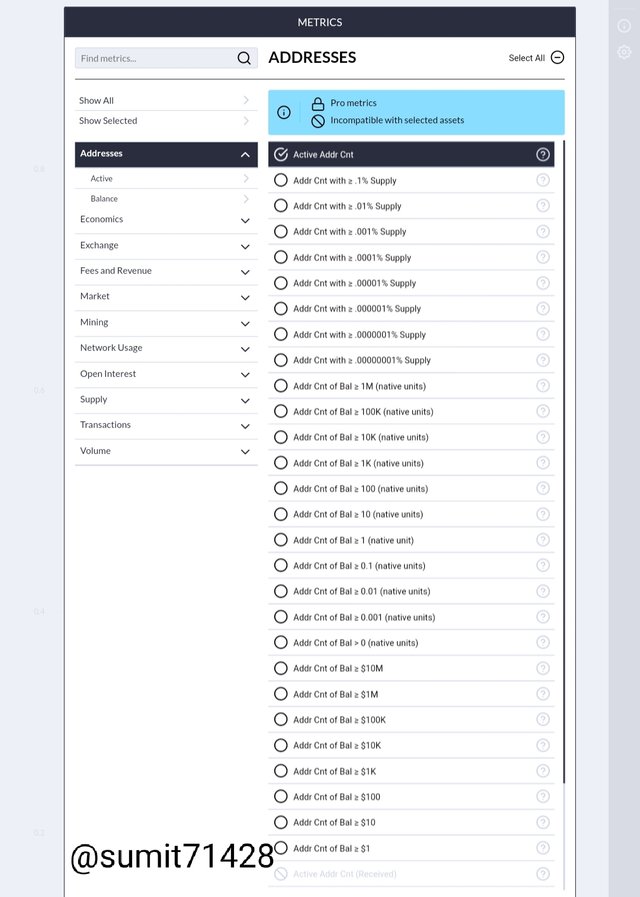
Now click on metrics then go to address and then active address count.
Short Term 3 Months analysis of BTC active address vs it's price.
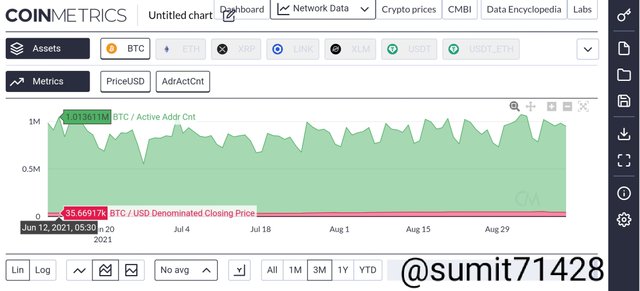
- On june 12 when there were 1 million+ active address then the price was $35669.
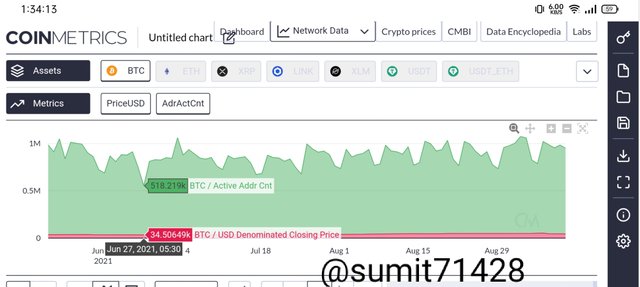
- On june 27 when active address was 518k then the price was $34506.
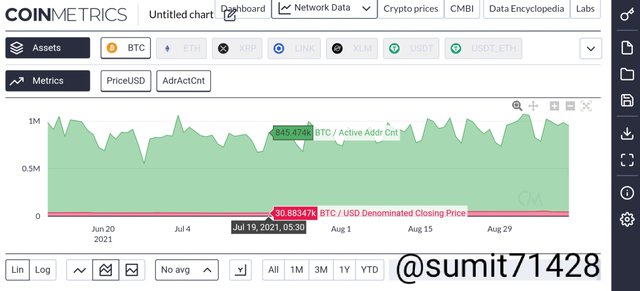
- On 19 July when active address was 845k then the price was $30883.
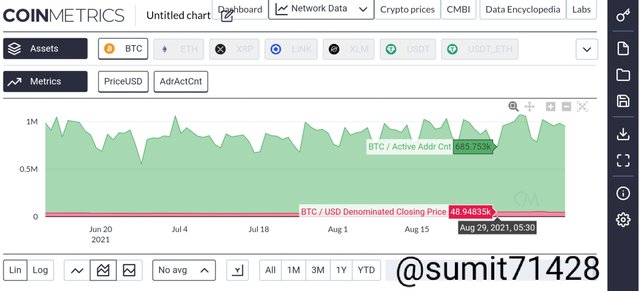
- On 29 August when active address was 685k then the price was $48948.
So if we conclude in the matter of around 3 months the total number of active address has fall around 31% and the price has increased around 37%.
Long Term 3 year analysis of btc active address vs it's price.
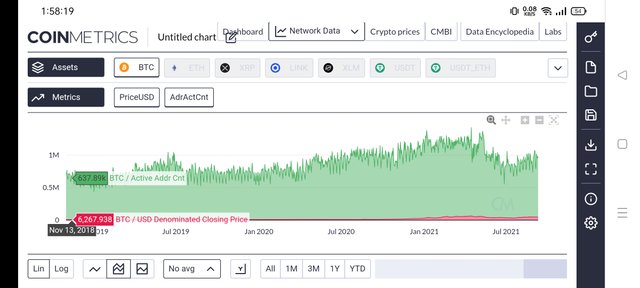
- On November 13, 2018 the active address stand at 637k and the price was $6267.
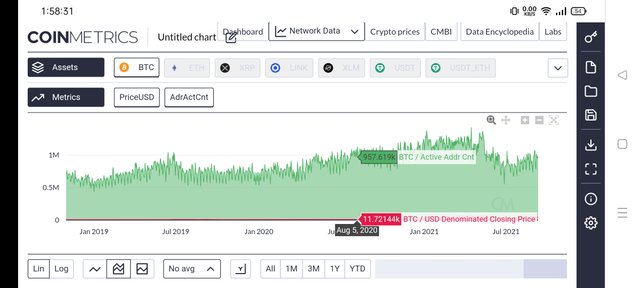
- On 5th August 2020 the active address stand at 957k and the price was $11721.
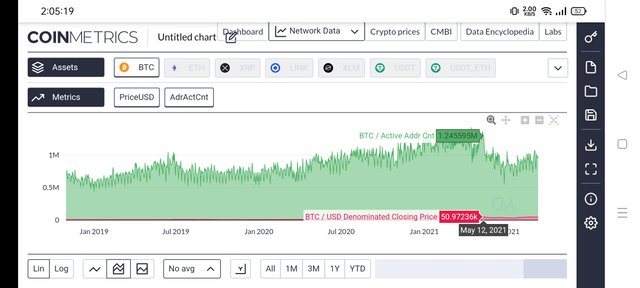
- On 12 May 2021 the active address stand at 1.24 million and the price was $50972.
So in long run as well we can see that there is a increase in active address by almost 100% and the increase in price was by 700%.
Hence, from this comparison we can conclude that in a short time frame there is not much effect of active address but in long run as the number of active address increase the price also increase so there is a direct relationship in long run.
NVT
So firstly set the chat to NVT by clicking on Metrics and then go to economics and then head towards NVT.
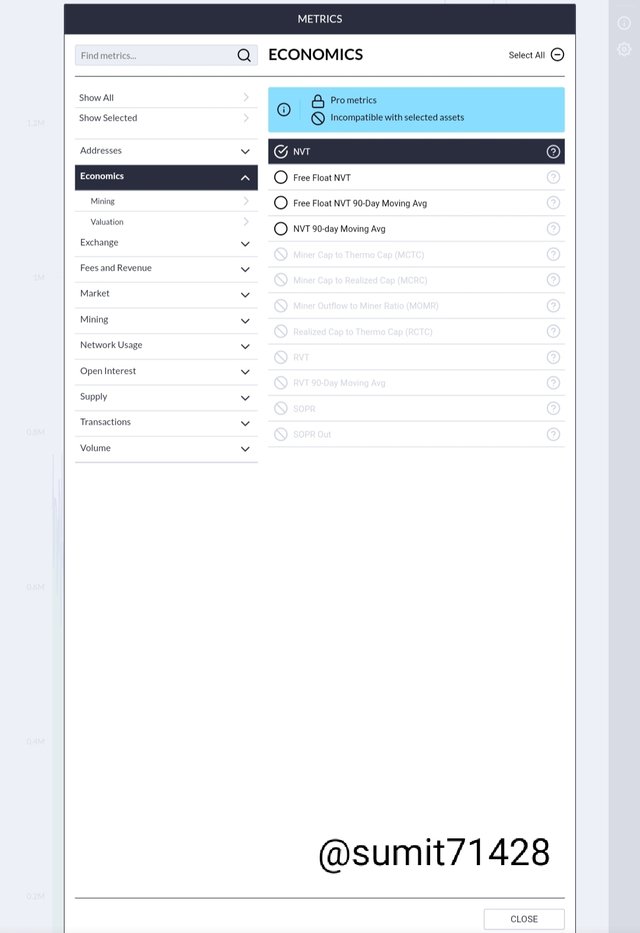
NVT is Network Value to Transaction Volume as it reflects the relationship among the market capitalisation and transfer volume. It is also called PE ratio.
NVT= Network Value/ Daily Transaction Volume.
NVT can turn out to be a great indicator as when the NVT value is high it indicates that the asset is overvalued and there is a potential threat of a bubble being formed due to many factors of market and in the same way when the NVT value is low it is considered that the asset is undervalued.
NVT probably works best in long run as in short term it is not able to predict weather there will be a crash or not rather it just shows the consolidation part.
Short Term 3 months analysis of NVT
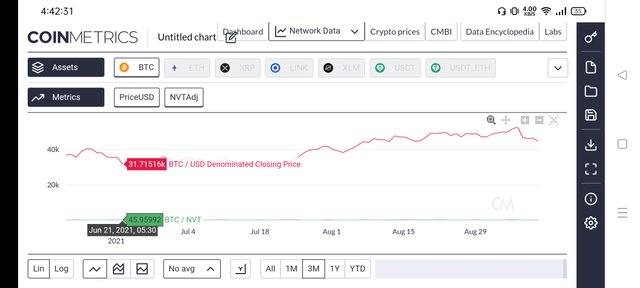
- As on 21st june the NVT was 45 and the price was $31715.
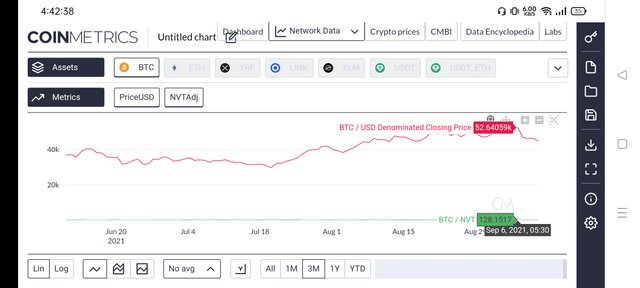
- As on 6th September the NVT was 128 and the price was $52640.
By this we can simply say with the increasing NVT the price also increases in short term.
Long Term 2 years Analysis of NVT
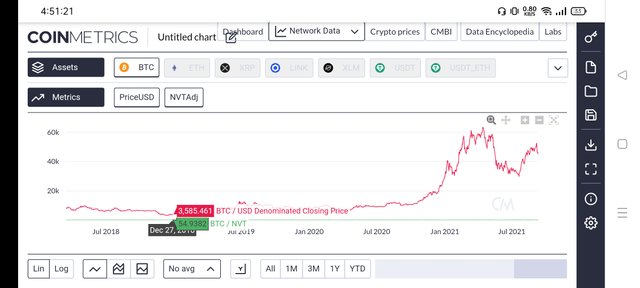
- As on 27 December 2018 the NVT was 54 and the price was $3585.
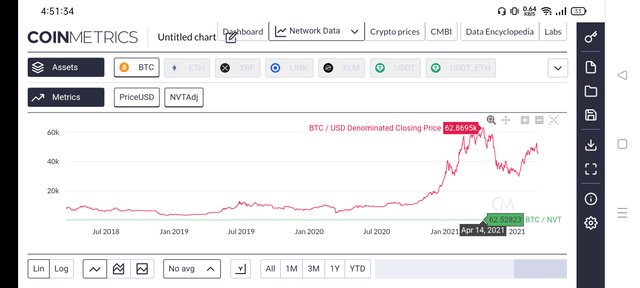
- As on 14 April 2021 the NVT was 62.5 and the price was $62870.
As you can notice that with the steady increase in NVT the price has increased a lot making it a kind of bubble and soon after that we all know that the market had corrected itself to a very major levels.
Exchange Flow Balance
We all know that the number of units of a coin deposited or withdrawn from a exchange have certain amount of impact on the price of that token.
Exchange Outflow Native Unit Short Term Analysis.
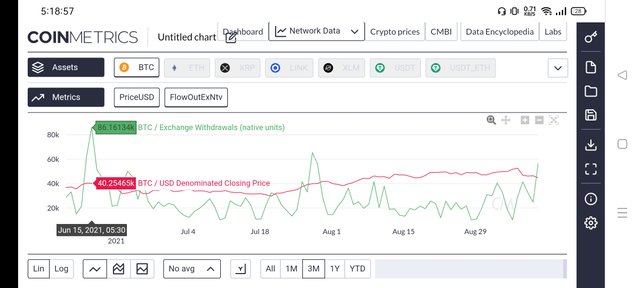
As you can see from the chart the withdrawal peeks are sometimes very high and sometimes it is very low but the impact on price is very low as it is almost ranging around same price point with little fluctuations.
Exchange Outflow Native Unit Long Term Analysis.
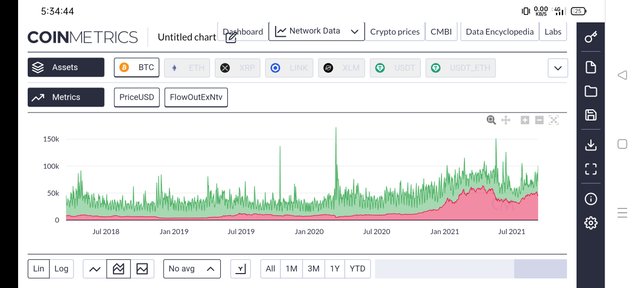
In long run as well you can see the price is increasing steadily but the pattern of exchange outflow is not at all predictable so as far as i can understand that there is slightly relationship between them as the time passes more and more outflows will take place and at the same time price will also increase.
Netflow of Assets on the exchanges in USD.
Short Term Analysis.
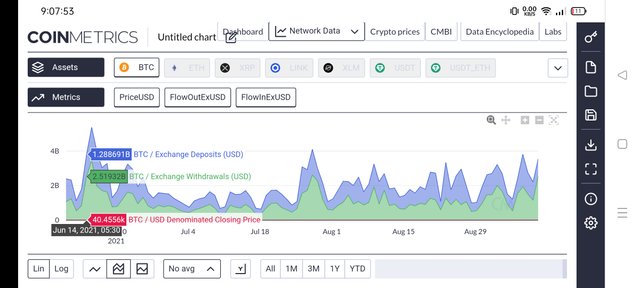
On 14th June there was an net withdrawal of $1.2B and the price was $40456.
On August 10 there was an net deposit of $370M and the price of $45488.
By this we can simply conclude that the price has increased to certain extent after the deposit are high so the impact can be seen in the price.
Long Term Analysis
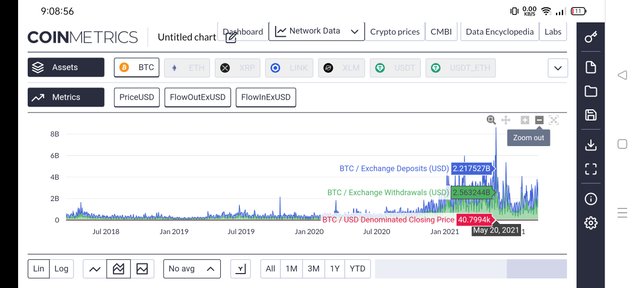
In long term as well we can see with the heavy inflows and outflows of assets we can see the impact of it on the price of the coin. So we can see that the inflow and outflow do have the impact on it.
Question 3:
Are the on-chain metrics that you have chosen helpful for short-term or medium-term or long term(or all)? Are they explicit w.r.t price action? What are its limitations? Examples/Screenshot?
Answer 3:
As far as i have came across the on chain Metrics I don't find in much helpful as per my trading style though i do agree it has its own importance and helpfulness but as per my style is of long term holding so I don't care much about it.
NVT is a good indicator but as long as you are using it for knowing weather it is overpriced or underpriced apart from that there is nothing which you can expect from it as far as my usage is concerned.
If we take into consideration the inflows and outflows even that don't show the clear picture in terms of price so even this has not turned out to be a good one.
Limitations:
As the on-chain metrics including with crypto is a very new concept so there are still many draw backs such as lack of price action as price does not follow any set pattern rather it is all confusing.
All the examples used above does not show any clear picture for the price trend making it really unpredictable still we can use it for historic data and try to figure out its price.
Conclusion
This was an all together very new thing which i came across though to certain extent i am still not clear but yes atleast i have got the basic idea about the on chain metrics.
It was an whole new experience but the best part was NVT and apart from it everything else was something which i think i will not use it.
Though i will thank professor @sapwood for such an great content i really loved it.
Thanks friends have a great day ahead.
I have made the changes as suggested by you please do check my post now 🙏
Downvoting a post can decrease pending rewards and make it less visible. Common reasons:
Submit
Please have a look at my achievement3 post
https://steemit.com/hive-172186/@amirbhat/achievement3-or-amirbhat-or-task-content-etiquettes-on-steemit
Downvoting a post can decrease pending rewards and make it less visible. Common reasons:
Submit