Greetings my fellow future cryptowhales and cryptominded individuals, we are slowly going deep into crypto trading. Today we would be looking at a few questions to help us learn more about basic EMA strategies and Trend line breaks as you can see from the questions below. I hope I am able to explain it to your understanding and now without wasting any more time, let's dive in. Shall we?

Define and Explain in detail in your own words, what is the Strategy of the EMA + Breakout of the Trend line?

To start off we first need an idea of what EMA stand for
Estimated moving average is the average of the sum of the closing prices or nth term. The value gotten after the division is the ema and it helps give an idea of the trend direction of the market, when the price is above the ema line it indicates that the price is in a up trend and also when the price is below the ema it indicates that the price is in a down trend.
The trading strategy to be used is as follows
Since the ema is an indicator of either and uptrend or a downtrend we weigh look for the moment the price crosses from below or above signaling the the trend is becoming bullish or bearish in the sense that if you short on a market you would need to close the market and start going long and vice versa. All in all the moment the price crosses the ema line it signals a change in the trend and thus could be seen as an entry or exist signal depending on where you stand in the Market.

Explain in detail the role of the 100-period EMA in the EMA + Trendline Breakout Strategy?

There are various EMA popularly used in trading but for the sake of the assignment I would be focusing on the 100ema.
100ema
This the sum of the last 100 closing price over the 100. This helps to give a moderate signal as to which direction the price is. Heading. From using the previous closing prices we are able to predict to an extent the future prices. So in essence when the price is above the ema line we could see this as an indication that the market is in an uptrend. On the other hand when the price is below the ema line it indicates that the price is on a down trend.
The 100 ema is a moderately places as it can be used to indicate the trend of the market on both high and medium time frame.

Explain in detail the role of the "Trend Line" in the EMA + Breakout Trendline Breakout Strategy?

Trend lines are lines drawn along the prices and ahead of the price to indicate the direct at which the price seems to be moving. The trend lines are drawn across the price that is from the highest to the lowest which gives a slanting line. If the line is slanting upward it could be said to be uptrend and downward could be said to be a downtrend.
When trading the trend line with the ema they are certains to to consider. The position of the trend and the position of the price as this gives an idea of what is going to happen. Just looking at the price along could at times be difficult to decipher but with the help of a well drawn trend line determining the direction of prices becomes less complex and more easy to do so.

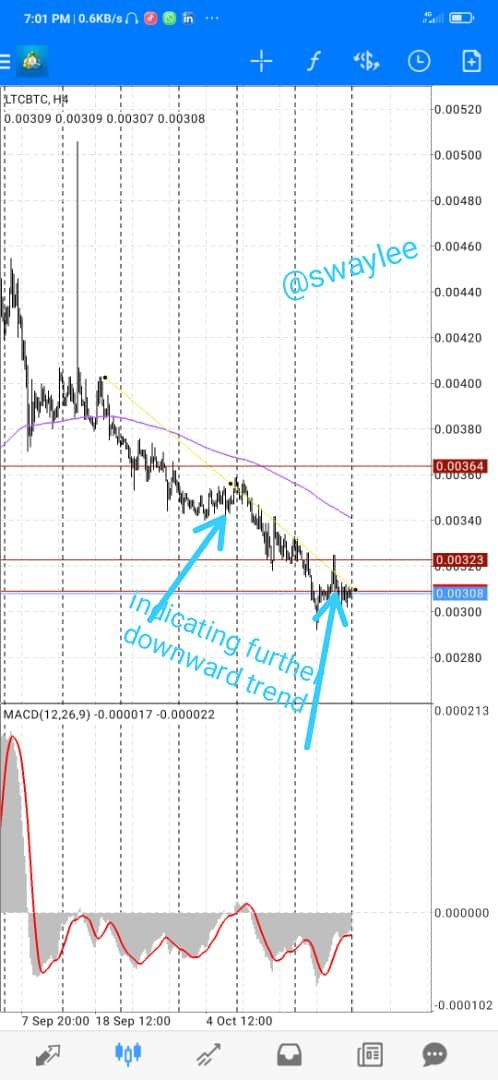
From the chart above we can see the yellow line which indicates the downward.as we can see the price keeps dropping and despite various small increased the trend line maintained that the price was on a downward trend.
In essence wwe use the trend line to know the direction of markets nd in what direction we should buy. Depending on the type of trader yo are. They are trend traders and retracement traders trend traders would always sell or buy in the direction of the trend while retracement traders will look at the trend shows the slightest weakness and buy.

Explain the step by step of what needs to be taken into account to execute the EMA + Trendline Breakout strategy correctly?

- Step one : Input the 100 moving average into your graph
- Step two : Observe where the line lies
- Step three : Draw your trend lines
- Step four : Set your entry point at the point where the price crosses your ema in the opposite direction
- Step five : Set your take profit and stop loss

The first thing we need to do in trading the ema break out strategy is to input our ema into the chart and title it. When imputing a 100ema the following should be taken in to account.
From the diagram above on my meta Trader 4 you select the figure to 100 and select exponential. After doing this select on ok.

Your chart starts to look like this. From this things start to get simple you draw your trend line and and support and resistance if necessary to show you when to enter the market.
Essentially a good buy signal in the market above is when the price hits the ema from below and falls down .
A good sell signal is when the price hits the ema and goes above this indicates that's the downward trend has ran it's course and an uptrend might me lurking around.

What are the trade entry and exit criteria for the EMA + Trend Line Break strategy?

Entry criteria

Ltc/btc chart
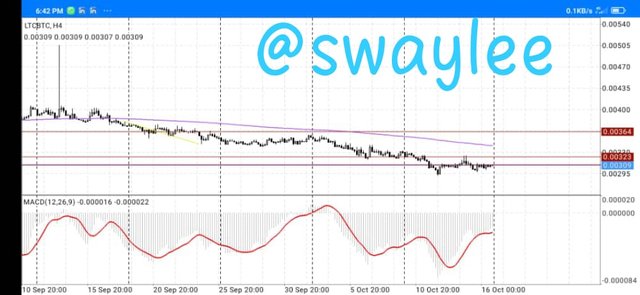
From the chart above it shows that ltc is in a downward trend. This is gotten from the position of the ema line which is above the price. Since we know it's on a downward trend the next thing we need to know is when can we enter the market.
That's where trend line and price action comes . When you want to enter a downward trending market you have to look for the point in which the price rises up to the ema and falls this serves further confirmation that downward trend is strong and still on going so you should buy at this point.
From the graph above we can see where the price rose up nearly crossing the price from above but faced a strong resistance at .00032 and fell down slightly.
From this we can see that the best time to buy during a downward trend is when the market fails to break the ema from below and falls back down. Ltc/Btc is on a downward trend and the charts gotten from here indicates this that ltc/btc is on a downward trend (bearish market) hence majority of our illustrations above indicates how to trade in a bearish market, though or from previous analysis, it could be seen that the trading of a bullish market could be timed by mirroring the trading pattern of a bearish market with little variation. For easy understanding, only the bearish market was emphasized on in this post.
Exist criteria

When the market is in a downtrend we are looking for signals to indicate to us that the trend is about to change direction that's is from a bullish to a bearish trend.
To do this, an illustration has been given on our chart above. From the chart above we can see that during a bearish market the signals we are looking for is the point where by the price breaks above the ema from below there by signalling that the trend direction has been changed. This could be due to a steady rise in the price of previous closing price or a rapid rise in the price. Although from observation of the charts a sharp increase in price is usually followed by a sharp decrease in price also known as correctional movement of price.

Conclusion

I believe with this few graph and explanations I was able to expand our knowledge on this topic. I hope we have been able to understand how to make use of the basic ema strategy and trend break line in making our technical analysis. All the screenshots used in this post were taking on the Meta Trader 4 app on my device