Hello Steemians and Professor @kouba01,
I hope that you all are doing well so do I. I am going to show my homework given by Professor @kouba01 in which I have briefly described about RSI indicator used to get trading signal and tried to describe its all aspects. So let's get started,

What is the Relative Strength Index - RSI
RSI is a momentum oscillator uses speed and change of price movements to help in the technical analysis of market. It is developed by J. Welles Wilder Jr. an American engineer in 1978.
Relative Strength Index gives us oversold and overbought points of certain product to help investor in trading at that point. RSI works between 0 to 100 and have a mean point 50, values above 50 are considered as uptrend stream and value below 50 are considered as downtrend, whereas, overbought point is above 70 and oversold point is below 30. RSI indicator uses to get signals for investments. It is may be a complicated view but helpful for future investments.
How to calculate
RSI has many formulas used on different occasions but one general formula for that is,
Where average loss or gain for n period is depend on hours, days or years and it is typically used on 14 hors, days or years time frame because RSI is default set on 14 period.
The term average gain or average loss is the average of what investor get or lose in 'n'period.
For example if we take a time frame of 7 working days then total income in 7 days i.e (10+15+5+10+10+12+8)/7 = 10 ,where 10 is the average income of week then same method applies on profit and loss territory.
Can we trust the RSI on cryptocurrency trading and why?
we can use the rsi indicator but you better do more research on further analysis and indicators because a good trader can never take trades on the basis of 1 indicator, although as from my point i basically use RSI MACD DIAL INDICATOR AND FUNDAMENTAL ANALYSIS because crypto market is highly volatile market as part from stock market crypto market always show us great bullish and bearish trend in market. So make trade on the basis of all indicators but RSI shows best entry points rather than MACD.
some times you can see that RSI show the buying zone but MACD still ain't show us the best buy zones but it gives as the trading zone but RSI gives the best zones so thats why I uses RSI rather than MACD, so when you saw that RSI is 20 above there is good buying zones and you can enter in the market but 60 and 70 seems consolidation in market and when it hit upto 80 you can exit the market as market is in the situation of over buy and strong buy zone can be seen, thus RSI is a good indicator but to trades on the basis of other indicator too because of the volatility of crypto market as if your predictions and indicators are seems to charged than surely it will give you juicy trades.
How do you configure the RSI indicator on the chart and what does the length parameter mean? Why is it equal to 14 by default? Can we change it? (Screen capture required)
I am describing about RSI by using tradingview, here the steps to open RSI indicator in tradingview as follows,
- In first picture, it is shown to go on indicators portion.
- In second picture, search RSI on the search panel.
- In third picture, you can see below chart the RSI indicator opens up yellow line is the indicator's.


The average value given by indicator by configuring the data and by this information a chart formed which provides us information about future trading signals. The value of RSI is by default 14 and the developer of RSI J. Welles Wilder also state it as a ideal position for the trade. It is not really depend upon the 14 value you can also set it on different point like 30, 50 as your position in the market. It can just provide you data based on what you have selected like for 14, it will provide data for 14 hours or 14 days etc.
How do you interpret the overbought and oversold signals when trading cryptocurrencies? (Screen capture required)
It is not very critical to know about overbought and oversold signals using RSI.
- In the range of 0-100, if the line crosses 70 and start climbing up then it means that overbought or sell signal arrived at that point it is more likely that the price will go downward.
- If the price drops from 30, it means that the price will drop down and oversold or buy signal arrived at that point because it is likely to go upward.
In the below given chart of bitcoin, overbought and oversold zones are highlighted by red circles and it is in the middle zone at the moment.

Last time it touches 90 in the overbought zones and then it crashes down to oversold zone to 30 which indicates the oversold zone of BTC.
How do we filter RSI signals to distinguish and recognize true signals from false signals. (Screen capture required)
There are so many indicators used in crypto tradings to predict future every indicator indicates differently due to different formulas. Though no indication is 100% accurate, every indicator may have flaws so that RSI has. To lower the effect of false indication we use the term divergence in RSI indicators and they are of two types,
1- Bullish divergence
2- Bearish Divergence

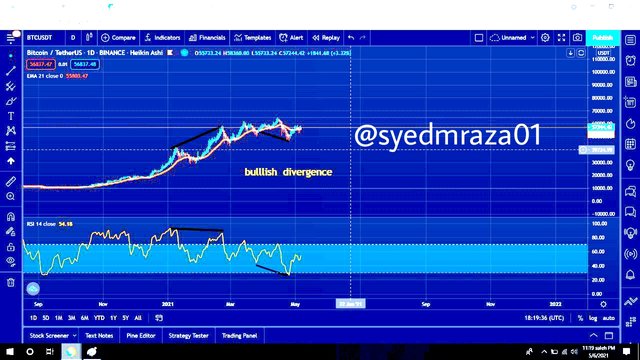
In bullish divergence, the RSI indicates the lower lows whereas the market shows us higher lows. That means that in RSI the line falls below its lower point and expect to experience another low point after that as you can see the black line in the end of RSI indicates lower low because it has a low point before it, whereas, in market it shows downtrend at that point.

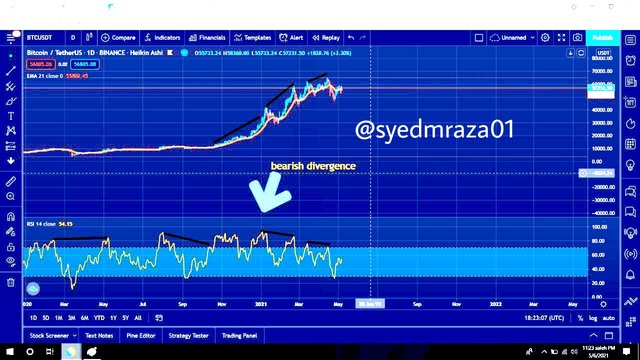
In Bearish Divergence,theprice in market reaches to higher highes as you can see in the screenshot of bearish trend whereas in RSI indicator it shows lowers high and the market is in uptrend stream. This is also in overbought point of the RSI so that it indicates it will sink in soon.
Bearish and bullsh divergence are there to assist the investor in its trading and help him make his decision more accurate and profitable. However, the values of RSI indicator has a great hand in providing these trends so you muat have to dig deep to find out that which way is more suitable for your investments.
Review the chart of any pair (eg TRX / USD) and present the various signals from the RSI. (Screen capture required)

Here's the chart of XRP I have chosen to tell you about different RSI signals.
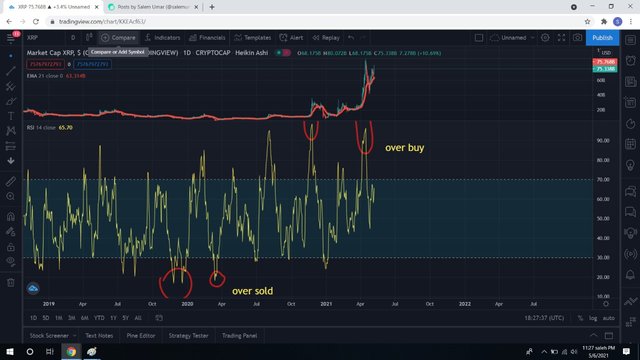
In the following graph, you can see that in the end of 2019 the coin value drops down to 15 to 20 which is oversold point and then crosses overbouggt region 3 time in the next year and its value goes beyond 90. So right now it is in the middle region above 50, if we look back on the chart of RSI we can say that it is very less chance that it could hut 90 again in this period but it first likely to fall in oversold region again then there will be a chance that it will rose back.
Conclusion
Cocluding all the variables we can say that RSI is a really helpful tool for investors to look into the future of trading, whereas, there are also many more indicators in trading alongside RSI when combine gives more accuracy in the prediction of future pricing.
That's all for this homework I have made sure to make understand all the important factors of RSI after this homework and also wait for your next task so that I again gain more knowledge from you.
Also thanks for @cryptoacademy to organize such knowledgeable courses.
Note : All the pictures used are the screenshots taken by myself.
Thank you,
CC
@kouba01
@steemitblog
@steemcurator01
@steemcurator02
@steemcurator03
@steeemcurator07
@kouba01
@steemitblog
@steemcurator01
@steemcurator02
@steemcurator03
@steeemcurator07

Dear sir @kouba01 this is my repost for week 4. My post was not verified due to less than 100 SP in wallet. Then I have Power Up and I have now more than 100 SP in wallet, kindly verify my previous post, here's the link attached of it,
https://steemit.com/hive-108451/@syedmraza01/cryptocurrency-trading-with-rsi-or-homework-by-syedmraza01-or-to-professor-kouba01
Downvoting a post can decrease pending rewards and make it less visible. Common reasons:
Submit