Introduction
Hello @steemitblog and my fellow @steemcryptoacademy students. I am delighted in participating in the week 3 of the Steem crypto academy. I participated in the lecture by @stream4u. And he taught on chart patterns, price Breakout, continuation, reversal pattern and STOPLOSS.
So if you missed the lecture, you can check it out here.
Chart Pattern:
These are charts that form the price of assets in trades and investment. They perform one of the most crucial roles in the technical analysis which is to confirm signals for but and sell of assets. They can be found in different time frames of candlestick charts within (5 minutes, 15 minutes, 12 hours, 1 day etc). Hence they provide signals for entry and exit based on their support and resistance.
Example of chart pattern from my binance.

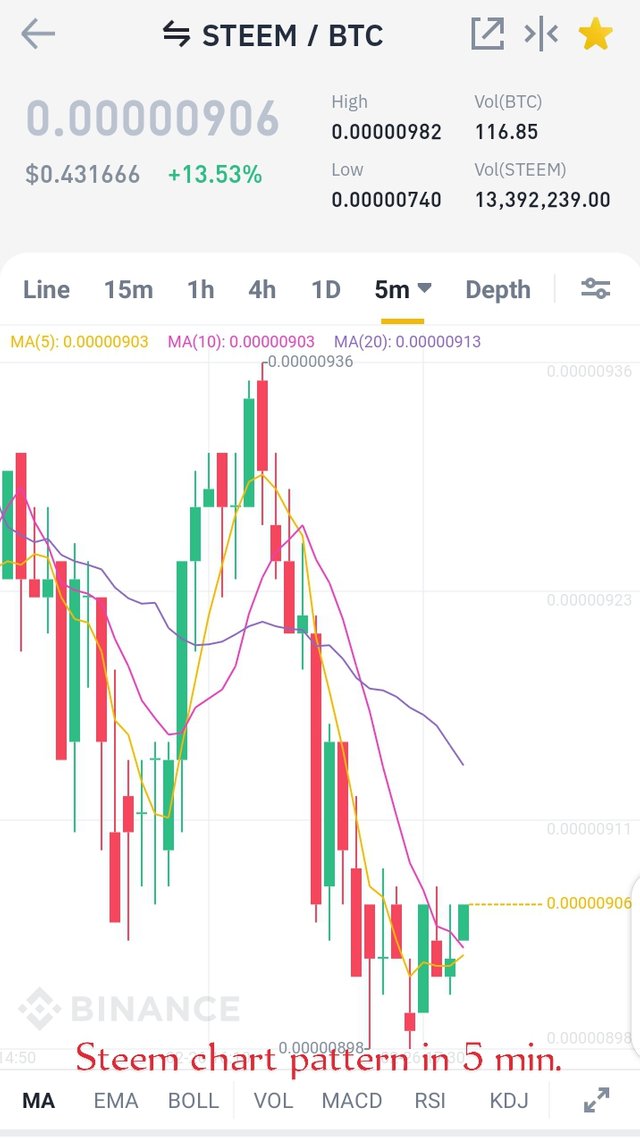
The above screenshot was taken from my binance market wallet.
Price Breakout:
This is a situation whereby an asset price tries to move above resistance or below support. As we all know from last week's lecture, Support is the level from where assets price looks difficult to move below, while resistance is the level whereby an asset price seems difficult to move above.
It is usually risky to trade on price Breakout level, though it is also a fast trade that give big profit in a short while.
Examples of support and resistance breakout.
The below screenshots are support and resistance breakout examples, using my binance trx and Steem coin.

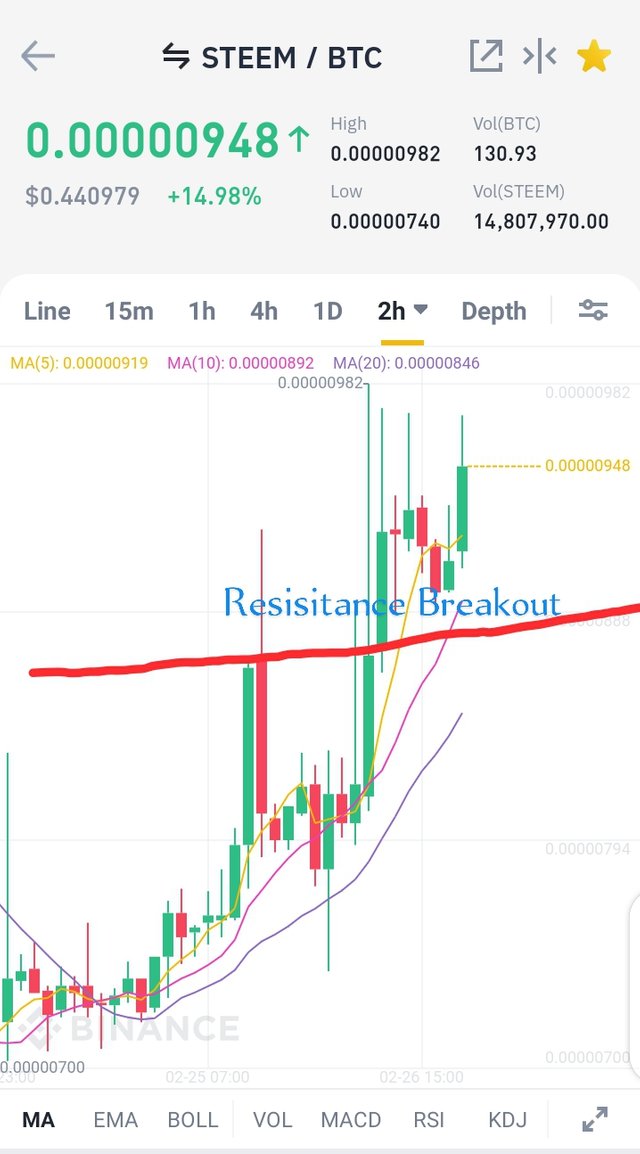
Continuation Pattern:
This indicates that the major chances of assets will continue in their existing trend either downtrend or Uptrend. Here the price trend is likely to remain in play over a period of time.
Continuation Levels...
Higher high:
Here the buyers are in control of assets price than sellers. Hence they take price back to the recent high.
The below screenshot is an illustration of higher high, using my binance Steem/BTC market chart.
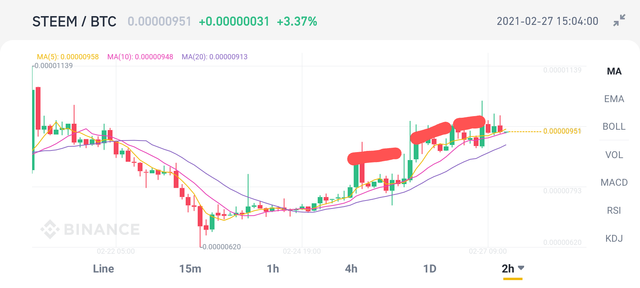
Lower Low:
Here the sellers are in charge of the assets price more than the buyers. They take the assets prices back to its recent low price.
The below screenshot is an illustration of the lower low level of continuation Pattern, using my binance BTC/USDT market chart.
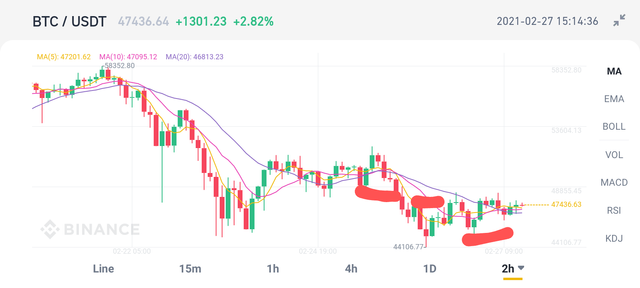
Higher high formation with double top pattern illustration:
The below illustration is an example of a double top pattern of higher high formation, using my binance ETH/USDT market chart.

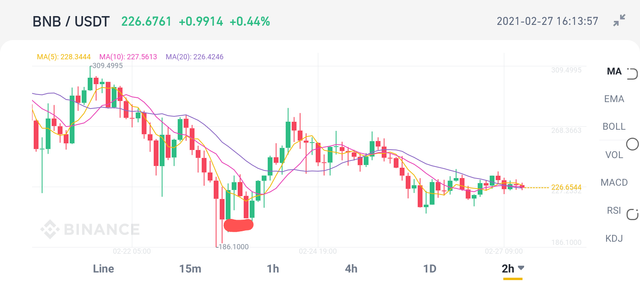
Lower low formation with double bottom patter illustration.
The below illustration is from my binance BNB/USDT Market chart.
Double top pattern:
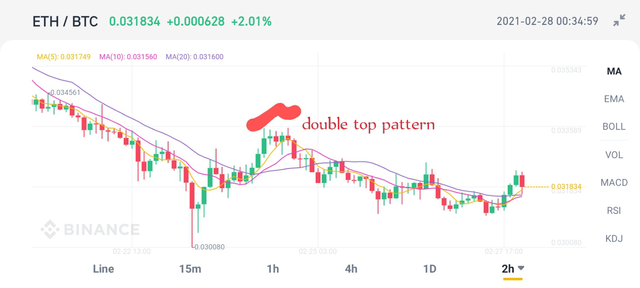
This indicates that the uptrend is reaching to the end and downtrend will set in.
Here we see the price movement go higher and then comes down, and again come to around the same high point, which makes it looks as though it is struggling but not getting success.
The below screenshot is an illustration of double top pattern using my binance ETH/BTC market chart.
Double bottom pattern:
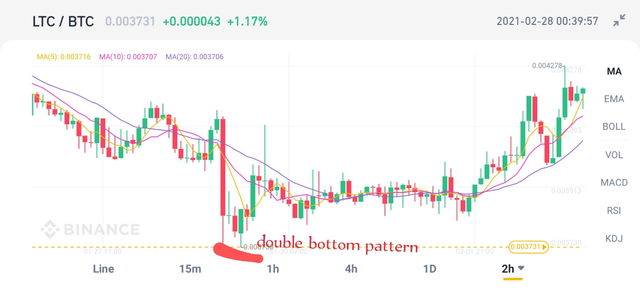
This is an opposite of the double top pattern. Here it is like a price pullback to the downtrend and later come around the same level. In this double bottom pattern, the price looks difficult to go down the more, which indicates indicates that the reverse mode from the bottom had been confirmed.
The below screenshot is an illustration of double bottom pattern, using my binance LTC/BTC market chart.
Importance of STOPLOSS
STOPLOSS is a type of order which you set to exit from a session to avoid more losses.
STOPLOSS helps to limit losses, so instead of increasing losses, it will be all to exit with small loss and move to the next asset.
The crypto market is not defined and it is not predictable, anything can happen at any time, this is because we don't know what happens at the back end. But with the help of technical study we can see the entry and exit points. So the same chart also provides us with STOPLOSS point. Here if price touched or crosses the STOPLOSS point, we should exit from the trade with a little loss to another asset, else the losses will increase.
Basically, should in case the market did not move according to chart, STOPLOSS will help to limit the losses.
How to find and set a STOPLOSS
STOPLOSS can be found based on the assets previous support history.
While investing on assets, we need to check the assets history and find previous support system that we can limit our losses.
Basically, there had to be 3 supports and 3 resistance, so we have to find 2 supports based on the assets history and according to that, we can go for a buy order and limit loss.
How to set a STOPLOSS
The below illustration is a screenshot of my binance Steem/BTC market chart

Conclusion
From this lecture, technical knowledge is very important in trading. With the aid of this basic technical knowledge I got from this teachings, I understood that good study of the market and charts are very important in asset investment. Then to also be on a save side, I need to set a STOPLOSS in other to limit losses.
@stream4u, this is my homework submission.
cc: @steemcurator01
cc: @steemcurator02

Subscribe:::Discord.
:::Whatsapp :::join trail
Hi @talktofaith
Thank you for joining Steemit Crypto Academy and participated in the Homework Task 3.
Your Homework task 3 verification has been done by @Stream4u.
Thank You.
@stream4u
Crypto Professors : Steemit Crypto Academy
Downvoting a post can decrease pending rewards and make it less visible. Common reasons:
Submit
@stream4u, alright thanks a lot.
Downvoting a post can decrease pending rewards and make it less visible. Common reasons:
Submit
My tweet
Downvoting a post can decrease pending rewards and make it less visible. Common reasons:
Submit
Congratulations!!!! You have been upvoted by @ngoenyi and I’m voting with the Steemalive Community Curator @steemalive account to support our community members. Keep on making great content and always stay active in the community to recieve further support
Downvoting a post can decrease pending rewards and make it less visible. Common reasons:
Submit