Greetings friends, I'm happy to enroll in this week's academy lecture by Professor @kouba01 and below is my take on the the following questions.

- Show your understanding of the SuperTrend as a trading indicator and how it is calculated?

The super trend tool is a volatility based indicator that helps in determining probable trend direction as well as possible entry and exit points using it's obvious buy and sell signals.
Hence, the Super Trend Indicator oscillates within the price chart in an up, down and sideways direction to authenticate and validate the current market trend.
Nevertheless, based on the style setting, the dominant market price creates an uptrend when the green phase of the STI stations at the downside of the price chart in a bull direction and contrarily a downtrend is prevalent when the red phase of the STI goes above the price chart in a bear direction and finally in during the period of market consolidation, the indicator tends to move in a mixed reaction of its red and green phase until a breakout point.
How to calculate the STI
The following are the procedures for calculating the STI.
Upper line (Red) = (HIGH + LOW) ÷ 2 + Multiplier x ATR
Down Line (Green) = (HIGH + LOW) ÷ 2 – Multiplier x ATR
Calculation of Supertrend UpLine (RedLine)
Upper line (Red) = (HIGH + LOW) ÷ 2 + Multiplier x ATR
Now let's use the Steem/USDT chart above in calculating the STI
High=0.4359
Low=0.4275
Multiplier=3
ATR period=10
Upper line= (0.4359 + 0.4275) ÷ 2 + 3 x 10
=0.8634 ÷ 2 + 30
=0.4317 +30
Upper line = 30.4317
Calculation of Supertrend DownLine (green)
Down Line (Green) = (HIGH + LOW) ÷ 2 – Multiplier x ATR
High = 90.47
Low = 85.46
multiplier=3
ATR period=10
let's also use the Luna/USDT chart above to calculate the STI**
Down Line (Green) = (HIGH + LOW) ÷ 2 – Multiplier x ATR
Down Line= (90.47 + 85.46) ÷ 2 - 3 x 10
Down Line=175.93 ÷ 2 - 30
Down Line= 87.965 - 30
Down Line= 57.98

- What are the main parameters of the Supertrend indicator and How to configure them and is it advisable to change its default settings? (Screenshot required)

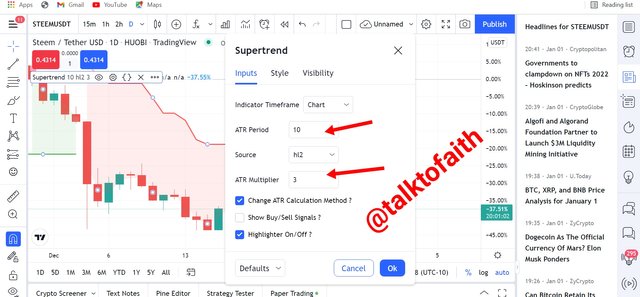
The main parameters of this indicator are the ratio and periods and hence, the STI has a default ratio of 3:10 where 3 represents the constant Multiplier and 10 represents the period in view although this can also be altered.
How to Configure The STI
For one to configure the STI you have to login through the setting icon of this indicator after setting it into the price chart and then click on the input tab which is the major configuration tab of this Indicator and hence you can alter it to your best knowledge as to suit your trade by changing either the ATR period which is 10 at the default or the ATR multiplier which is also 3 at the default.
My advice to the alteration of the default setting of the STI
Nevertheless the major parameters of this indicator can be altered but at the discretion of the trader and how professionally he can manipulate the Indicator to suit his trading strategy.

- Based on the use of the SuperTend indicator, how can one predict whether the trend will be bullish or bearish (screenshot required)

The super trend indicator has the potential of predicting the possible prevailing market conditions and most especially the major market phases that are normally traded which are the bullish and bearish phases of the market.
Nevertheless, the following observations are the measures through which a trader can predict whether the market will be bearish or bullish.
How to predict a bullish trend using the STI
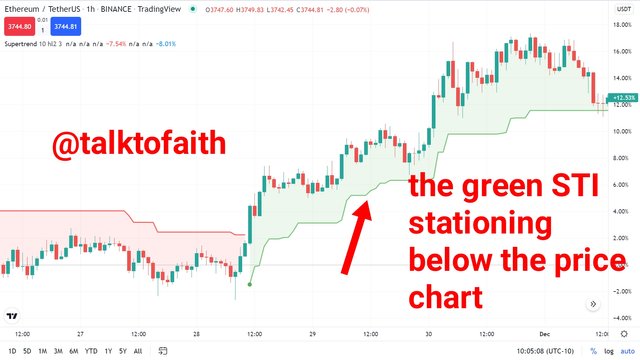
To predict a bullish trend using the STI, the green phase of the Super trend Indicator has to go below the price chart and then be in an upwards direction with little or no spot of the red phase of the indicator until the resistance point or market consolidation is reached.
Using the ETH/USDT price chart above, we can see how the green phase of the STI positions at the down side of the price chart in an upwards direction which is a confirmation of a bullish trend.
How to predict a bearish trend using the STI
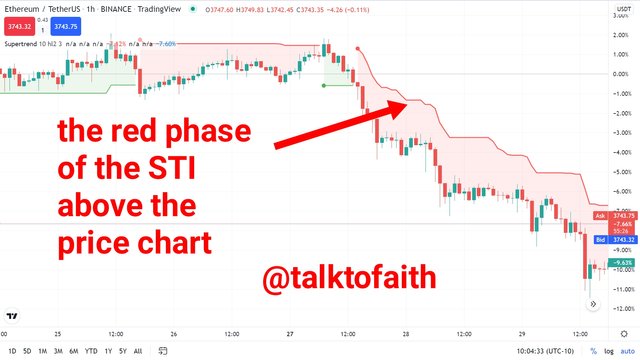
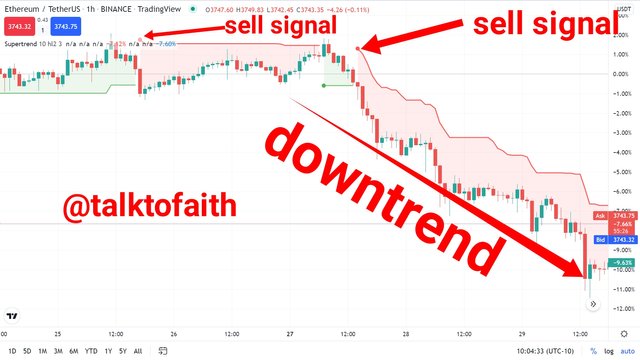
In a bearish trend, contrary to the bullish pattern, the red phase of the super trend Indicator has to stay above the price chart in a downward direction till a reversal or price consolidation period is reached.
The ETH/USDT chart above is a confirmation of a bearish trend. A close observation shows the red phase of the indicator at the upper side of the price chart in a downward position which is a bearish confirmation.

- Explain how the Supertrend indicator is also used to understand sell / buy signals, by analyzing its different movements.(screenshot required)

As earlier said in the previous answer above, there are specific movements that are spotted in this indicator which confirms a possible buy or sell signal and these are fully analyzed below.
Understanding buy signal using the STI
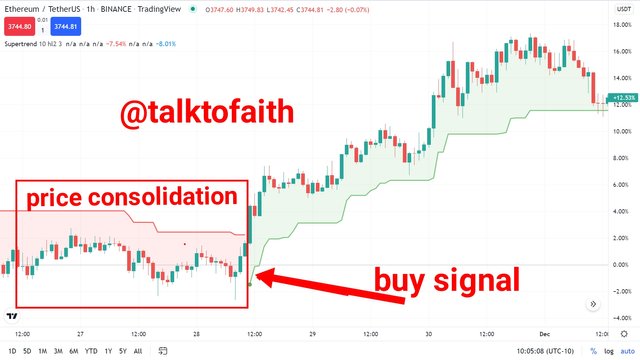
In a buy signal, the following observations are valid; first the green side of the STI has to go below the price chart and then position it self in an upwards direction and this could either be after a period of price consolidation at the lower end of the market or during a reversal period and hence, a buy signal is authenticated. Nevertheless this can be further explained using the price chart below.
From the ETH/USDT chart above, we can confirm the buy signal as the green phase of the STI pegs below the price chart in an upwards direction.
Understanding sell signal using the STI
In a sell signal, the red phase of the Indicator has to be above the price chart in a downwards direction probably after a reversal period or price consolidation at the upper side of the market and once this is confirmed, a sell signal is established.
The ETH/USDT chart above confirms a sell signal as the red phase of the STI stays above the chart in a downward position and this confirms a buy signal.

- How can we determine breakout points using Supertrend and Donchian Channel indicators? Explain this based on clear examples. (Screenshot required))

The combination of the STI with the Donchian Channel are good tools for trades as both of them are chart based indicators and as such they can be used in determining bullish and bearish breakout in the market after periods of price consolidation or probably during reversals. Nevertheless, the following observations can be used in determining breakout in the market structure using both Indicators.
A bullish breakout using the two indicators
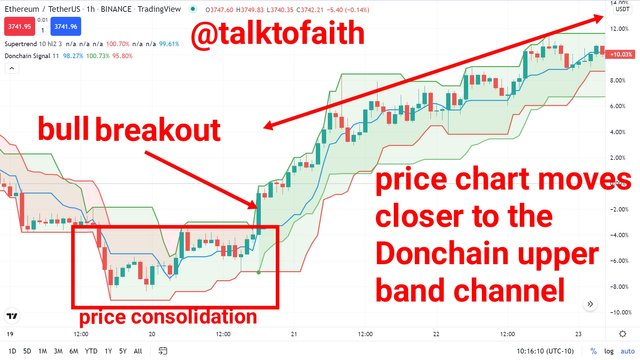
In a bullish breakout, the Price chart tends to take a strong push to the upper band of the Donchain Channel after a range market while the green STI stations below the price chart.
Using the ETH/USDT above we can confirm that after the price consolidation period, the Price chart took an aggressive move as it tends to pierce the upper band of Donchain Channel while the green STI stations below the price chart.
A bearish breakout using the two indicators
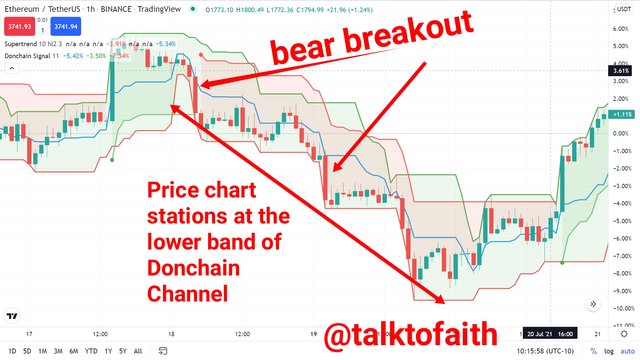
This normally comes after a reversal point or after market consolidation and as such, the price chart has to take a strong downwards pull to the lower band of the Donchain Channel while the redish phase of STI positions above the price chart
From the ETH/USDT chart above we can confirm the breakout as the chart made a strong downwards pull to the lower band of the Donchain Channel while the red phase of the STI positions at the upper side of the chart.

- Do you see the effectiveness of combining two SuperTrend indicators (fast and slow) in crypto trading? Explain this based on a clear example. (Screenshot required))

I do see a better reinforcement in the market trend if the STI is splitted into a fast and slow mood as to observe the possible trend line and this will be illustrated in a bullish and bearish market below using two hours time frame and (3, 10) (3, 200) setting of the STI.
In a bullish market
A combination of both moods (fast and slow) of the STI can help in maintaining trend in a bull market and for instance using 10 ATR period, with multiplier 3 and using 200 ATR period, with multiplier 3.
In this scenario, when the 200 period comes in contact with the 10 period of the ATR, the market creates a stronger bullish trend and when it opens in a sideways direction, the price becomes less volatile although there can be different reactions with response to the market action based on the time frame in use, but let's see this in the price chart below.
From the price chart above, we can confirm a strong bull continuation as the slow and fast STI comes in contact with each other.
In a bearish market
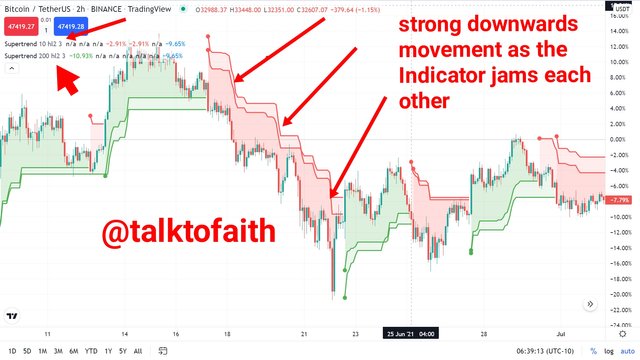
In a downtrend, the two settings of this indicator can also be used in confirming a real bear trend and this is authenticated as the slow STI comes in contact with the fast STI from a lower range and hence, a dis-compact of both of them reduces the intense of the bear
market volatility and this is also with respect to the time frame being traded with.
Using a two hours time frame, and the same setting used in the above bullish example, we can confirm a reinforcement of trend from the chart above as the slow STI comes in contact with the fast STI from its upper dimension and hence as it opens in a sideways position, a less market volatility is created.

- Is there a need to pair another indicator to make this indicator work better as a filter and help get rid of false signals? Use a graphic to support your answer. (screenshot required)

There will be a better and clearer trend confirmation if some other trading tools are added into the STI as no indicator has an absolute ability in being used alone.
Hence, we can see the need for the addition of more Indicator(s) to the STI in filtering false signals.
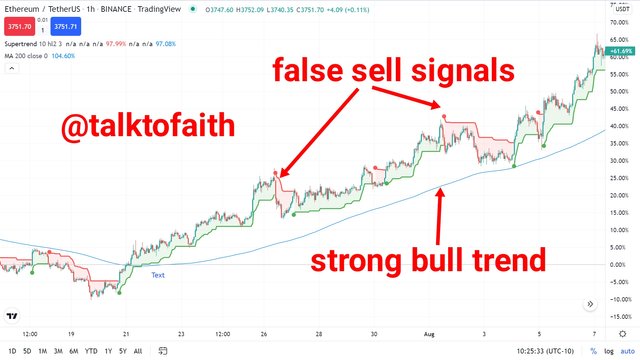
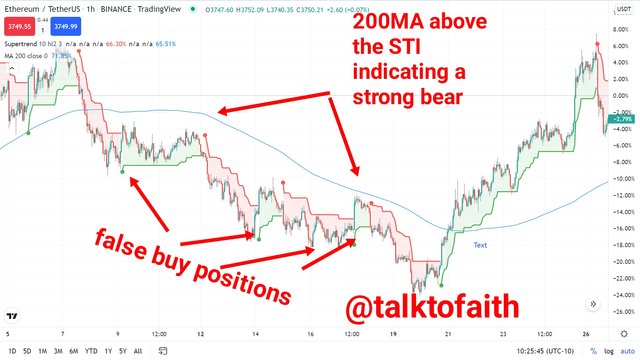
Nevertheless, for a better working of this indicator, I will add the 200MA to help in filtering out false signals both in the bull and bear trend.
Bullish trend
In a bull trend, the 200MA takes an upwards direction but below the STI which helps in confirming a real Bull movement as there are also intermittent spots where the red phase of the STI appears while on a bull trend but since the 200MA is still below the STI in a bullish direction, it has actually helped in keeping the buy or bull position to be traded in confidence and thereby filtering the false signal that was generated by the STI.
From the chart above we can confirm the theoretical claims as the 200MA moves along with the price chart in an upwards direction but below the STI and this helps the STI in working perfectly during a bull trend despite spots of sell indication while in the bullish movement.
Bearish trend
During a bearish movement, the 200MA positions above the STI in a downwards direction and hence there are also spots of buy signal which indicated by the STI but due to the position already taken by the 200MA, one has to continue in the sell position as this has helped in filtering out the false signal Indicated by the STI
Also from the chart above, we can also confirm the importance of adding an extra indicator to the STI like the 200MA as the 200MA moves alongside the STI but in a downwards motion while positioning above it and this has assisted in the perfect working of the STI in a bear trend as it has assisted in giving the confidence of continuing in the bear direction till a change in the positioning of the 200MA.

- List the advantages and disadvantages of the Supertrend indicator:

Advantages of the STI
As a chart based Indicator, the STI has less fault if used appropriately with a good time frame.
The STI can be used in confirming trends in either the bullish or bearish phase using it's red and green sides.
The STI can be used on any time frame but with good risk trade management.
It can be used by even a beginner as it is easier to understand using it's green phase as buy entry and red phase as sell entry
Disadvantages of STI
The STI can also generate false signals if used in a closer time frame.
The calculation of the STI does not have any tangible effect in determining future asset prices.
An alteration of the STI may cause a malfunctioning on the indicator if not properly managed.

- Conclusion:

The STI is a good volatility based Indicator that has a good trading feature as compared to so many other Indicators. For instance it signals and indicates points of buy and sell which most indicators can not do.
Although without fault as no indicator has the sole strength of being used alone but with the amalgamation of some other credible and compatible indicators which a trader is used to, can help in making a great deal of profit from the market
Finally my exposure on this Indicator has actually added to my knowledge of indicators and also my trading archive, thanks professor.
Cc: @kouba01
_1.png)
_1.png)
