
Hello Friends, today I'm enrolling into trading using the KCI as lectured by Professor @fredquantum. Thanks for patiently going through my work.

Creatively discuss Keltner Channels in your own words.

The Keltner Channel indicator was first an invention of Chester W. K. within the 1960s but this was later refurbished within 1980 by Raschke Linda.
Hence, this indicator is a price volatility indicator with three oscillators having an upper and lower band with the EMA at the middle which has an equidistant between the two oscillating lines.
This indicator can be used in identifying different volatility periods in the market, whether in the Bull, Bear or at consolidation phase.
For instance, during a downtrend, the Indicator normally positions downward and in an uptrend, it takes an upwards direction to confirm the prevailing market condition and finally during a period of price consolidation, it tries to show no possible true direction till after a breakout either to the Bull or to the Bear.


Setup Keltner Channels on a Crypto chart using any preferred charting platform. Explain its settings. (Screenshots required).
To set up this Indicator into the crypto chart, I will be using the Steem/USDT asset on the trading view interface as I also explain its settings.
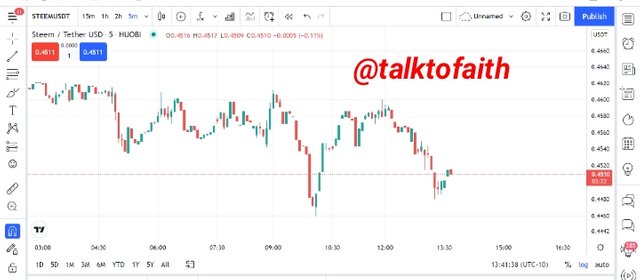
Source
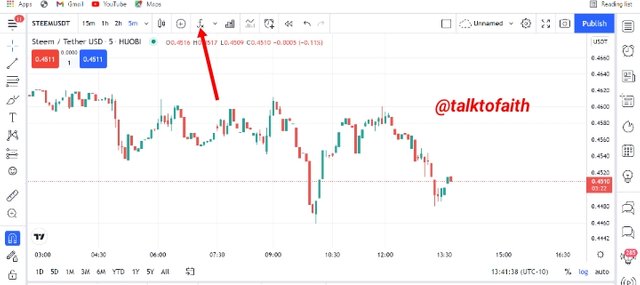
After logging into the trading view platform, next is to click on the indicator icon positioned at the top corner of the trading Interface.
Source
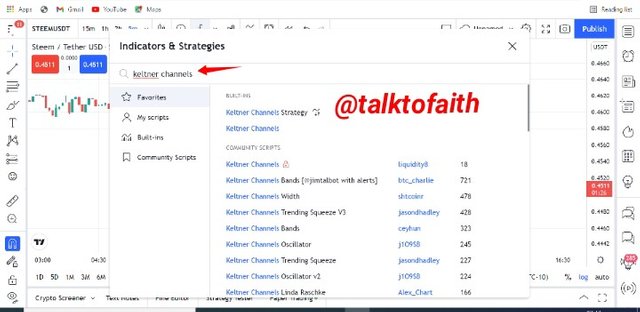
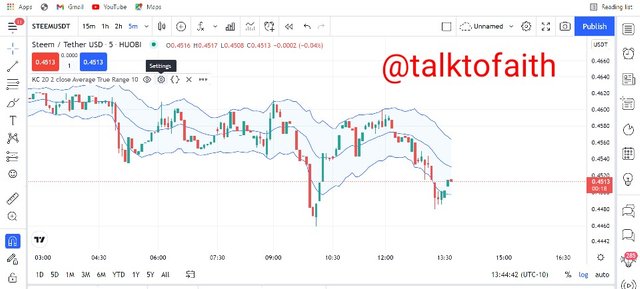
Next on the search box, type Keltner Channel and then click on it to get it inserted into the crypto chart and in this case I'm using Steem/USDT to illustrate this. Finally this is how to insert this indicator into any chart.
Source
Source
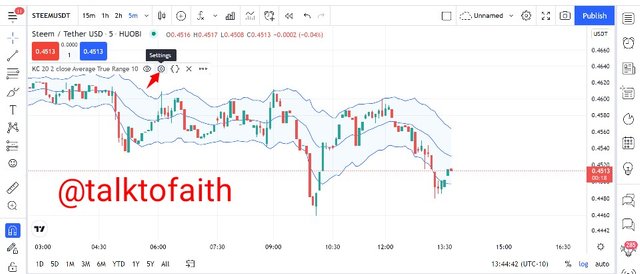
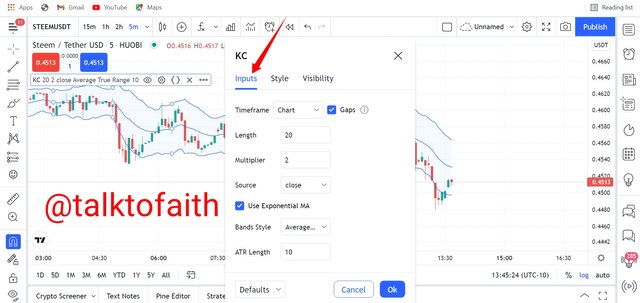
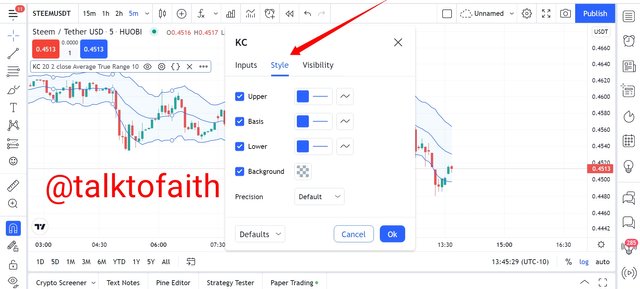
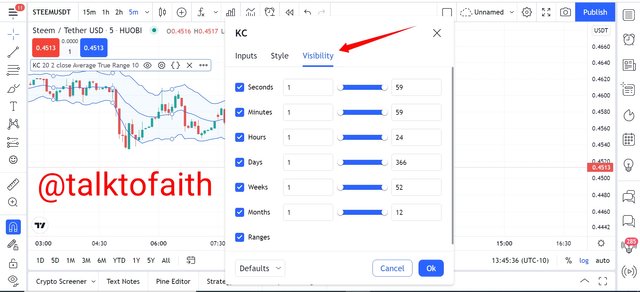
For the possible modification of this Indicator, one has to click on the setting icon where the Indicator name is specified and besides like other indicators, there are specifically three modifiable settings in the KCI which are: Input, Style and Visibility.
Source
Source
This is the first tab on the setting list of this indicator and it has a default period of 20, an ATR length of 10 and multiplier of 2 and this can be reset to suit a trader's strategy.
Source
This setting tab on the Keltner Channels contains the different band sizes and colors which can be altered or changed at owners discretion
Source
This tab on the Keltner Channel contains different time frames which run from 1 minute to 1 year and this doesn't really need any alteration.
Finally, the resetting of the default setup of this Indicator lies on the traders preference and discretion.

How are Keltner Channels calculated? Give an illustrative example.

The Keltner Channel can be expressed mathematically through the following ways
The upper band = EMA + (2 X ATR)
The lower band = EMA - (2 X ATR)
Middle line = EMA, which depends on any period in view.
Where:
EMA= Exponential Moving Average
ATR= Average True Range
2= The Constant Multiplier
Assuming that Luna/USDT has the following price reading:
EMA period= 21
ATR length = 10
Multiplier = 2
Here, the EMA is altered from its default setting to 21 periods and further to determine the true value of the Keltner Channel, we then calculate the upper and lower band using the values above.
The upper band = EMA + (2 X ATR)
upper band= (2 x 10) + 21
Upper band= 41
The lower band= EMA - (2 X ATR)
Lower band= 21 - (2 x 10)
Lower band= 1

What's your understanding of Trend confirmation with Keltner Channels in either trend? What does sideways market movement look like on the Keltner Channels? What should one look out for when combining 200MA with Keltner Channel?Combine a 200MA or any other indicator of choice to validate the trend. (Separate screenshots required)

I will be illustrating the procedures through which this Indicator could be used in confirming trends using the upper and lower band and also what to expect when combined with the 200MA.
Trend Confirmation in a Bull trend
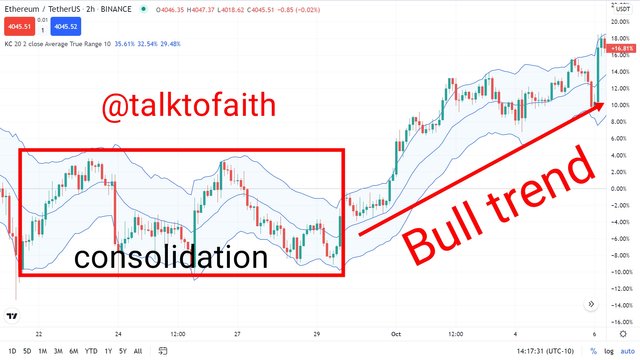
During a bull trend using this Indicator, the Indicator first takes a bull direction while the price candle chart oscillates within the upper band and the middle line. Nevertheless, the upper band serves as a resistance till the main consolidation point is attained during this period and we can understand this better using the screenshot below.
Source
Using the ETH/USDT chart above, we can observe the bull trend confirmation as the Price chart oscillates within the upper band and the middle line and as earlier said, having the upper band to serve as price resistance.
Trend Confirmation in a Bear market
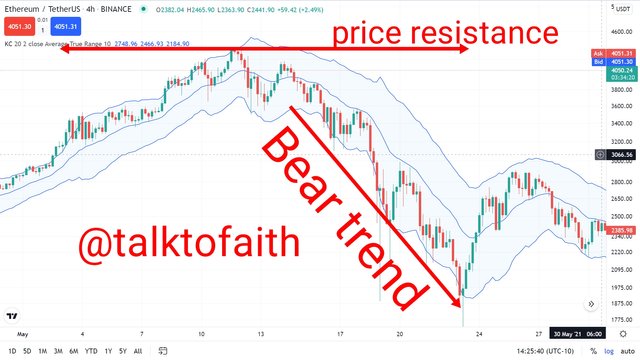
In a bear trend confirmation, this indicator normally takes a downward movement with the price chart oscillating within the middle line and the lower band and at this point, the lower band acts as a support to price and we can observe the trend better using the screenshot below.
Source
From the ETH/USDT asset above, we can observe the bear trend confirmation as the Keltner Channel takes a downward movement with the price chart oscillating at the middle of the middle line and the lower band.
What sideways market looks like on this indicator
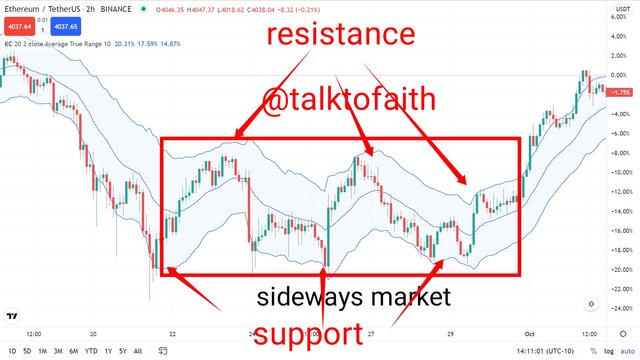
Sideways market which could also be translated to mean a range or price consolidation market. In this phase of the market, Keltner Channel indicator presents a more sideways movement with the upper band acting as resistance to price while the lower band acts as support to price until a breakout period either to the bull or to the bear which is contingent upon the phase of the market at the moment.
Source
Looking at the chart above, the Keltner Channel indicator maintains its position as price resistance and support with the use of its upper and lower band as it oscillates within the middle line in a sideways direction.
What to expect when this indicator is combined with the 200MA
We know that every Indicator is unique in it's way and such applies to his indicator although it is always advisable not to depend solely on an indicator while trading as the combination of two or three indicators could act as a reinforcement to trend determination of which we can observe certain things from findings below.
What to lookout for In a bull trend
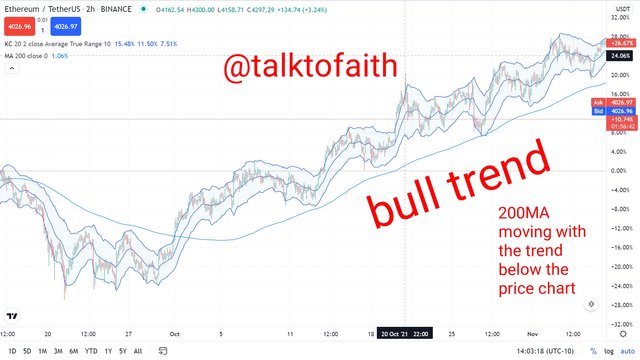
With the combination of the MA to this Indicator, it is expected that the MA should be in an upwards direction but below the Keltner indicator while in a Bull trend and I'll be illustrating this, using the chart below
Source
From the ETH/USDT chart above, we can observe that while the Keltner Channel was above the MA and the MA itself taking an upwards direction below the Keltner, a bull trend was confirmed and this is actually what we should expect in a bull trend.
What to lookout for In a Bear trend
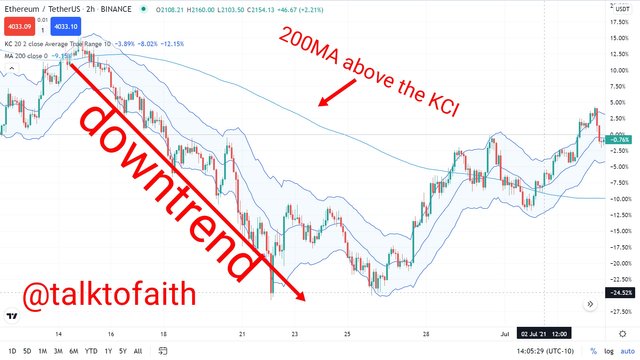
During a real bear trend, we need to confirm that the 200MA is at the top while the Keltner Channel is below it in a downwards direction. This is exactly what we should expect in a bear trend.
Source
Now using the ETH/USDT chart above, we can confirm the above claim as the 200MA moved in a downward direction but above the KCI.
What to lookout for In a sideways market
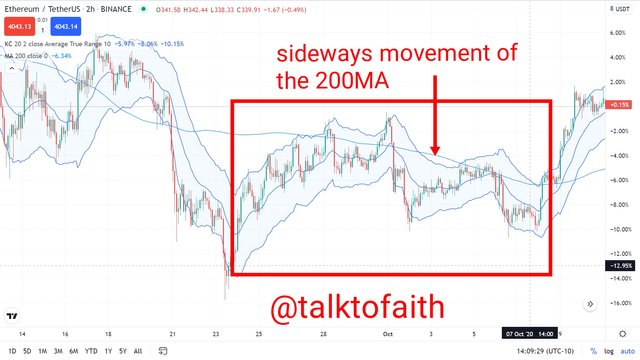
During periods of price consolidation or sideways movement, we need to consider the 200MA indicator to be in a sideways or range movement without possibly being at the top or at the bottom.
Source
From the chart above, we can observe the 200MA in a sideways motion without a clear indication of a probable trend.

5 What is Dynamic support and resistance? Show clear dynamic support and resistance with Keltner Channels on separate charts. (Screenshots required).

In every market, there are always different resistance and support levels that are seen and this helps in price control as to equilibrate the price mechanism against irregular price movements despite the volatile nature of the crypto market.
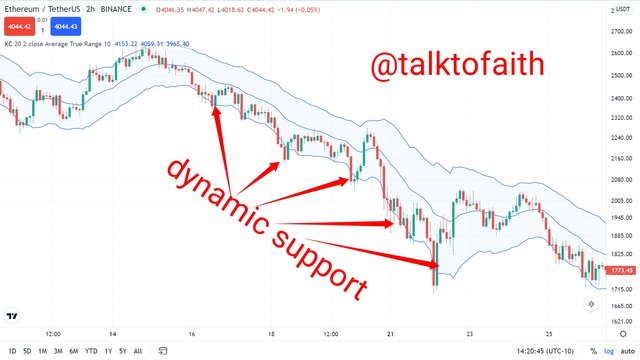
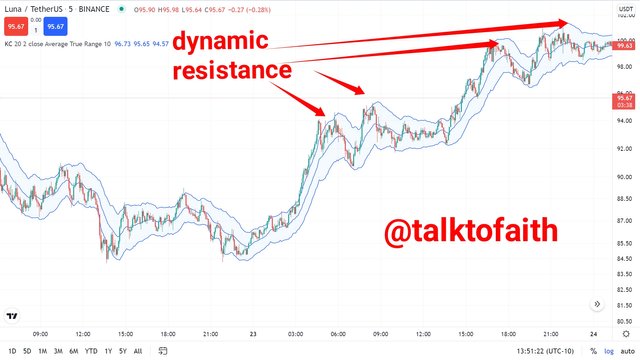
Therefore, using the Keltner Channel indicator, we can identify these dynamic support and resistance levels in the market and on the norms, the lower band of this Indicator acts as a support while the upper band acts as resistance dynamic and these scenarios can be fathomed out in a bull and a bear market and we can understand this better using the screenshots below.
Dynamic support using the KCI in a downtrend
Source
From the screenshot above, we can observe the dynamic support periods using this ETH/USDT market scenario where the lower band acts as support to Ethereum market.
Dynamic resistance using the KCI in a downtrend
Source
Also from the ETH/USDT screenshot above, we can observe the different resistance periods as this market takes a bull trend and hence, the upper band of this indicator acts as dynamic resistance.

6 What's your understanding of price breakouts in the Crypto ecosystem? Discuss breakouts with Keltner Channels towards different directions. (Screenshots required).

Price breakout In crypto trading occurs normally after consolidation period and hence price could either break to the bull or to the bear to confirm a real Bull or Bear trend. Nevertheless, this Indicator could be used in confirming these breaks and during a bull confirmation, the price chart normally breaks above the upper band of this Indicator after consolidation period and then closes before taking the bull trend and during a period of bear breakout, the price chart breaks below the lower band of the Keltner indicator then closes before taking a true bear trend.
The KCI In a Bullish Breakout
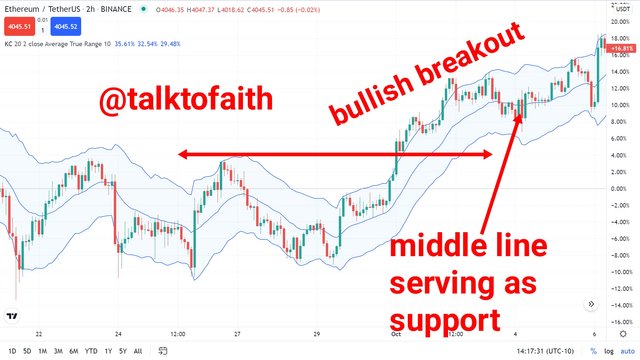
In a bull breakout, the price chart normally breaks the upper band of the KCI while the middle line acts as support to the current trend and hence price closes above the previous upper band before continuing.
Source
From the ETH/USDT usdt chart above we can observe the bull breakout as the price chart breaks the previous upper band of the Indicator and closes above it before continuing while the middle line acts as support to it.
The KCI in a Bearish Breakout
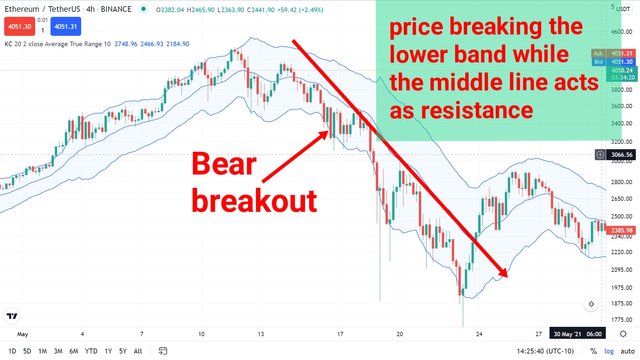
In a period of market breakout after price consolidation, the price chart breaks the previous lower band and hence closes below it before taking to a downtrend while the middle line acts as price resistance to the trend.
Source
From the screenshot above, we can observe the breakout as price breaks below the previous lower band and hence closes before taking to the bear while the middle line serves as support.

7 What are the rules for trading breakouts with Keltner Channels? And show valid charts that work in line with the rules. (Screenshot required).

The trading rules for trading breakouts using the KCI can be elucidated below using a Bull and a Bear trend.
Trading rules for a bullish breakout
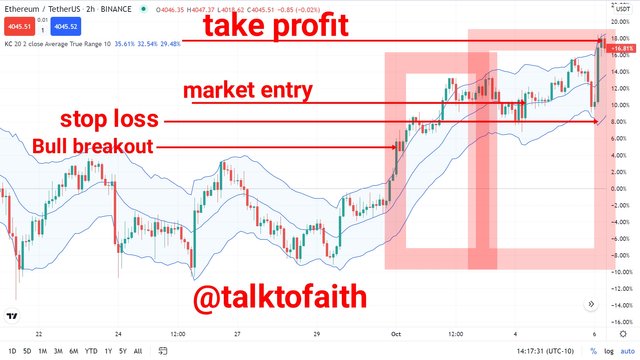
First, after a reversal or range period, the price has to break and close above the previous upper band of the KCI.
Next, the price chart has to make a retest of the previous high period while moving towards the middle line which acts as a support dynamics for the trend.
Next is to wait for the formation of a good and very strong bullish candle, then a market entry couple be made.
Finally for good risk management, the take profit and stop loss level should be set at the ratio 1:1 while the stop loss level should be set a bit lower the middle line after the entry point while the take profit should come at the upper band above the entry point.
Let's consider the screenshot below, to back up the above claim.
Source
Trading rules for a bearish breakout
The following needs to be observed for one to trade successfully in a Bearish breakout.
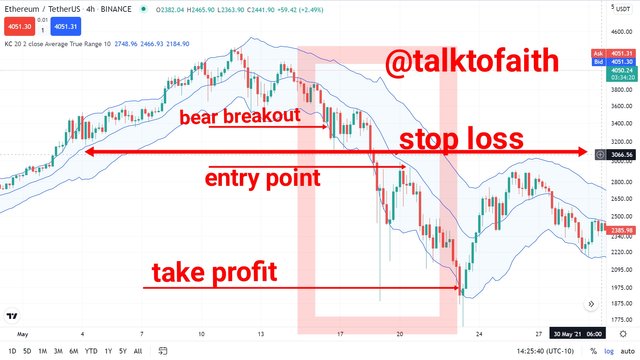
First the market must be in a bear reversal or at low price consolidation and hence the price chart breaks the lower band of the KCI and closes to form a support to the price chart at that point.
Next, the price chart has to retest the previous breakout chart by moving towards the middle line which serves as price resistance.
Once the above condition holds, we then open a sell position after the formation of a strong bearish candle.
Finally, a good risk reward ratio has to be set on at least 1:1 and finally proper take profit and stop loss levels should be set as well, but the entry point should be set close to the middle line above the sale entry point and the take profit can be set at the traders discretion but below the sale entry point.
We can observe the above theory in the screenshot below.
Source

8 Compare and Contrast Keltner Channels with Bollinger Bands. State distinctive differences.

The dissimilarities and similarities of the two indicators can be explained below.
Similarities in these indicators
Both Indicators are chart based indicators in the sense that they are inseparable from the price chart like some other indicators.
Dissimilarities between these indicators
In the Bollinger band for instance, an uptrend is confirmed when the bands tends to close and on the other hand, a down trend is confirmed at the opening of the bands while using the KCI, a possible trend is confirmed at the current slide of the Indicator either to the bull or to the bear.
The KCI is derived using the values of EMA, ATR, and the constant Multiplier, while the Bollinger band uses the standard deviation in determining its real value.

Place at least 4 trades (2 for sell position and 2 for buy position) using breakouts with Keltner Channels with proper trade management. Note: Use a Demo account for the purpose and it must be recent trade. (Screenshots required).

Buy positions using this Indicator
In this regard, I will be placing two bull market entries using VPAD/USDT and LINK/USDT while using proper risk trade management.
LINK/USDT
_1.png)
Trade history

VPAD/USDT
_1.png)
Trade history

Sell position using this Indicator
I will be placing a sell trade using Luna/USDT and also using MANA/USDT while maintaining proper risk trade management.
MANA/USDT
_1.png)
Trade history

LUNA/USDT
_1.png)
Trade history


10 What are the advantages and disadvantages of Keltner Channels?

Advantages of the KCI
This indicator is easy to use and also it is easy to comprehend and this relates to the fact that during a downward trend, the KCI takes a bear position and on the other hand, in a bull trend, this Indicator takes an upwards direction.
The KCI can help in confirming possible market trends and this is one of the major things that is sought for in every Indicator.
It can also be used in confirming real breakout after price consolidations whether to the Bull or Bear trend.
Disadvantages of the KCI
Since there is the need to use more than one indicator while trading, it is also paramount in adding more indicators to this indicator for trend reinforcement against entering or exiting the market at the wrong time.
The estimated value of the KCI has no future effect on price meaning that the current value can not be used in predicting the possible future market price.
The KCI can exhibit late price signals and hence should not be solely depended on while on trade.


The KCI as a chart base indicator is actually a good indicator to trade with and from my observation, the default setting of this Indicator is working perfectly well and improper alteration of its default settings may lead to irregularities in regards to dictating possible trends.
It is also good to add more indicators to the KCI while trading as to assist in reinforcing possible trend confirmation against trading in the wrong side of the market.
Finally my knowledge of this indicator has boosted my knowledge and working of indicators and as such will be added to my trading archive.
Thanks to Professor @fredquantum for such an exposure.
Cc: @fredquantum