
Question (1)
What do you mean by trading? Explain your understanding in your own words.

Trading is the simplest means of the buying and selling of assets, security, or commodity. For the financial market, trading is only seen as the buying and selling of assets and securities, these assets and securities are traded to realize profits when their value increases. The values of these assets and securities in turn will tend to increase or decrease based on the supply and demand that is present in the market of an asset or security.
Trading these assets or securities can only be done on exchanges, brokers, and trading platforms. These platforms provide liquidity to assets and securities which are to be traded by traders by just clicking the buy and sell option. These Trading Platforms also provide Technical analytic tools, Trading courses, and other helpful tools to enable the trader to carry out a comprehensive analysis on the trades which they are about to execute, although charges are placed on each successful trade by the platforms. Some of the platforms include Binance exchange, Huobi exchange, FXTM, and FTM.
Trading is not a simple activity because a lot of people have delved into it with the hope of making quick money without having any knowledge before they engaged with it, this is why every trader needs to have a level of high professionalism before having to engage with trading activity. Becoming a professional trader would require an individual to have a clear understanding of how the financial market operates by trying to acquire data based on the internal and external factors that affect the financial market.
To understand these factors that affect the financial market the trader has to perform a credible analysis which should include the Fundamental, Technical, and Sentimental Analysis.
Fundamental analysis is the macroeconomic factors that affect the financial market, which include the spending bill of a nation, the listing of a coin on a popular exchange platform, the merger of two popular companies, and the delisting of a coin from an exchange. Traders who use fundamental analysis, also consider the market capitalization of the asset and the liquidated supply of the asset. Most traders who engage with the fundamental analysis are mostly long-term traders because the data that is acquired from them can have a long-lasting effect on the value of the asset.
Technical analysis is the process of using historical price data with the help of technical analysis tools and strategies to predict the potential price movement of an asset. Traders who engage with this form of analysis are mostly short-term traders because they make use of the quick swings in price action to make profits. These traders make use of this type of analytical procedure because they believe that the financial market is controlled by the antecedent price data.
Sentimental analysis is a type of analysis hugely based on the trending news that is circulating on the internet. Traders are always in the Fear of Missing out (FOMO) because they want to realize the best profit. The world is always evolving and we are currently in an age where anyone can receive news on anything through social media platforms. Celebrities or influencers are one of the major driving forces for this type of analysis because traders tend to buy assets that they must have heard of by listening to their favorite influence. Investors are also controlled by two major feelings which are Greed and Fear. When the market is in extreme greed traders would want to take out their profits because they are in fear of the market crashing while at the same time another investor would want to hold onto the asset due to greed and might eventually fall victim to a market crash. A trader who tends to understand the market sentiments are hugely dependent on the fundamental factors that affect the market too.

Question (2)
What are the strong and weak hands of the market? Be graphic and provide a complete explanation.

The Market is constantly rising and falling and most times some traders fall victim to a market crash or its decrease in value, the truth about this phenomenon is that the market is controlled by two parties one known as the Stong's hands and the other Weak hands.
Stong Hands
The Stong's hands are a party of large-scale investors, they include Banks and Financial Corporations. These Big Players Tend to control them or manipulate the market by making the supply in the market be eliminated thereby increasing the demand of the asset and in turn driving the increase of the asset's price or value.
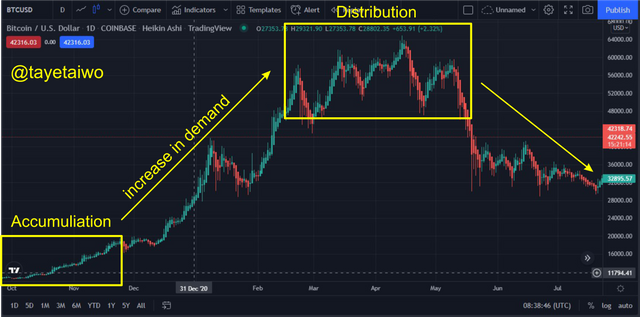
The above image clearly illustrates how the big players manipulate the market. From the accumulation stage, the big players would gradually start accumulating the asset, which will slowly create an increase in demand, by the time the value of the assets has started to increase, they would then start injecting large amounts, this will then get the attention of the retail investors who will then try to FOMO in when the price of the asset has already increased thereby increasing the price of the asset further. At the distribution stage, the Big players will then start selling their assets in profit, and as a result that the value of the asset gets liquidated. The retail investors who bought at a hiked price will tend to exit the market in loss or even further lose their investments in the processing of holding on to the asset.
Weak Hands
These are also known as retail investors, they are those investors or traders who operate with limited or low capital. These types of traders or investors make up the majority of the financial market, and they are always prone to the traps set by the big players or large-scale investors. The weak hands or traders tend to enter the market when the price of the asset has already experienced an increase in price due to fear of missing out (FOMO), they then tend to be at a loss when the big players dump the asset. This becomes a repeated cycle that runs through the financial market.

Question (3)
What do you think is the best idea: to think like the herd or like a professional?

As I discussed previously on sentiment analysis, some traders tend to make their analysis based on the news that they have acquired from their favorite influencer or mentor although sometimes it is deemed to be a bad way for analyzing because some of the influencers release their news based on paid sponsorship or selfish gains because they might have already had the asset long before they begin to hype the asset to their subscribers.
Following the herd is very bad for making investments because the hyping of these assets tends to cause spikes in the financial market which will then dump on late investors and in other cases the asset might be a rug pull. Recently some investors fell victim to a rug pull after investing in an asset that was hyped by the popular Influencer Kimkardasian and Floyd Mayweather, currently, these investors are looking for a way to get their money back by suing these influencers.
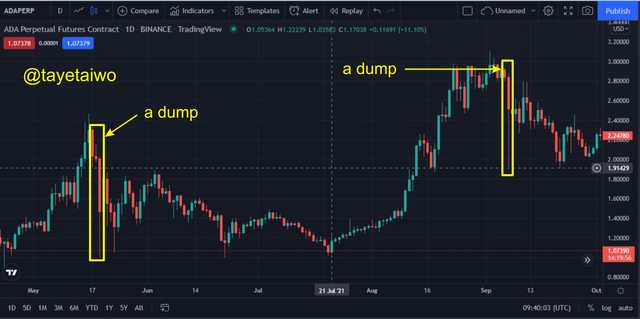
Taking a look at the image above shows periods in the market where the price of the asset was hugely dumped by investors shortly after a major increase in the price of the asset. This is as a result of large scale investors selling the asset they were holding because the retail investors have been able to drive the price up due to a current hype of the asset by influencers, thereby resulting in a huge loss for these retail investors who must have bought the asset due to hype by influencers.
To think like a Pro means to be grounded in the knowledge of Technical and Fundamental analysis, these types of traders would know when to make an entry or an exit in the market due to being able to predict the market based on historical price data with the aid of technical analysis tools.

Question (4)
Demonstrate your understanding of trend trading. (Use screenshots of cryptocurrency charts.)

The trend is the direction that the price action of an asset is moving based on the demand and supply affecting the value of the asset. Every trader would want to identify the current trend that is dominant in the market and profitably take advantage of it.
Different ways can be used to identify a market trend, these include Candlestick patterns, Market Structure, and Technical analytic tools. For this task, my focus will be on the Elliot wave Theory.
The Elliot Wave theory was developed by Ralph Nelson Elliott, he believed that the market was controlled by the sentiment and psychology of traders which in turn form repetitive price patterns which can be identified on the trading charts. The Elliot wave patterns are subbed into impulsive waves and correction waves.
Impulsive waves could be either a bearish or Bullish trend but what distinguishes it from a corrective wave is that it is the current dominant trend in the market while a corrective wave is a reversal or a retracement in the opposite direction of the impulsive wave, the emergence of this wave can be used as an exit strategy for trader.
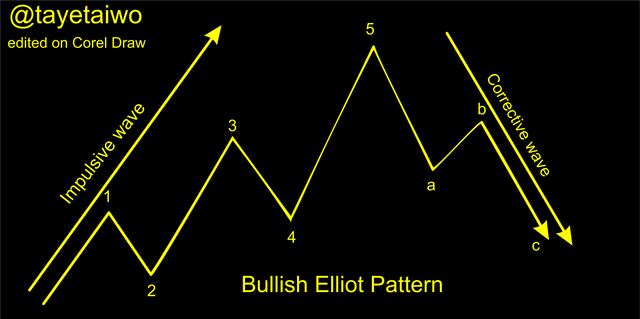
The Impulsive wave is made up of 5 moves, the first, third, and fifth waves follow the trend pattern while the second and fourth waves are short retracements.
The following are factors to consider when identifying an Elliot wave pattern;
- The retracements that occur at the second and fourth waves should not retrace back to the beginning of the previous impulse of the first and third waves.
- The third wave peak should be higher than that of the first, also the fifth wave peak should be higher than that of the third wave.
- The Third wave should have the longest period on the chart because this is the period that the asset begins to get noticed by retail investors and the hype starts to grow.
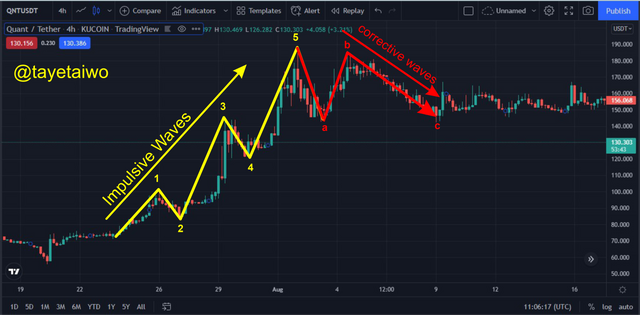
Corrective wave is the period that the underlying asset begins to lose momentum. The corrective wave emerges after the fifth wave. At this period traders begin to lose or gain credible interest in the asset, this signals a reversal in the opposite direction. Most traders are on the lookout for this retracement because it is used for exit in a trade. This cycle of wave emergence is a neverending movement that would always reoccur in the market and with this strategy traders can take advantage of an occurring trend.

Question (5)
Show how to identify the first and last impulse waves in a trend, plus explain the importance of this. (Use screenshots of cryptocurrency charts)
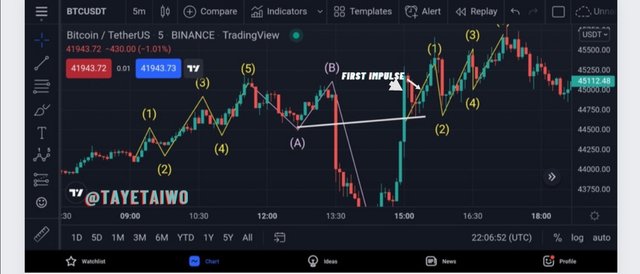
The first impulse wave is usually formed just after the complete formation of the correction waves A, B, and C. This wave serves as the beginning of a new trend just after the breakout on the resistance provided by wave A of the correction wave.
A trader who wants to make a trade using the Elliot pattern will have to wait for the formation of the first impulse wave before taking a position to confirm the direction of the new trend.

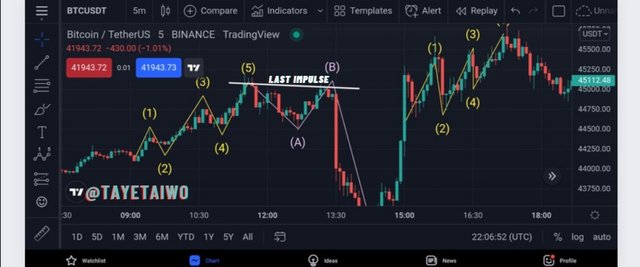
In other to identify the last impulse, we will have to revisit the Elliot wave pattern where will we have to identify the Impulse waves from 1 to 5 with the 5th one being the last one for a correct Elliot wave pattern formation. After the proper identification of the 5th impulse wave, we observe the formation of waves A, B, and C which is the correction waves. On identifying the correction wave, a trader is expected to close all open positions in wait of a possible reversal due to the activities of the strong hands who are currently closing their positions.
- Importance
The first impulse serves to aid traders in early trend identification thereby allowing them to buy or sell early in other to make maximum profit by the time the strong hands are already closing their positions.
The last impulse on the other hand aids traders in identifying possible trend reversal which occurs as a result of strong hands closing their positions. This information in turn signals traders to close their open positions and wait for the emergency of a new trend.

Question (6)
Show how to identify a good point to set a buy and sell order. (Use screenshots of cryptocurrency charts)
We have already looked at how to identify trends and trend reversals using the Eliot wave, here we will be looking at how to identify entry points of buy and sell orders.
After the successful identification of the Eliot waves which comprises the Impulse waves and correction waves, we will wait to observe the movement of the price and as soon as it breaks and closes above the resistance at corrective wave A, we will take a buy position.
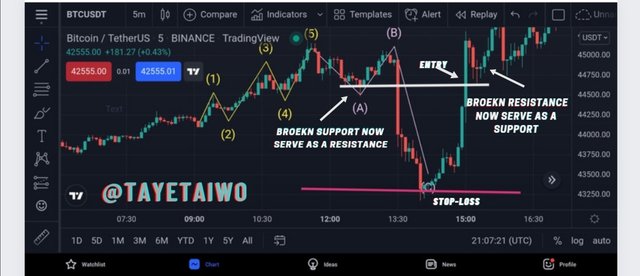
The Stop-loss is set to be slightly below correction wave C and the Target set in consideration of the stop-loss with a risk to reward ratio of 1:1, 1:2, or 1:3 or preferably at the resistance at corrective wave B.
After the identification of impulse waves, we observe the formation of correction A, B, and C waves. Then we will take a sell position once we observe the price to break below the support at correction wave A.
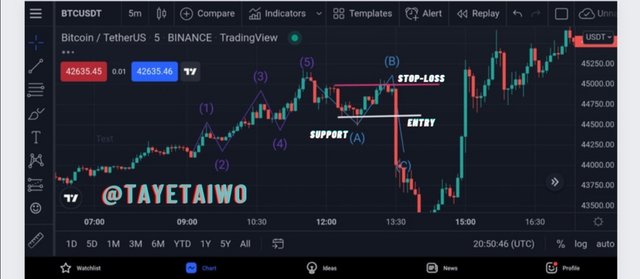
The stop-loss is set to be slightly above the resistance at wave B and the target set with regards to the stop-loss in a risk to reward ratio of 1:1, 1:2, or 1:3 as the case may be.

Question (7)
Explain the relationship of Elliott wave theory to the method explained. Be graphic when explaining.
We have previously discussed how the market is manipulated by strong hands and how these manipulations negatively affect weak hands. We have also seen how the identify the trend direction using the Elliot wave theory and also how to make a good buy and sell entry using the Elliot waves strategy.
Now, we will be looking into the relationship between the Elliot waves and the manipulation of the market by strong hands.
This relationship is seen at both ends of the Elliot wave pattern. That is, before the formation of the first impulse and after the formation of the last impulse.
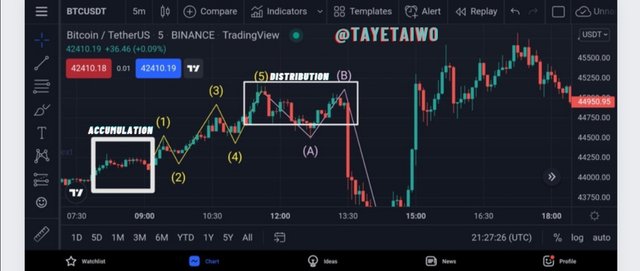
From the above screenshot, it is obvious that the accumulation phase occurs before the breakout and formation of the first impulse wave of the Elliot wave theory.
During price breakout after accumulation, the retail traders enter the market with high hopes of a continuous uptrend thus adding more buying pressure to the market which helps to drive the price even higher for the whales who bought at a much lower price.
Not much after the up movement, the strong hands start to close their positions thereby causing a reversal of price and this point of reversal is what we regard as the correction waves.
Therefore, a trader with a good knowledge of the Elliot wave theory tends to understand the manipulation of the market by whales and therefore knows how to play their game.

Conclusion
Trading is an activity that is as old as time which involves the buying and selling of goods assets in other to make returns.
In modern times, trading has been made much easier as it doesn't demand physical interaction but a trader can execute trades using trading devices at his or her comfort.
From this lecture, we have seen how the strong hands prey on the weak hands by manipulating the market and liquidating the positions of the weak hands. We have also understood that the best way to avoid these manipulations is to think like a pro and thanks to the Elliot wave theory which can help users to spot the activities of these whales in the market thereby helping us to play their games.
Thanks to professor @nane15 for the informative lecture.