Good morning crypto students, trust you are all good.
This week was one of the most fantastic week for me, the bull season is fast approaching and everything looks fine, I attended the lecture of professor @yousafharoonkhan and he fully discussed about Tradingview, one of the best cryptocurrency platform. Without wasting your time I will jump to the task.
Define the TradingView site and how to register an account on TradingView? What are the different registration plans (screenshot required)
Tradingview is an online platform that offers trading analysis, with a wide range of tools, features, and services that benefit all traders, whether they trade stocks, forex, cryptocurrency, or anything else. In essence, the platform is not limited to a single type of trade, but we can find charts, information, and features related to any type of asset now available.
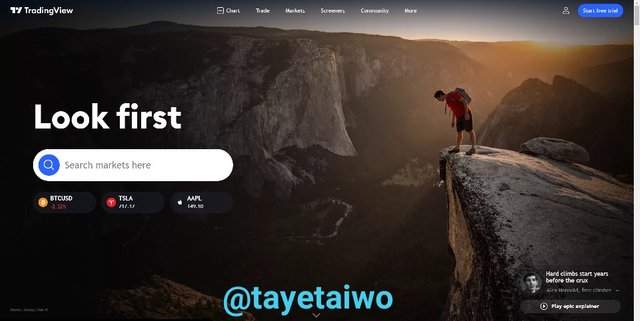
Tradingview is one of the top free-market online trading websites available, and it can be accessed from any device either a mobile phone or desktops and so on. The platform, which was launched in September 2011, has assisted millions of traders in making profitable trading decisions thanks to its unique features and tools which has aided the traders to perform technical and fundamental analysis
Furthermore, the site offers a service that allows us to research cryptocurrencies, currencies, stocks, indexes, bonds, and futures on the market. It's straightforward for newcomers to get started with cryptocurrency because the platform is simple to use and the complexity is kept to a minimum. For seasoned traders, it's also a feature-rich site.
How to create an account on TradingView
Creating an account on Tradingview is simple, just follow this simple steps.
Step 1: In your browser, type in Tradingview or go to https://www.tradingview.com/.
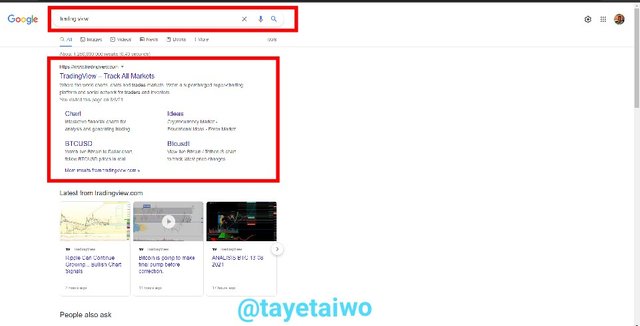
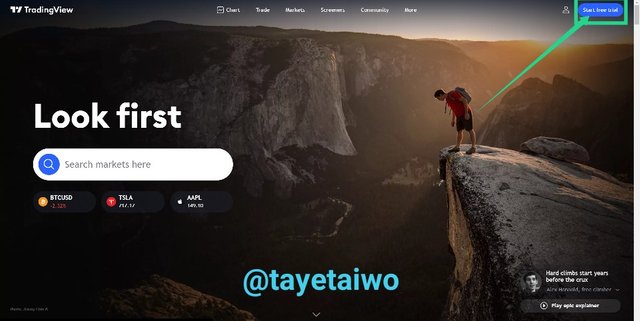
Step 2: Then, in the top right corner of the screen, click on Start Free Trial.
Step 3: The Free Basic Plan, The Pro Plan, The Pro+ Plan, and The Premium Plan will all appear on a new page, with different plans for varying levels of objectives.
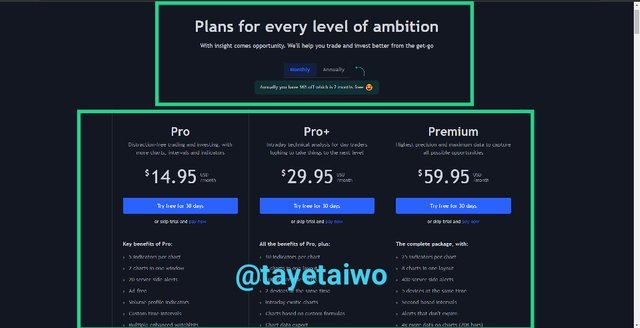
If you are new to Crypto it advisable to go for the Free Basic plan, since it's free, just scroll down and click on Try Free Basic
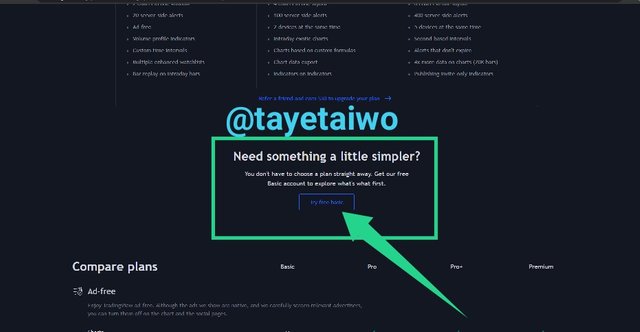
Step 4: There are various options for creating an account, including Google, Facebook, Twitter, Yahoo, Apple, LinkedIn, and Email. I like Email, so I go with that option.
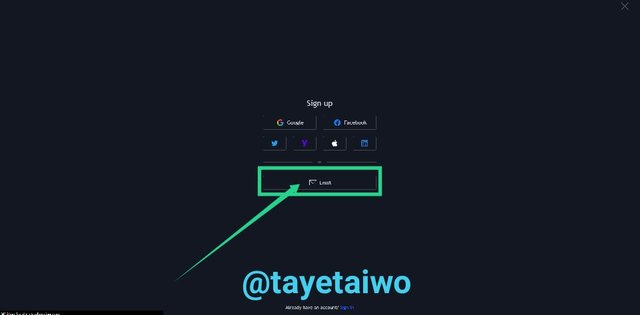
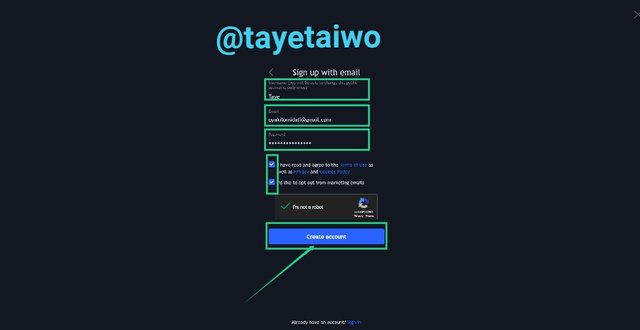
Step 5: I used my desired username and email address, as well as a secure password. I accept the rules and opt-out of receiving promotional activities by clicking on the tiny box. I clicked "Create account" after confirming that "I'm not a robot."
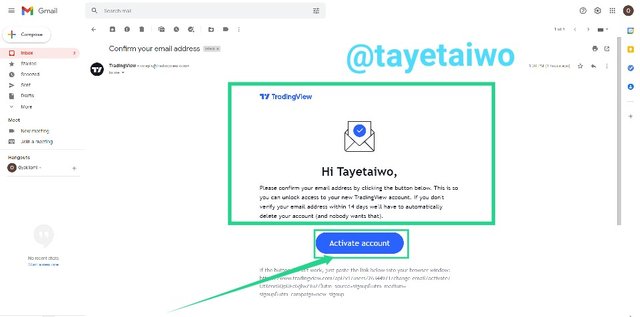
Step 6: A confirmation link was sent to my email address, so I have to login to my email account and check my inbox for the verification mail. I click on the link below is the screenshot

Step 7: Now I entered my First and last name, this will be my name on Tradingview and click on Continue
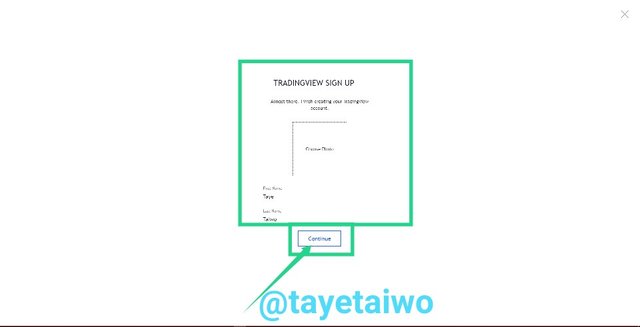
It all done, I have created a new Free Basic Plan Tradingview account successfully
The Different Registration plans available on TradingView
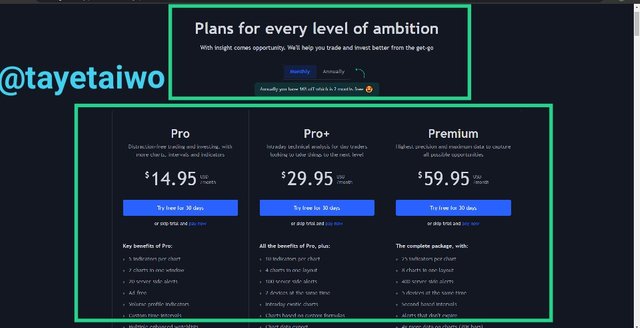
There are four different registration plans on Tradingview, I will discuss about it one after another.
The Free Basic Plan
This plan is designed for novices to the site, mainly for individuals who are just getting started trading and/or do not have the financial means to pay for registration. Registering and using the site for free is the most cost-effective alternative. When compared to paid plans, this one has a number of drawbacks, one of which is that the user can only add a maximum of three indicators to the chart at any given moment.
The Pro Plan
The Pro Plan is unique in that it requires payment to utilize; it costs $14.95 per month and is mostly used by individuals with some experience. You can add a maximum of 5 indicators on a chart at once, position two charts in the window, modify the time period, add multiple watchlists, and this plan doesn't show any advertisements. This plans includes a bunch of additional, amazing features that is very much better than The Free Basic Plan.
The Pro+ Plan
This plan is aimed for slightly more experienced traders and costs $29.95 per month. The ability to apply 10 indicators to a chart, configure up to 100 price alerts, and use charts based on unique formulas are just a few of the perks and capabilities included in this package. Users can also export chart data and put indicators on indicators; none of these features are available on the Free or Pro plans. This plan has a lot more features than the Pro plan.
The Premium Plan
The Premium Plan is designed for the most experienced traders or individuals; it costs $59.95 a month and is well worth it. It has a number of advantages and features, including the ability to add up to 25 Indicators to a chart, a never-expiring price alerts, and the ability to use the account on up to five devices at once. Traders with a premium membership can additionally publish indicators that are exclusively available to invitees.
So that's a rundown of all the Tradingview plans and their associated benefits.

Explain the different features of tradingView and what is your favorite feature and why? (Screenshot required)
TradingView has a lot of features and functionalities that distinguish it as a one-of-a-kind and vital trading analysis tool for traders in today's market. I'll give you some of the features and explain their functions below
Chart
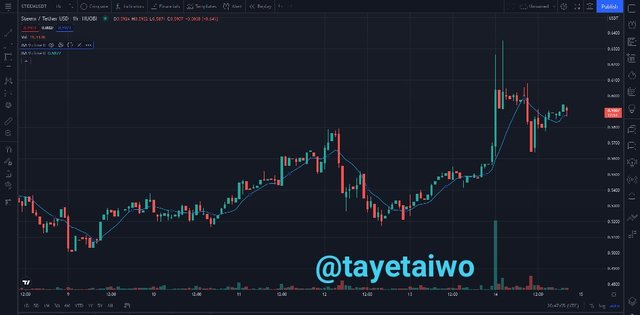
This is an amazing feature of the Tradingview platform, to access this feature, at the homepage locate Chart at the upper side of the page.
You can look at the graphs of any asset pair and search for them. Numerous visual sketching tools, as well as the ability to draw and write on the charts, may be found on the chart's left side. At the top of the page, you can change the time period of the charts, as well as select and apply various indicators to the chart. All of these tools are highly useful to traders since they allow them to track price patterns and make the best trading decisions possible.
Trade
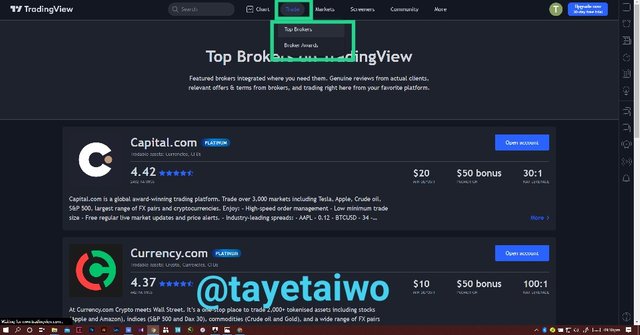
Beside the Chart feature you will see Trade, navigate and click on it.
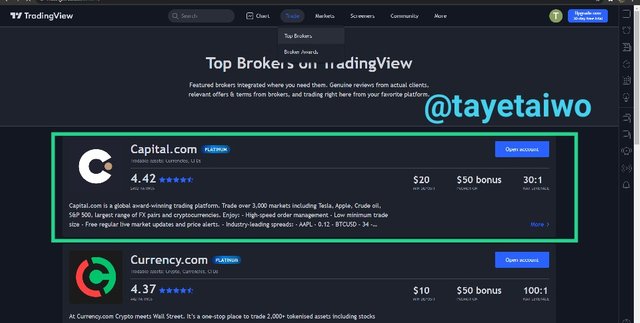
There are two sub-sections in this section of the Trade. Which are The Best Broker and The Brokers Award
I'll try to discuss this two sub-section briefly
The Best Brokers this includes a ranking of the best brokers based on their rates. With a 4.42 rating, Capital.com now has the top ranking. You can also learn about the brokers and how they operates.
The Brokers Awards: this section contains a list of previous winners of the Brokers Awards; you can also decided to vote for your favorite brokers to win the next Brokers Award.
Markets
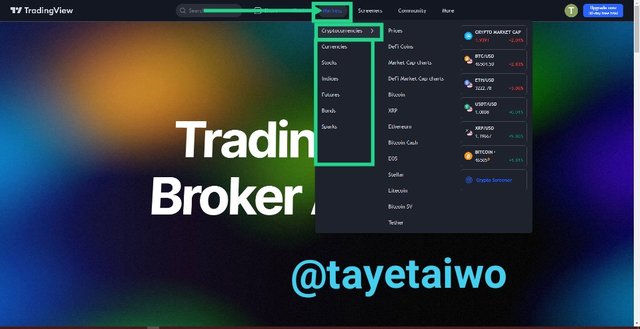
This is located beside the Trade section. In this you can explore it has it contain numerous sub-sections, including cryptocurrencies, currencies, stocks, indices, futures, bonds, and sparks, which you can study to assist you make better trading decisions.
Screeners
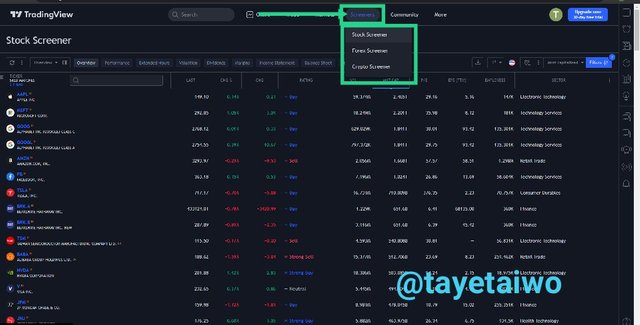
This is another section on the TradingView platform that can be found next to Market; simply go to the top of the page and click on it. Stock screener, Forex screener, and Crypto screener are all sub-sections of this section. You can sort any assets, whether Stocks, Forex, or Crypto, by price, alphabetically, and so on in this section.
You can also utilize the search section to find the asset you're looking for, or the filtering method to narrow down the assets based on your criteria.
Community
This section is located next to Market; simply go to the top of the page and click on Community; this section contains a range of trending statistics that can be quite useful in obtaining insight into a given market. You can also use the sub-section Ideas, Scripts, Streams, and More to stay up to date on the latest market news. You can also follow different users and get timely information from the publications they made.
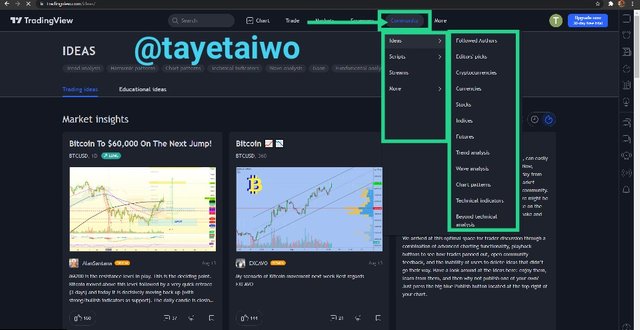
This feature can also be used to undertake fundamental analysis on some assets based on information received from the community, as well as to ensure a way into the market for an asset.
Watchlist
This feature is quite useful because it allows you to keep track of your favorite asset, whether it's a stock, forex, or cryptocurrency. You can easily keep track of these assets' movements and observe how they're performing in the market. Traders and investors will be able to follow and monitor the trend of their preferred asset and see how it behaves, which will automatically assist them in making the best trading decisions.
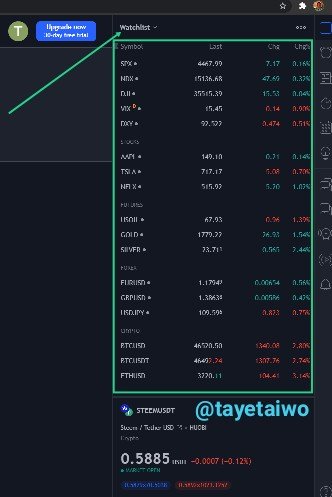
Above is the screenshot of my Watchlist, it contain my favorite Stock assets, Forex and Cryptocurrency. With this I'm on track with how these assets behave and this has been helping me to make the best trading decision.

My favourite feature of the TradingView and Why?
The Tradingview platform has a lot of features that are quite benefits to every trader, be it stock, forex or crypto. The Chart is definitely my favorite feature on this platform, this feature allow me to choose trading pair of any assets of my choice and perform technical analysis on the asset chart, this has helped me make the best decisions and have save me countless of time.
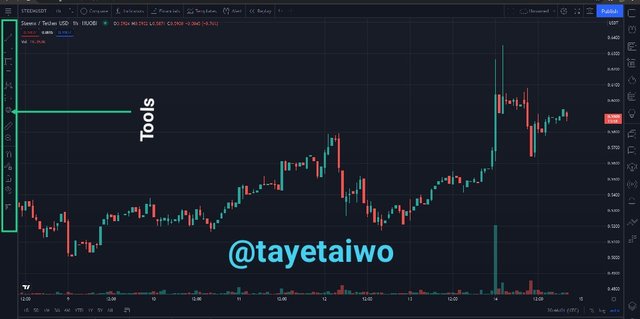
As a cryptocurrency trader I need to perform an in-depth analysis on any asset I want to trade, using some of the Indicators on the Chart section has helped me alot
The Chart does not only allow me to apply Indicators on the asset's chart, I can as well draw line on the resistance and support level of an asset. And this can help me predict the next trend of the asset, I can also use it to write my name and even customize the colour and text size.
All this amazing tools and functions in the Chart feature made me fell in love with it and these make it my favorite feature on the Tradingview platform.

How to set up a chart in TradingView and use two tools to edit it.(screenshot necessary)
Understanding how to set up the chart on TradingView and experimenting with the chart's numerous features is crucial because it may be adjusted to your preference. To execute this configuration on this platform, I'll be using the STEEM/USDT trading pair. I'll demonstrate how this is done using the relevant screenshots.
Step 1: Go-to the Tradingview website https://www.tradingview.com/, from the landing page I click on Chart
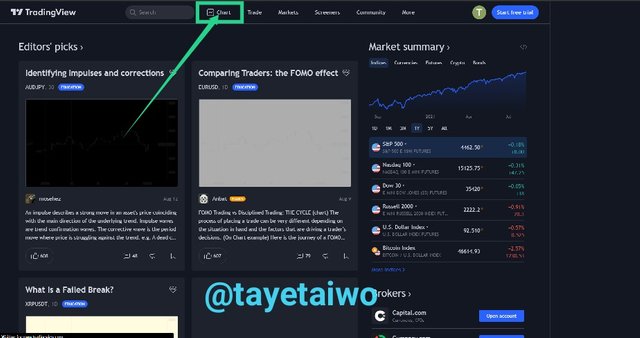
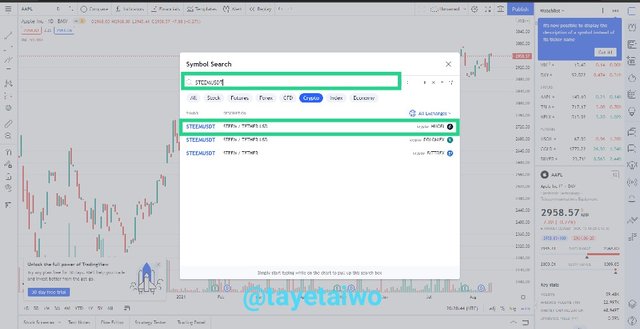
Step 2: I Search for the asset pair, which is STEEM/USDT and out of the list I pick the pair from Huobi exchange from the list because it is one of the largest crypto exchange in the world and the trading volume will be quite high.
Step 3: Now I'm on Tradingview STEEM/USDT chart, there are numerous tools, navigate to the Setting at the upper side of the page.
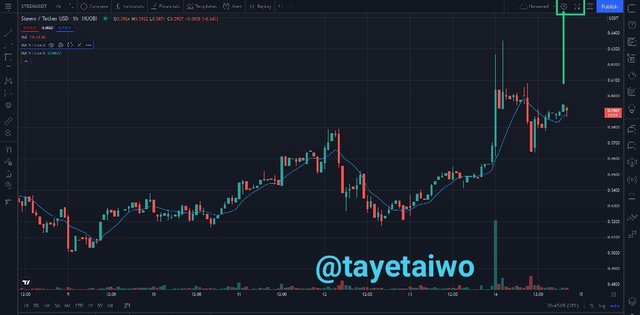
I will try and explore the Chart Settings and discuss each of the options on the settings one by one.
Symbol
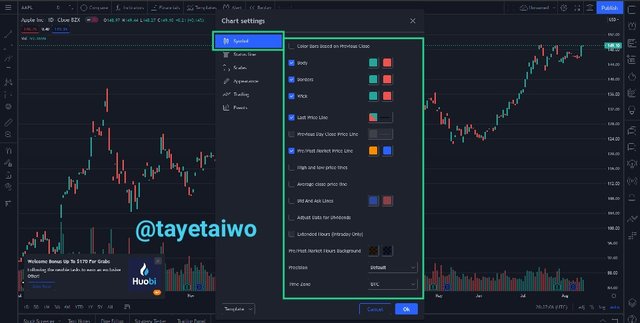
The symbol is the first option on the chart setting, here the color structure of the graph, body, edges, and wick can all be edited and customized.
You can also change the color of the candlesticks, as well as their body and border, for both bullish and bearish candlesticks.
There are other options for adding or removing wicks from the candlestick's component, and so on.
Green and red are usually the default hues for the bullish and bearish candlesticks, respectively.
I don't normally play around with candlestick colors; I prefer green and red for both bullish and bearish situations.
Status Lines
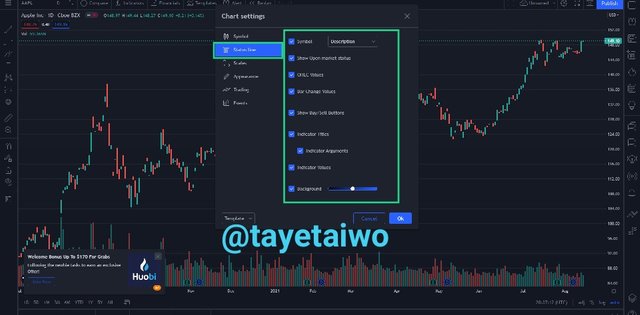
This option can be seen in the chart setting, here you can choose to hide or show the asset symbol displayed on the chart, as well as the open market status, the buy or sell button, the indicator names, the background and color of the indicators, and many other adjustments.
Scales
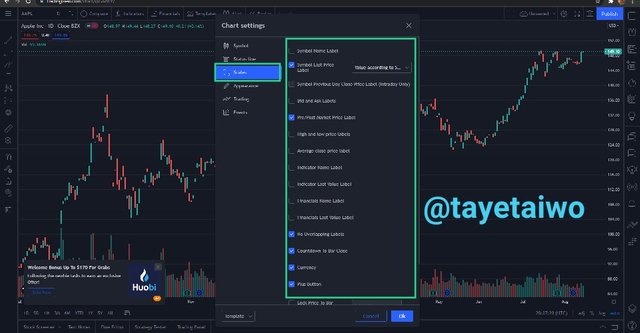
This option allow you to alter the price tag, the bid or ask tag, and the labels such as the financial name, symbol name, symbol last price, and so on by simply ticking the box.
Appearance
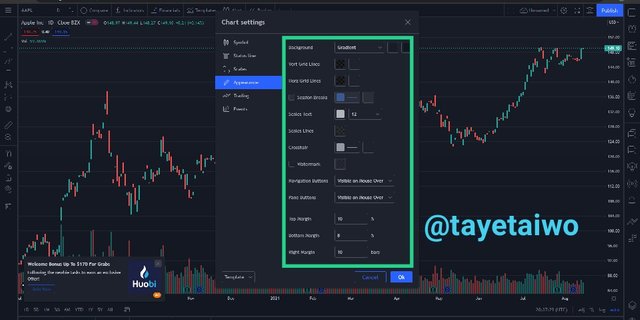
This option simple allow you to customize the colour and background of the chart, We can also alter the text size and color, as well as the Horizontal and Vertical grid lines and navigation bar. In short you can customize the appearance of the chart here.
Trading
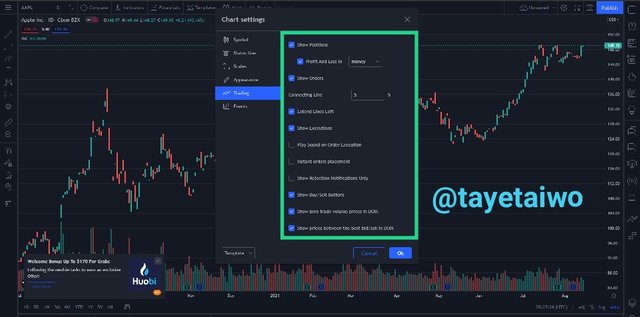
This option in the chart setting is basically for the trading aspect, you can decided to show the trading position, as well as the show profit and loss, and the orders, simply by ticking the box; additionally, you may extend the play sound on order execution, the left line, and many other options.
Events
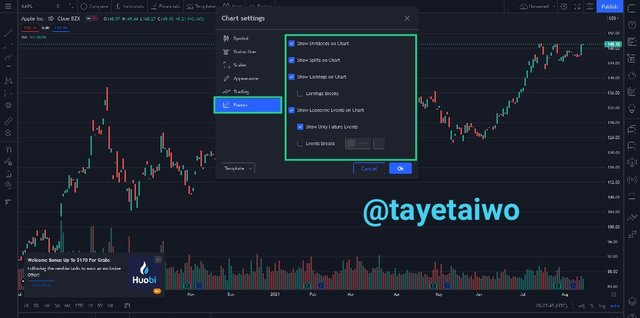
This option of the settings allow you to edit the events, such as shows earning, dividends and many more.
How to use Two tools to edit the Chart
There are a variety of tools available on the Chart feature. In this task, I will demonstrate how to use two different tools on the chart, as well as the functions of the tools. Rectangle and Trend Line are the tools.
Rectangle
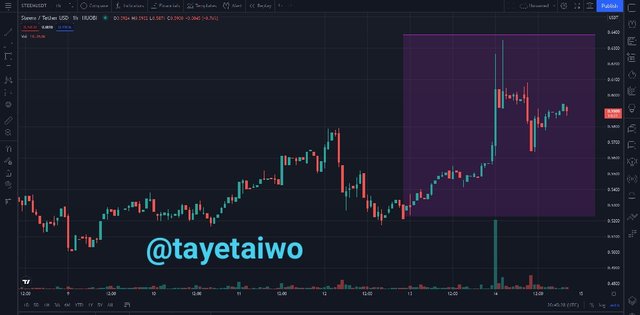
This tool is use to draw a rectangular on the chart, the rectangle can be configured, you can customize the colour, the thicker and the size of the edges.
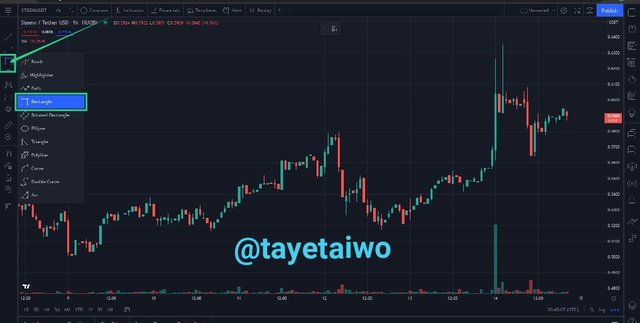
To access the rectangle tool, navigate to Chart and on the life side click on Brush, scroll down and locate Rectangle, where you want to draw the rectangle, drag it and this will make the size big
Trend Line
As a cryptocurrency trader this the trend line is one of my favorite tools on the chart feature, this tool is use for drawing lines on the chart. For example, whenever I'm performing analysis on an asset chart I usually draw line to indicate the resistance and support level of the asset in question.
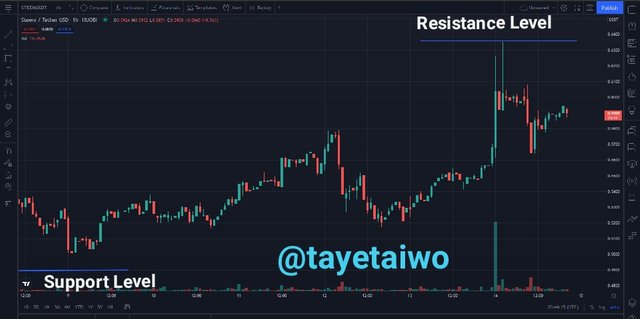
The line can also be configured, as the colours can be customized and the size and many more.
To access the Trend Line tool, navigate to Chart and on the life side click on Trend Line. navigate to where you want to draw the line click on it and drag it this will determine the length of the line

How do we add an indicator on the chart and what is my favorite indicator?
The most important feature of the chart is the indicator. Indicators allows traders to understand the asset's movement trends and pattern. When used appropriately, indicators can be used to predict the asset's next movement and pattern, thus assisting the traders in making a better trading decisions. I'll show you the steps involved to add a Moving Average Indicator to a STEEM/USDT chart on Tradingview.
Step 1: Navigate up the chart to the fx* Indicator and click it.
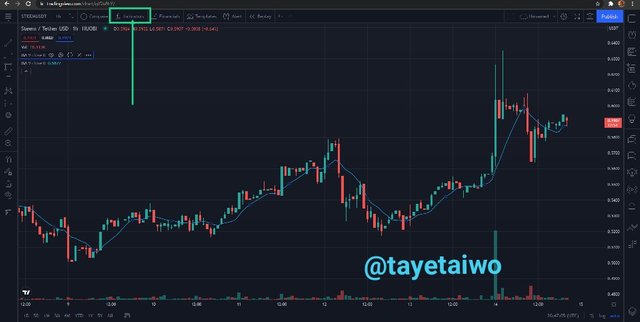
Step 2: To add two Moving Average indicators, search for your favourite indicator. Since I'm adding Moving Average (MA), I searched for Moving Average Indicator and clicked on it twice (MA)
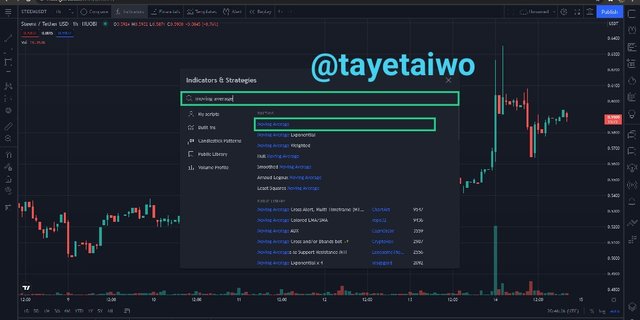
Step 3: Now the two Moving Average (MA) indicator will appear. To make it operate properly, we must configure them. I will configure the first and second Moving Averages so that I can use them effectively.

Configuring the Two Moving Average Indicator
The first thing to do is to pick the first MA, click on the setting Icon on it as shown in the screenshot below.
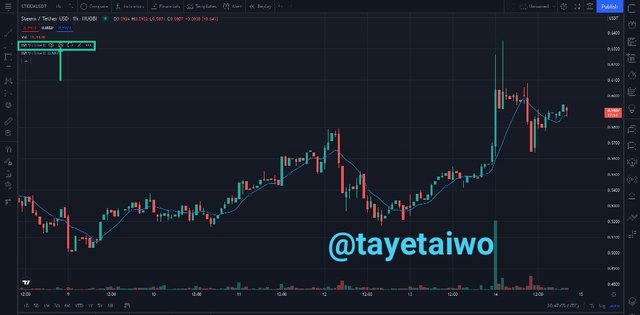
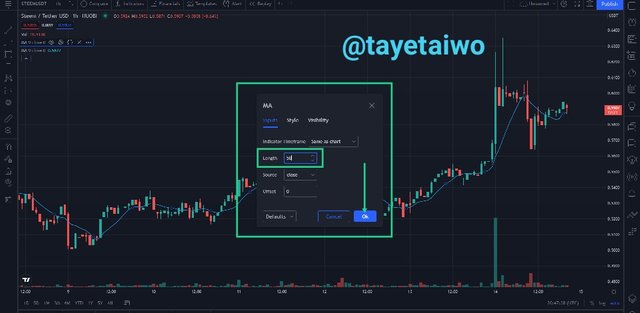
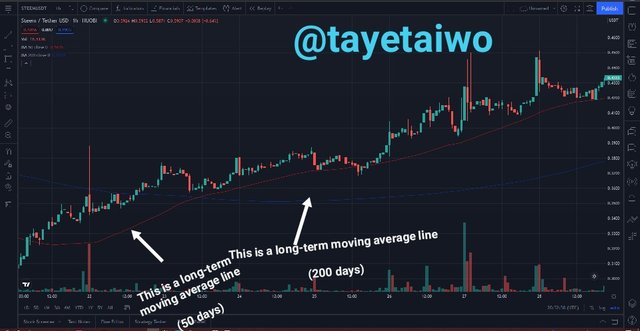
The first MA is a short-term moving line, so we change the length from the default 9 days to 50 days. And we can further change the color to our preference.
To change the length of the day, click on input and change the length to 50 then click on Ok to make it effective.
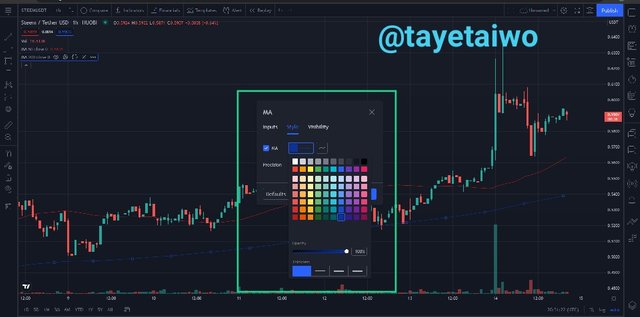
To change the colour of the line, click on Style, select your preferred colour. I selected red
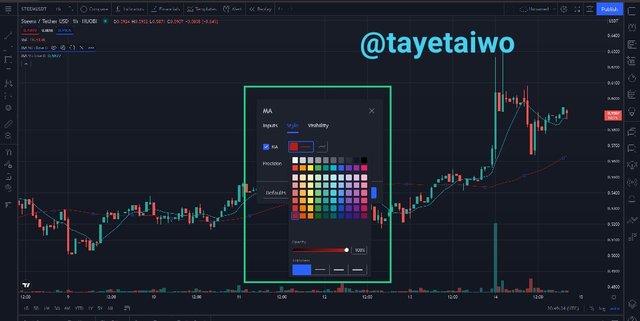
Now to the second MA, which is a long-term moving line so the length will be changed to 200 days, just like the first MA we can also customize the color of the second MA to blue this is for easy identification.
To change the length of the day, click on input and change the length to 200 then click on Ok to make it effective.
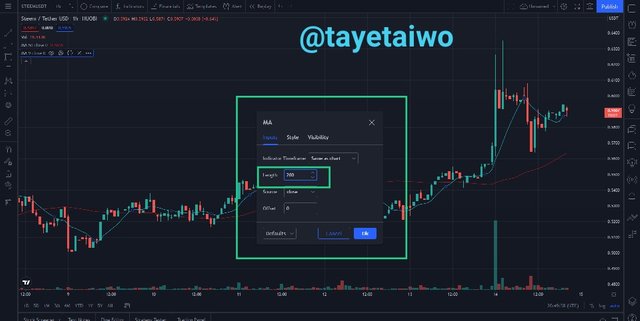
To change the colour of the line, click on Style, select your preferred colour. I selected blue
Now that I have successfully configured both moving average line, below is the outcome.
Why is Moving Average my favourite indicator?
Few weeks back professor @yousafharoonkhan talked about two patterns Death Cross and Golden Cross, this patterns can help traders to make the best trading decisions. To observed this pattern we need the Moving Average Indicator, this will help us to quickly identity the pattern on the asset chart..
Death Cross
Death Cross occurs when the long-term moving average line (200 days) crossed the short-term moving average line (50 days) which indicates a trend reversal in a bull trend. That is if a chart trend is bullish and the death cross occurs there is possibility for a bearish trend implying a sell signal for the trader
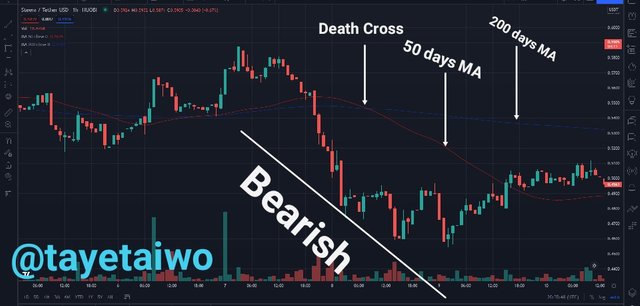
The above is a Death Cross on a STEEM/USDT, where the long-term moving line (200 days) cross the short-term moving line (50 days), meaning the price of the STEEM will come down as the death cross indicate a bearish moving. Signaling the perfect time to sell STEEM.
The Golden Cross
Golden Cross occurs when the short-term moving average line (50 days) crossed the long-term moving average line (200 days) which indicates a trend reversal in a bear trend. That is if a chart trend is bearish and the death cross occurs there is possibility for a bullish trend implying a buy signal for the trader.
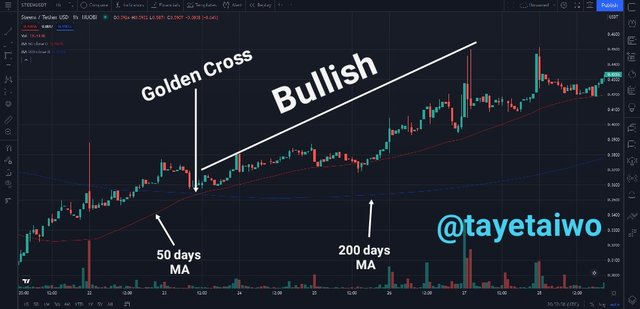
Above is a Golden Cross on STEEM/USDT chart, the short-term moving line(50 days) cross the long-term moving line (200 days), meaning the price of the STEEM will go up as the golden cross indicate a bullish trend. Signaling the perfect time to buy STEEM.

Do you think TradingView is useful for predicting the cryptocurrency market? (trend/ price)
In my opinion, the Tradingview is highly useful in forecasting the price and trend of any assey in the market whether it is crypto, stock or forex.
The indicators in the Tradingview charts are critical for recognizing market patterns in a cryptocurrency assets. A trader can use the indicator to identify the next trend (whether bullish or bearish) of an asset if use correctly.
There are many features, each features having different varieties of Sub-sections and tools that can help us make the best trading decisions possible.
Tradingview is an online global websites that has help a lot of traders to make good trading decisions.
Due to the built-in feature, it is very easy to use, even newbie can easy utilize it to perform both technical and fundamental analysis since it is user friendly and the interfaces are straightforward..
As a cryptocurrency trader, I make use of Tradingview platform anytime I want to buy or sell any of my coin,I make use of the chart feature to analysis the asset pair, using the built-in indicator I can easily forecast the asset next trend this will let me know whether to buy, sell or hold on to my coin

Conclusion
The Tradingview platform founded in 2011 is one of the platform that offers numerous benefits for traders be it crypto, stock or even forex.
With variety of unique features, a trader or investor can make use this to study the asset very well. With the Watchlist feature you can add all your favorite tokens and be following their performance and movement in the market.
This is a vital lecture for everyone interested in learning everything there is to know about Tradingview.com, and I am grateful to Professor @yousafharoonkhan for his insightful lecture.
Respected first thank you very much for taking interest in SteemitCryptoAcademy
Season 3 | intermediate course class week 7
thank you very much for taking interest in this class
Downvoting a post can decrease pending rewards and make it less visible. Common reasons:
Submit