
Question 1
In your own words, give an explanation of the ROC indicator with an example of how to calculate its value? And comment on the result obtained.
The ROC indicator is a momentum-based indicator that identifies the percentage change of price concerning its current price and the price within its previous periods. The ROC indicator functions like an Oscillator, with its line, plotted to move on either side of the 0 Line.
With the ROC line crossing above the O line, it indicates that the market is in an uptrend, likewise, if the ROC line crosses below the 0 lines it indicates that the market is in a downtrend. But when the market is ranging or going in a sideways pattern then the ROC line tends to hover around the 0 lines.
The ROC indicator is used to identify various signals in the market, they include;
Spot divergences
This condition occurs when the price movement of the asset moves in a counter direction which is opposite to the ROC movement, this normally indicates an upcoming or potential price reversal in either direction.Overbought and oversold conditions
These conditions depend on past negative and positive areas where prices have been overbought and oversold, these areas are identified and then used to predict future movements of the price.Centerline crossovers
This is when the ROC line crosses above or below the 0 lines which will then indicate or signal a Bullish or Bearish trend respectively.Trend COnfirmation
The ROC line can help confirm the occurring trend when its line moves above or below the 0 line- How to Calculate the ROC
Below is the formula used to calculate the ROC.
ROC = [Current Closing Price – Closing Price N periods ago) / Closing Price N periods ago] x 100
I will illustrate with an example how this formula can be used.
For example, to calculate the 14 period of Atom which has a current closing price of $38 and its price at the 14 periods was $32.
Current Closing Price = $38
Closing Price N periods ago = $32
ROC = ($34-$32)/$32 )x 100
ROC = (2/32) x 100
ROC = 0.0625 x 100
ROC = 6.25%

Question 2
Demonstrate how to add the indicator to the chart on a platform other than the tradingview, highlighting how to modify the settings of the period(best setting).(screenshot required)
For this question, I will be using the Goodcrypto Trading website. when you get on the site as a new user you have to create your account by signing in with your email or google account. The next thing to do is to click on the Trade tab, this will navigate you to the trading page where you can choose your desired coin which you want to trade with, but with this illustration, I will be using the ATOM.
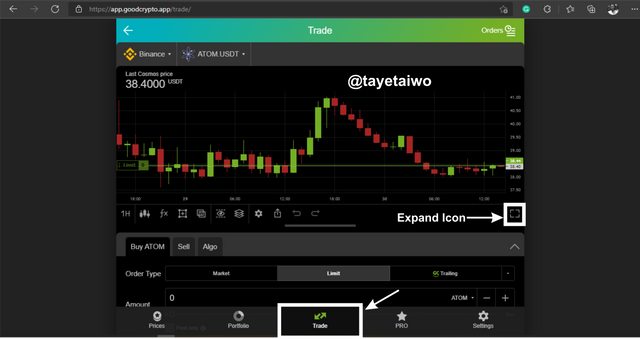
After you have clicked on the Trade Tab t, then Click on the Expand Icon to enlarge the trading window to a full view.
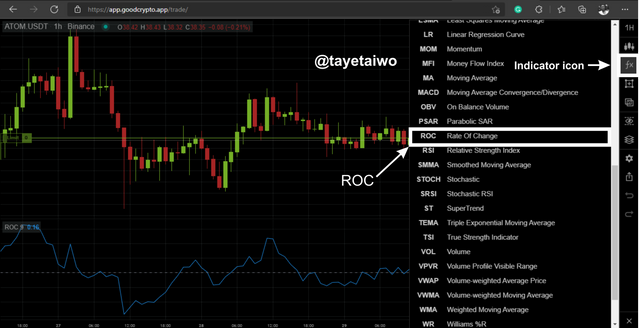
After you have clicked on the Expand icon to enlarge the Trading page, Click on the Indicator Icon on the right sidebar of the trading page, this will bring out an alphabetical list of indicators that are available on the trading platform, then scroll down till you identify the ROC. When you find the ROC(rate of exchange) click on it, this will immediately make the ROC appear on the Charting display.
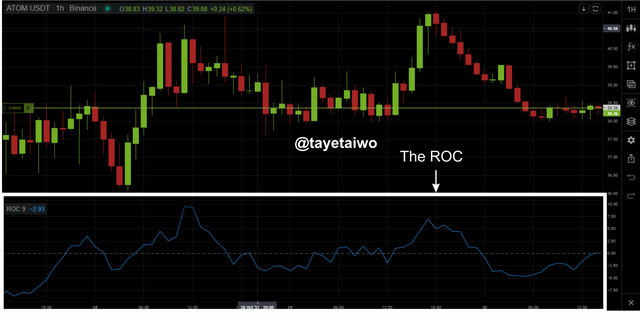
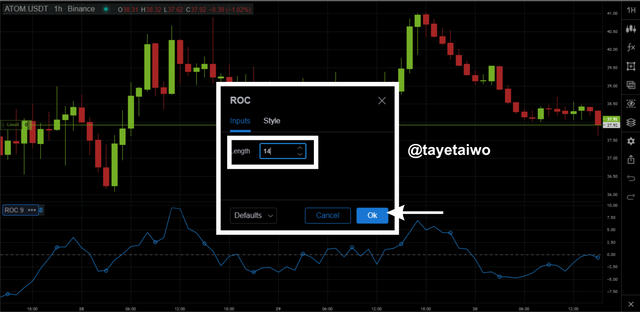
The ROC always comes with a default N period of 9 of which is conducive for day traders, but for the best setting, it largely depends on the period of the trader. For this illustration, I will be modifying the setting suitable for a swing trader.
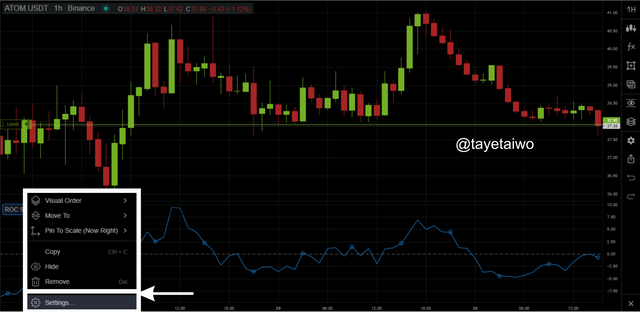
TO modify the ROC, Click on the ROC tab and click on settings, this will pop up an Info tab where you can change the number of periods, in this illustration I will be changing it to the 14 periods.

Question 3
What is the ROC trend confirmation strategy? And what are the signals that detect a trend reversal? (Screenshot required)
The ROC trend confirmation strategy is a trading strategy that is used to identify and confirm if a particular trend has strong momentum
The ROC trend confirmation occurs when the ROC line crosses on either side of the 0 lines which could be below or above it. If the ROC is above the 0 lines it indicates that that the ROC has confirmed an already Bullish trend.
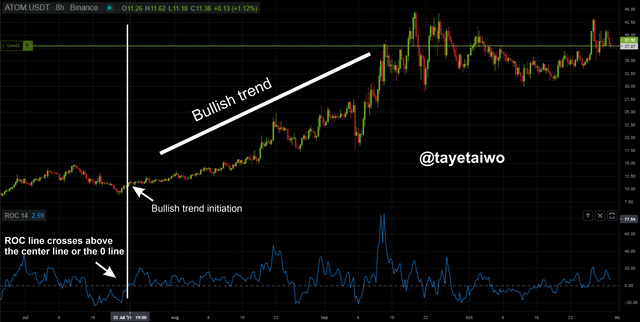
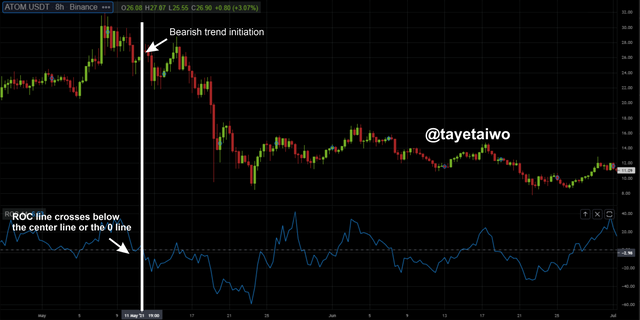
Also, if the ROC line moves below the 0 lines it indicates that the ROC line has confirmed an already Bearish trend or movement.
- ROC Indicator and Trend Reversal
The ROC indicator can be used to identify a trend reversal using the overbought and oversold strategy of the ROC, also using the ROC divergence strategy could be used to identify trend reversals.

Question 4
What is the indicator’s role in determining buy and sell decicions and identifying signals of overbought and oversold؟(screenshot required)
The ROC indicator can be used to identify Buy and Sell signals with the movement of the ROC line moving above or below the 0 lines.
For a buy signal indication, the ROC line has to move above the 0 lines before a Buy signal can be confirmed, but it is advisable to wait for a short retracement before making an entry.

Likewise, if the ROC line moves below the 0 lines it then signifies that a sell signal is identified. It is advisable to wait for a reversal before making an entry.
- Overbought And Oversold Limits Using ROC
The ROC does not have default overbought or oversold limits, but traders can invent their own oversold and overbought limits.
When these limits are identified the trader can then use historical data to identify likely areas that the asset would make price reversal after crossing these limits.
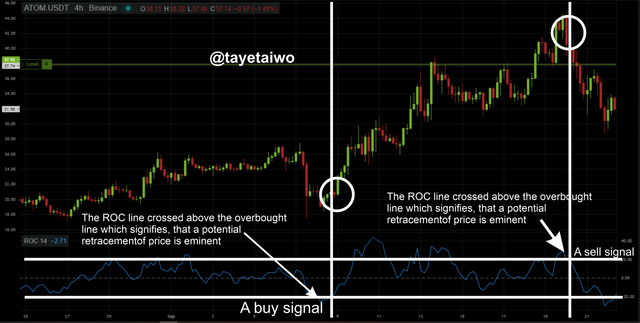
When the ROC line crosses below the Oversold or overbought limit it signifies that the asset has been overbought or oversold, this then indicates that a reversal in price movement is imminent.

Question 5
How to trade with divergence between the ROC and the price line? Does this trading strategy produce false signals?(screenshot required)
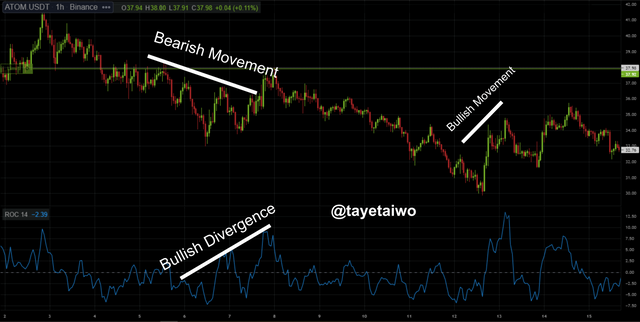
ROC divergence occurs when the ROC line moves in a counter or opposite direction of the Asset price movement or trend.
- ROC Bullish Divergence
The ROC Bullish divergence occurs when the ROC line movement makes a Bullish movement of higher highs while the Asset price movement or trend makes a Bearish move. this indicates that a change in price movement towards a Bullish trend will soon be initiated.
- ROC Bearish Divergence
The ROC Bearish divergence occurs when the ROC line makes a Bearish movement of lower lows while the Asset price movement makes Bullish movements of higher highs. This indicates that a potential Bearish occurrence is eminent.


Question 6
How to Identify and Confirm Breakouts using ROC indicator?(screenshot required)
Breakout is a trading terminology that occurs when the the price of an asset hasbroken a key support or resistance level, this occurs after price has made a sideways movement over a period, momentume is then built after investors carryout a high volume of transaction within that market.
The ROC indicator has can be used to identify a ranging market when the ROC line moves or hover around the 0 lines.
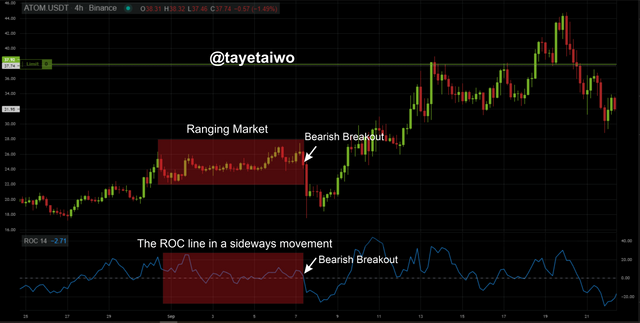
The image above it shows that the ROC was ranging around the 0 lines, and with a move below the 0 lines, a Bearish Breakout was initiated.

Question 7
Review the chart of any crypto pair and present the various signals given by the ROC trading strategy. (Screenshot required)
- Buy Signal
The ROC line movement is key for predicting a change in price movement and also identification or confirmation of a trend or signal.

The image above shows a chart of the ATOM/USDT, the ROC line was used to confirm an entry point after the ROC line crossed above the 0 lines, an entry point was made with the stop loss and take profit set at a ratio of 1:2 respectively.
- Sell Signal
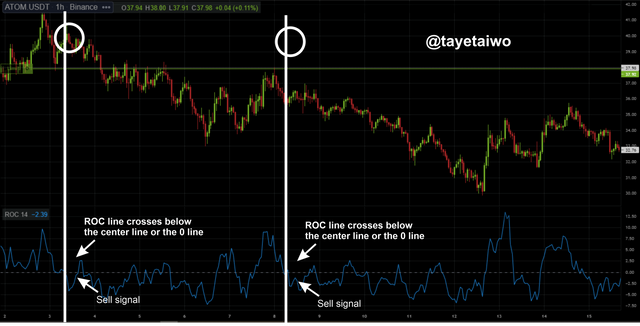
The sell signal occurs when the ROC line crosses below the 0 lines.

From the image above, the ROC line of the ATOM/USDT has just crossed below the 0 lines, this indicates that a Bearish movement is occurring and an entry into the market is conducive. The take profit and stop loss was set at a ratio of 2:1 respectively.

Conclusion
The ROC indicator or the Rate of change is a good indicator that is used to identify various signals which include the Overbought and oversold levels, divergence identification and trend confirmation. The ROC indication is conducive for all types of traders but traders should merge it with other lagging or leading indicators to achieve better or successful results.
Thank you professor @kouba01 for this amazing lecture.
Hello @tayetaiwo,
Thank you for participating in the 8th Week Crypto Course in its 4th season and for your efforts to complete the suggested tasks, you deserve a Total|4.5/10 rating, according to the following scale:
My review :
An article with under-average content, where you built most of your answers on graphs without analyzing them in depth or following a clear methodology to explain their content, and therefore the article misses the editorial and critical dimension.
Thanks again for your effort, and we look forward to reading your next work.
Sincerely,@kouba01
Downvoting a post can decrease pending rewards and make it less visible. Common reasons:
Submit
#club5050 😀
Downvoting a post can decrease pending rewards and make it less visible. Common reasons:
Submit