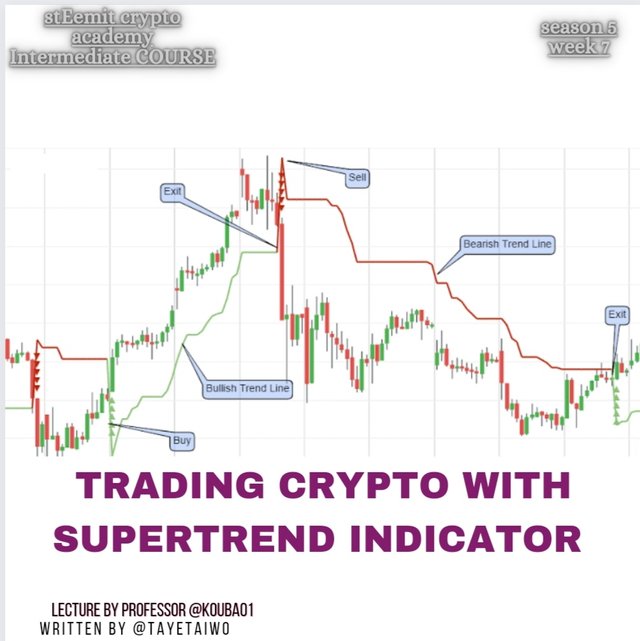
Welcome to the 7th week of the season 5 SteemitCryptoAcademy intermediate lecture by Professor @kouba01
Without wasting time, I will quickly proceed with the given tasks.

QUESTION 1
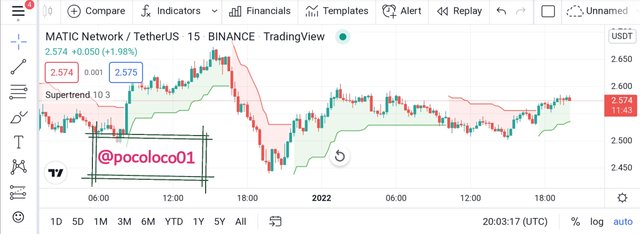
The SuperTrend indicator is an indicator which measures the values of candles using ATR Average. It also helps in the measurement of market volatility and identifying the support and resistance of zones of various market charts.
Just as the name implies, the SuperTrend indicator helps in trend identification by showing a different color (red) on a bearish trend and a different one (green) on a bullish trend. This in turn guides traders in making trading decisions because in other to be profitable, a trader shouldn't trade against the market trend (direction).
Therefore we can easily say that the SuperTrend indicator is an indicator that guides traders on trade positions to take in other to avoid trading against market direction thereby maximizing profit and minimizing loss.
- Screenshot
Formular:
Uptrend = (High + Low / 2 + Factor x ATR
Downtrend = (High + Low) / 2 - Factor x ATR
The value of ATR helps in the identification of the volatility level of the market. When the value of ATR is high, it shows that the market volatility is high and vice versa.

QUESTION 2
The SuperTrend indicator has only but three parameters which are Timeframe, ATR length and Factor.
Steps to configure
Enter Tradingview App or use the website Tradingview. Select a crypto chart and click on indicators.
Screenshot
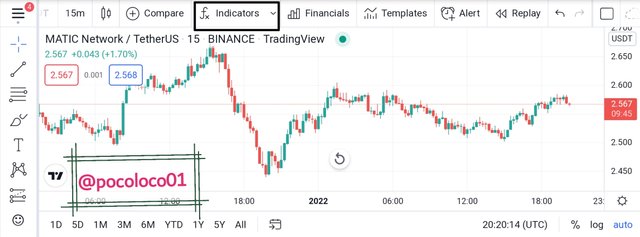
screenshot from Tradingview App
On the list of indicators, search for SuperTrend indicator and add it to the chart.
Screenshot
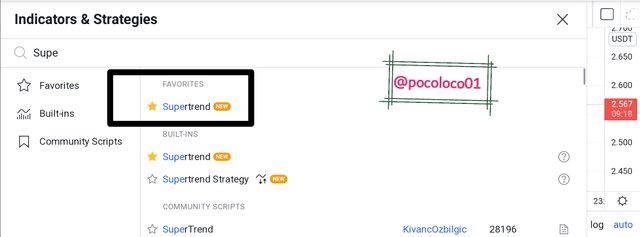
screenshot from Tradingview App
- On the chart, click on the SuperTrend indicator settings icon.
- screenshot
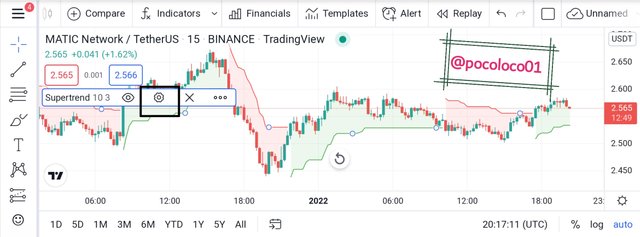
screenshot from Tradingview App
After clicking on the settings icon, a list of parameters will be displayed which can be set according to choice.
Screenshot
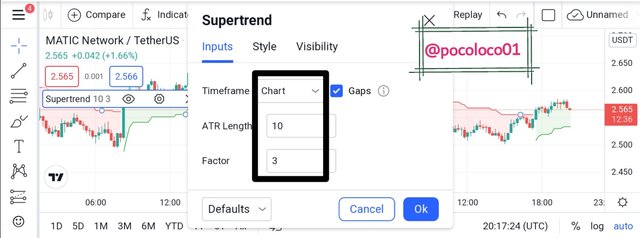
screenshot from Tradingview App
I wouldn't say it is advisable to change the settings or not. I believe that the settings depend on the choice of a trader as different traders might use different settings but in other to find a more suitable setting, it is best advised to text run the strategy using different settings starting with the default in other to know which settings best suits your trading style.

QUESTION 3
In identifying a bullish or a bearish trend using the SuperTrend indicator, a trader should carefully observe the position of the SuperTrend on price chart.
For a bullish trend, the SuperTrend tends to lie under the price chart indicating an upward price movement and for a bearish trend. The SuperTrend terns to lie above the price chart indicating a downward price movement.
This makes it easier for a trader to pinpoint what trend the market is currently having and should be cared not to trade against it.
- Screenshot
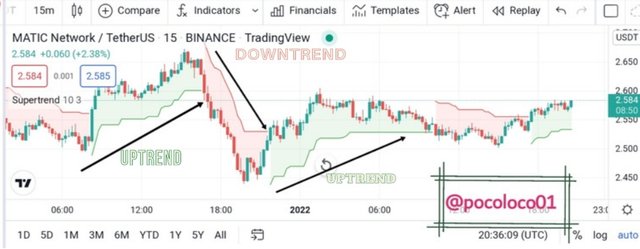
screenshot from Tradingview App

QUESTION 4
We can use the SuperTrend indicator to identify buy and sell signal by analyzing its different movement.
UPTrend (Buy signal)
The bearish price trend, the indicator is expected to move together with price direction. That is, if the indicator is indicating a downtrend, the price is expected to be on a downtrend but when the indicator is indicating a downtrend and the price is moving against it, it is a signal for a bearish-to-bullish trend reversal.
- Screenshot
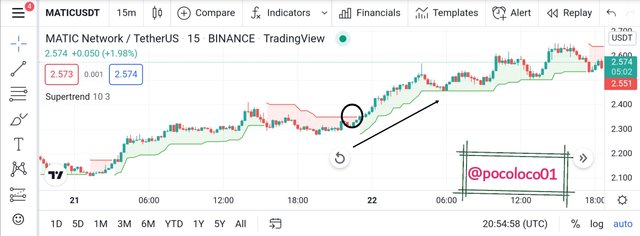
screenshot from Tradingview App
DOWNTRED (Sell Signal)
Similar to what we have seen on the buy signal when the price is moving against the indicator it is a signal of a trend reversal.
When the indicator is signaling an uptrend movement and the price starts to reject it ie the price starts to against it, it is a signal that the current uptrend is weak and a possible trend reversal is expected.
- Screenshot
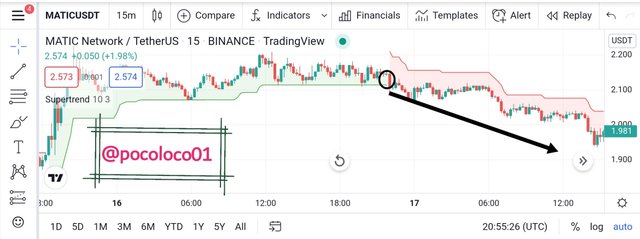
screenshot from Tradingview App

QUESTION 5
In finding breakout using the SuperTrend indicator, we will be applying the Donchian Channel indicator.
The Donchian channel indicator helps in identifying market volatility. It is similar to Bollinger bands by having three lines which makes it suitable in identifying breakouts.
For an upward breakout, when two consecutive candles cross above the Donchian Channel and a new price moves above these prices, it identifies a breakout in the upward direction.
Also, for a downward breakout, when two consecutive candles crosses the Donchian Channel and a new price moves below these prices, it identifies a breakout in a downward direction.
- Screenshot
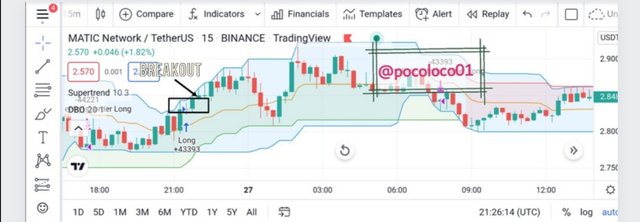
screenshot from Tradingview App
The SuperTrend indicator is primarily there to make sure that we are not looking for a bullish breakout on a bearish trend and vice-versa.

QUESTION 6
Here we will be coming two SuperTrend indicators, one fast and one slow. The slow one is the one with the defst parameters ie ATR length of 10 and a factor of 3. While thr fast SuperTrend will be set to have an ATR length of 20 and a factor of 2.
In other to find a buy signal, we will wait for the fast line of the SuperTrend indicator to cross over the slow line of the SuperTrend indicator.
In looking for a sell signal, we will have to wait for both the fast and slow SuperTrend indicators to turn red.
- Sell signal
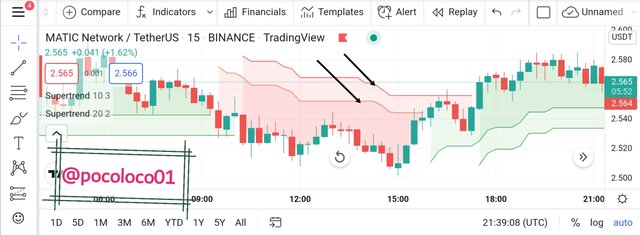
screenshot from Tradingview App
Looking at the above we will see that the slow SuperTrend indicator aligns with the fast one which is a good sell entry and buy exit point.
- Buy signal
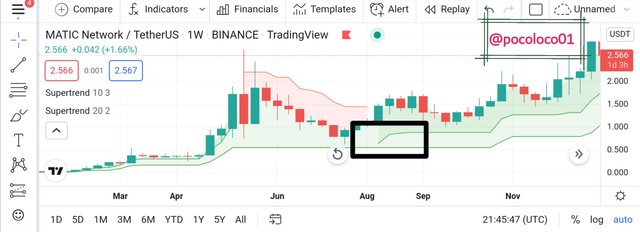
screenshot from Tradingview App
Looking at the above, we will see that the slower SuperTrend indicator aligns with the faster one. This is a good buy entry and sells exit point.

QUESTION 7
Yes, I believe there is a need to pair the SuperTrend indicator with another indicator in other to reduce the risk of a false signal.
Not just about the SuperTrend indicator, every other indicator works best when combined with other technical analysis tools. This is to produce confluence which is very essential in trading because it will help to maximize profit and minimize loss by reconfirming the signal already given by the other indicator.
Talking about the SuperTrend indicator, it will be best combined with another trend indicator such as parabolic Sar or moving average for confluence sake.
When the Parabolic Sar is trending under the price chart, it indicates an uptrend and when it is trending above, it indicates a downtrend.
- Screenshot
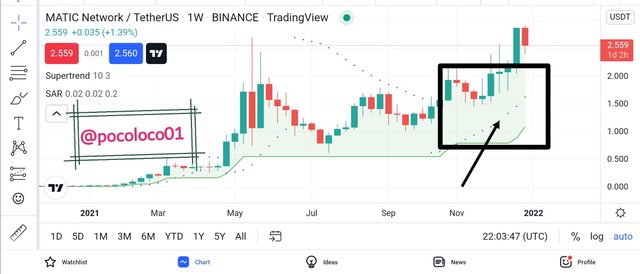
screenshot from Tradingview App
Looking at the above screenshot, the parabolic Sar was trending under the price chart indicating an uptrend which serves as a confirmation of the signal already given by the SuperTrend which is green in color and lying under the price chart.

QUESTION 8
SuperTrend indicator being a trend indicator helps a trader to clearly identify the market trend in other to avoid trading against the market direction.
In calculating the SuperTrend indicator, we can get the value of its ATR Average which will, in turn, help a trader to know the level of market volatility whether it is high or low.
Being a trend indicator, the SuperTrend indicator is not suitable for a market that is moving sideways because it will hardly provide a useful signal due to the lack of trends at that particular time.
Just like every other indicator, the SuperTrend indicator is not best used alone because it can give out false signals at some point. Therefore it is best combined with other technical analysis tools for more efficiency.

CONCLUSION
The SuperTrend indicator is a trend indicator which easy makes trend direction visible for traders thereby guiding them away from trading against the market structure which can easily lead to massive loss.
In as much as the SuperTrend indicator is efficient in providing signals, it is best to combine it with other technical analysis tools in other to produce confluence and minimize the chances of falling for false signals.
