Define Heikin-Ashi Technique in your own words.
Heiken-Ashi is the Japanese word for "average bar." It's a chart pattern that uses the average price of market data to produce a more current candlestick that eliminates market noise. The Heikin-Ashi Technique was invented by Munehisa Homma, often known as the Father of Candlestick Pattern.
The Heikin-Ashi chart pattern is a variation of the Candlestick chart pattern. Simply comparing the two charts, Heikin-Ashi and Candlestick, reveals that they are very similar. Heikin-Ashi, on the other hand, is different in that the current candle data is the average of the preceding candle. The chart pattern aids traders in reading market data, particularly in the stock market. When to enter and exit the market because it filters the noise created by market pricing.
Heikin-Ashi is made up of candles with a body, lower shadow, and upper shadow. There are four distinct settings for each candle: high, low, open, and close. The open, close, high, and close of the previous candle are used by Heikin Ashi to calculate the data for the next candle. The pattern is then created by repeating the procedure. The approach is based on the calculation of the average of two values or periods. Candle opening in Heikin Ashi begins in the midst of the preceding candles. The candlesticks by Heikin Ashi appear to be clean and distinct from traditional Japanese candlesticks.
Make your own research and differentiate between the traditional candlestick chart and the Heikin-Ashi chart. (Screenshots required from both chart patterns)
What's the Difference Between Traditional Candlesticks and Heikin-Ashi Candlesticks?
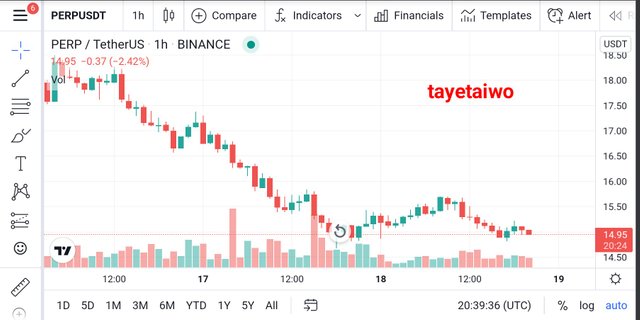
The conventional candlestick and the Heikin-Ashi candlesticks are extremely similar, yet they have significant variations. We'll look at two charts on the PERP/USDT market with the same time periods but different candlesticks to further illustrate these discrepancies.
First thing is to visit the Tradingview platform and search for the pair.
Using the Traditional Japanese Candlestick on PERP/USDT (1 Hour Time Frame)
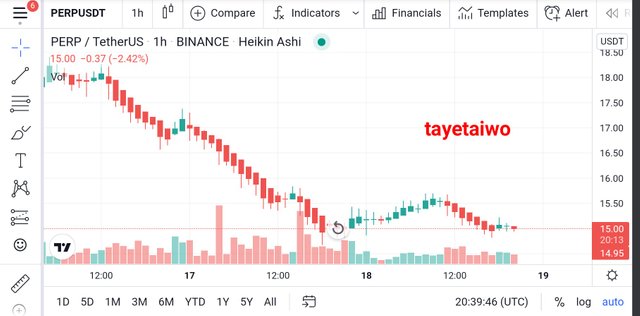
Screenshoot of a candlestick chart using the Heikin-Ashi Candlestick from the trading perspective PERP/USDT (1 Hour Time Frame).
Let look at the table for some important difference from the graphs above.
| Heikin-Ashi Candlestick | Traditional Candlestick |
|---|---|
| - The colors of candlesticks are shown in a consistent and smooth manner, which aids traders in identifying and interpreting trend movement. | Candlestick colors vary often, making it difficult to comprehend. |
| Because the Heikin-Ashi uses an average, the price of a Heikin-Ashi candlestick may differ from the current price. | The price of a traditional candlestick is always the same as the market price. |
| A new candlestick in the Heikin-Ashi candlesticks generally opens from the center of the preceding candlestick owing to the way the Heikin-Ashi candlesticks are computed | Candlesticks in traditional candlesticks generally open after the previous candlestick closes. |
| Because it takes the average and color typically follows the trend movement, Heikin-Ashi lowers market noise, making the candlestick chart flow more smoothly. This makes it easier to assess the trend. | Traditional candlesticks react to all price movements, resulting in color difference even when the trend is strong. |
Explain the Heikin-Ashi Formula. (In addition to simply stating the formula, you should provide a clear explanation about the calculation)
Before the creation of a new candlestick, the Heikin-Ashi Candlesticks examine four data points. Which are;
*Heikin-Ashi Open
Heikin-Ashi Close
Heikin-Ashi High
Heikin-Ashi Low
How To Work Out The Heikin-Ashi Open
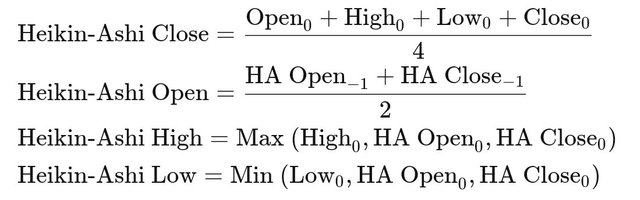
The opening price of the previous candle and the closing price of the preceding candle are put together and divided by two to produce the current candlestick's opening price.
Heikin-Ashi Open = (previous Heikin-Ashi candle's open price + previous candle's closing price)2
How To Calculate The Heikin-Ashi Close
To calculate the candlestick's closing, add the opening price + close price + high price + low price together, then divide by four.
(open + close + high + low)4 = Heikin-AshibClose
How To Calculate The Heikin-Ashi High
This is the highest/highest value reached by the current candlestick.
Heikin-Ashi High Equals the current candlestick's highest value
How To Calculate The Heikin-Ashi Low
This is the lowest/lowest value that the current candlestick can reach.
Heikin-Ashi Low is the current candlestick's lowest value.
To calculate the Heikin-Ashi candles, use the formula..
Graphically explain trends and buying opportunities through Heikin-Ashi Candles. (Screenshots required)
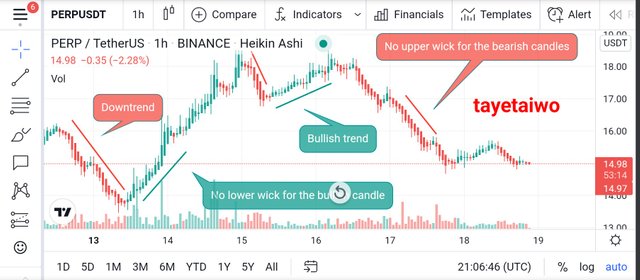
The Trends
Because of the perspective of the candles, trends in Heikin-Ashi candlestick charts are easily spotted and comprehended. The Heikin-Ashi candlestick forms its candles by computing averages; this smoothes the flow of the candlestick, decreasing market noise, and the colors of the candlesticks generally move in lockstep with the current trend.
More importantly, the Heikin-Ashi wicks represent the strength of a trend (shadows). In an uptrend, there are no lower wicks, suggesting a bullish movement; in a downturn, there are no higher wicks, indicating a bearish movement. Below is a graphical depiction of this.
Buying Opportunity
A trader can discover trading opportunities/signals using the Heikin-Ashi candlestick. Heikin-Ashi candlesticks display candles with upper wicks to signal a bullish market and candles with lower wicks to indicate a bearish market, but there are also uncertain candles, which usually offer good trading chances.
For example, a strong bullish candlestick after an uncertain candlestick may be used as a buy indication, whereas an indecisive candle followed by a strong bearish candle can be used as a sell signal.
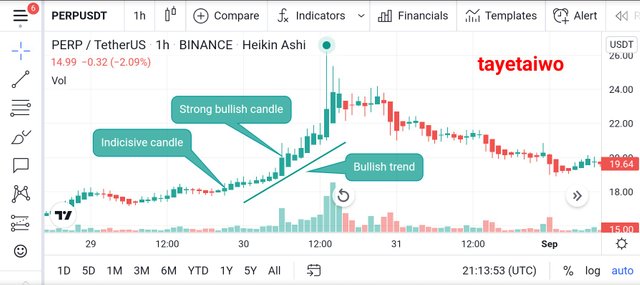
Using the Heikin-Ashi candlestick, a purchasing opportunity is depicted.
After an uncertain candle, a powerful bullish candle appeared, and the graphical representation above showed an uptrend. Traders consider the point following the strong bullish candle to be a good time to purchase.
Is it possible to transact only with signals received using the Heikin-Ashi Technique? Explain the reasons for your answer.
Heikin-Ashi, on the other hand, is a simple alternative to the classic candlestick chart. The chart will get clearer, and additional purchasing chances will be shown. However, it is not advised to base your trading selections solely on a basic method like the Heikin-Ashi technique.
Although we can be confident of success if we use the strategies appropriately, we should always seek confirmation from other indications to back up our judgments. To gain a clear view of the market, almost any indication may be coupled with Heikin-Ashi. MAs, EMAs, MACD, and RSI are some of the most often utilized Heikin-Ashi indicators.
No matter how many indicators we employ, we must keep in mind that the bitcoin market is very volatile, and no approach can guarantee 100% success. It is critical to control your risk when trading.
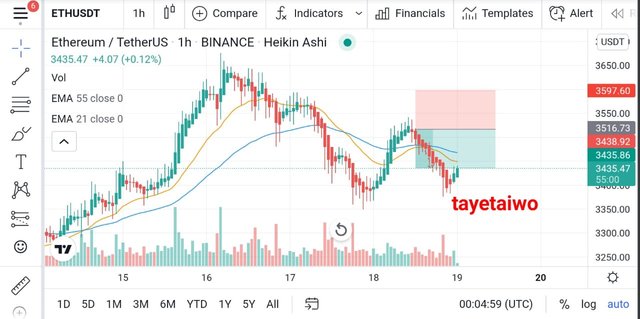
Performing both Buy and Sell orders using Heikin-Ashi+ 55 EMA+21 EMA with a demo account
In this task, I go-to Tradingview website. I then add two Moving Average Exponential (EMA)
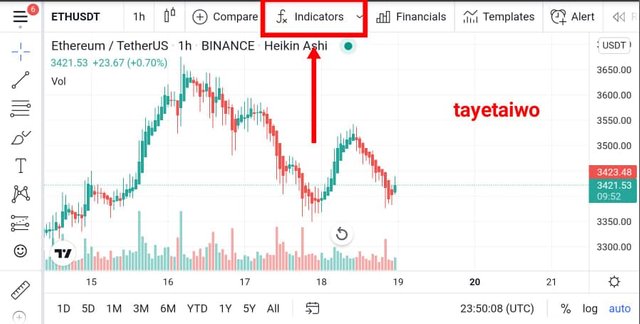
In the Chart, locate the Indicator section and search for Moving Average Exponential EMA, click on it twice.
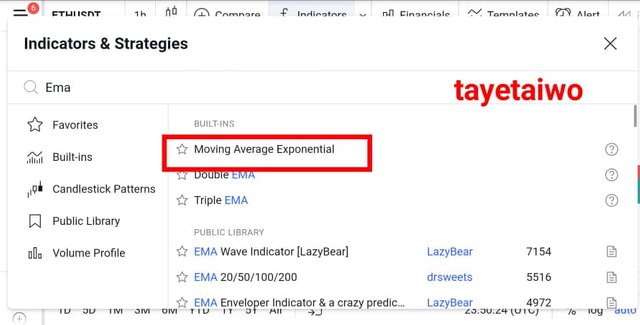
Now let proceed to configure it, Then change the lengths to 55 and 21.
Now that I have configure it, let me buy and sell using Indicator signals.
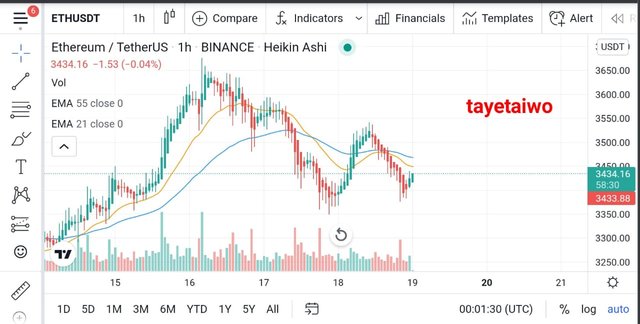
Buy using Heikin-Ashi+ 55 EMA+21 EMA
To buy , Whenever the Heikin-Ashi price movement is above both the EMA 21 and the EMA 55, and a green candle is created which is a bullish trend, indicating a possible buy signal.
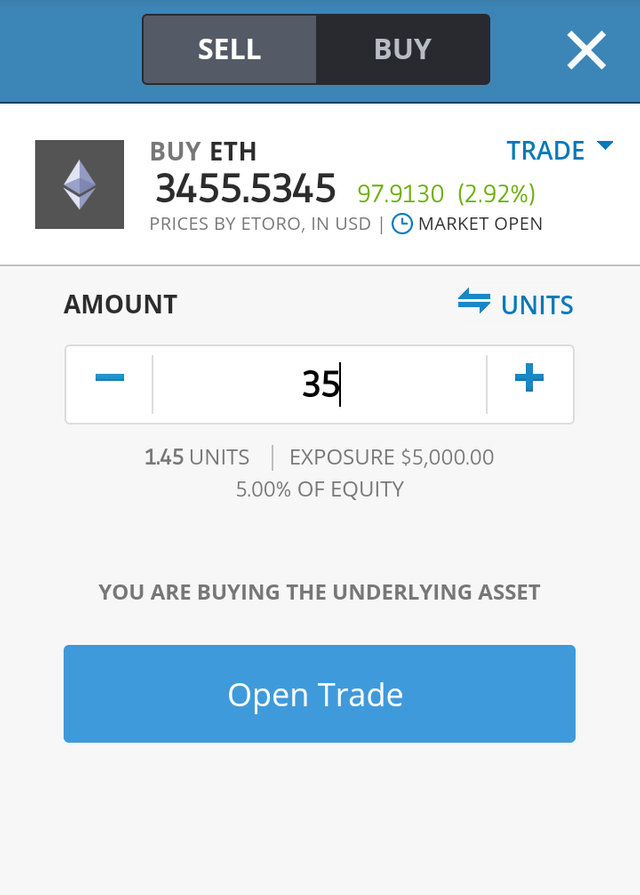
So I bought using the Demo account on etoro
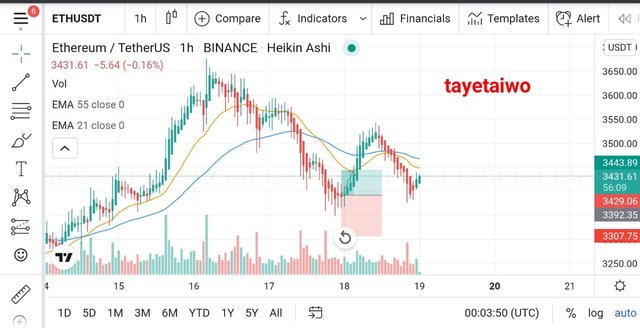
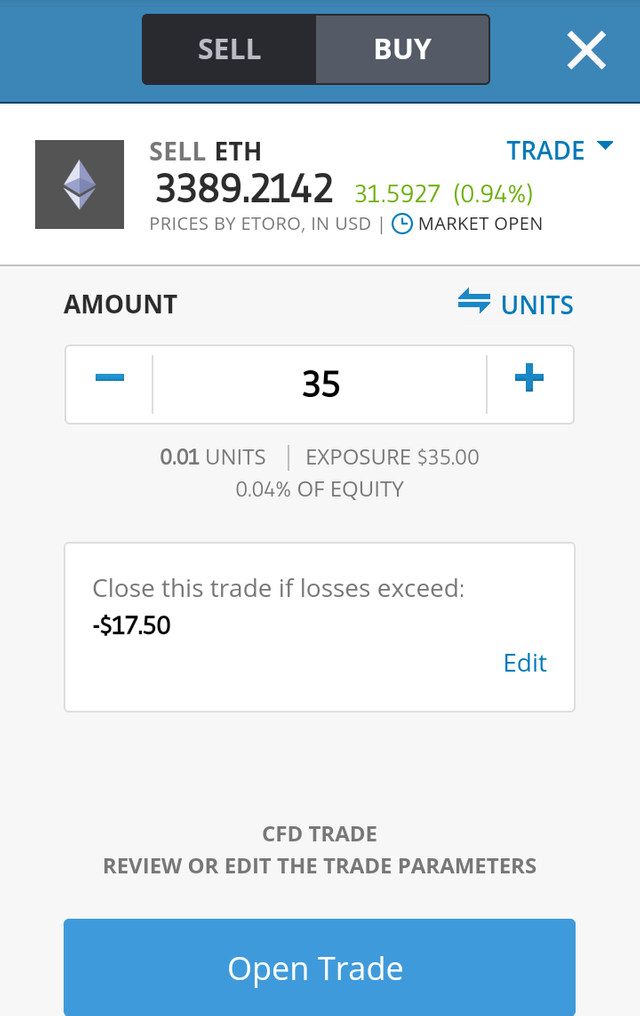
Sell using Heikin-Ashi+ 55 EMA+21 EMA
To sell, Whenever the Heikin-Ashi price movement is below both the EMA 21 and 55, a red candle is created that is a bearish trend indicating a possible sell signal.
So I sold using the Demo account on etoro
Conclusion
The Heikin-Ashi technique is a quick and easy tool to analyze price movement. It gives clear clues and makes spotting trends easier. This unique candlestick chart differs from standard candlestick charts in that it plots with a price averaging method rather than actual prices.
It is recommended that this strategy be used in conjunction with other indicators such as MACD, Ichimoku, EMA, and so on.
Heikin-Ashi charts are available on IG, tradingview, and other sites.
Thank you for reading!
cc:
@reddileep
Downvoting a post can decrease pending rewards and make it less visible. Common reasons:
Submit