
Indicators are critical in today's trading for determining buy/sell positions. Tom DeMark's TD Sequential Indicator is an indicator he created. It's a useful indication for determining when an uptrend or downturn reaches the end or makes a turnaround. Market reversals and corrections are easy to spot. It consists of 2 patterns, which are the;
• TD SETUP
• TD COUNTDOWN
It aids in determining the best time to purchase and sell at the point of fatigue and reversal of an Uptrend or Downtrend. The TD Sequential Indicator is used to identify early market turning moves in Japanese Candlestick Charts or Bar Charts.
The most crucial feature of this indicator is that it also displays Support and Resistance levels on the chart.
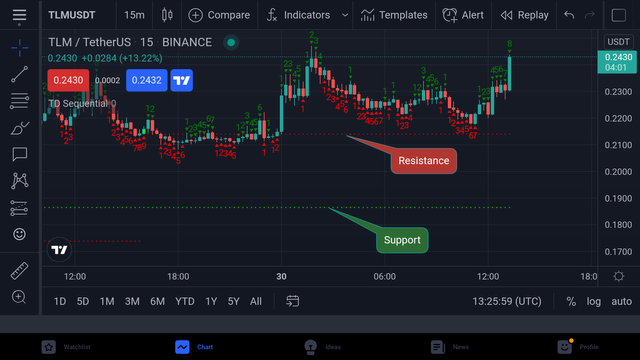
The TD sequential indicator is primarily used to determine the moment of trend exhaustion or the price reversal point. The indicator is made up of specific counts ranging from 1 to 9, which are frequently found below or above each candle.
Because the counts are intended for each candle or bar featured in a chart, the Japanese candlestick or bar chart is employed for this indication. This indicator's creation is dependent on the numbers that have been modified. The setup phase and the countdown phase are the two separate phases of the indication.
After a swift price movement, the setup phase occurs against the dominating trend of an asset. This phase consists of 9 TD number counts. When all 9 counts of this number have been completed, a probable reversal might be determined.
Depending on the trend, the setup phase might be for a buy or sell setup. The purchase setup occurs when the market has been trending downward for a long time, while the sell setup occurs when the market is trending upward.
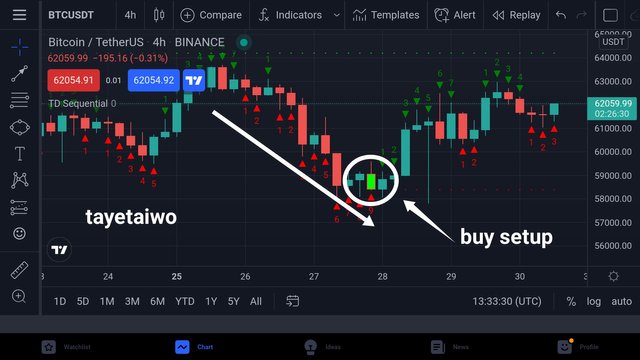
The countdown phase is the second phase of the TD sequential indication. This phase, which is made up of 13 counts, is totally dependent on the setup phase. Following the establishment of this count, the resistance or support is established.
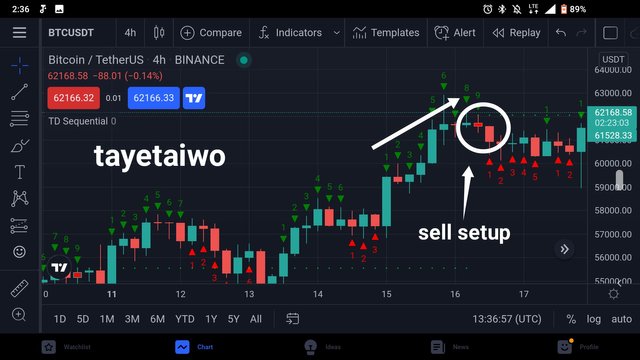
Bearish Step up
The TD sequential indicator is used to examine and position oneself in the market for a short position. There are several requirements that must be satisfied for a bearish setup to be considered genuine. First and foremost, the indicator must be placed on the chart.
Then, after adding the indicator, we'll sell when the market's price is high for a bearish setup. The market must then be in a downtrend, and the count for the bearish set up should begin as soon as a price flip, or a change in direction, happens when the price switches from downtrend to uptrend.
We begin counting once the market has fallen sufficiently and a bullish candle begins to emerge. The number 1 candle (a candle that bears the TD number 1) must close above the preceding fourth candle, which was generated four periods ago. This rule is crucial since it serves as the foundation for the setup.
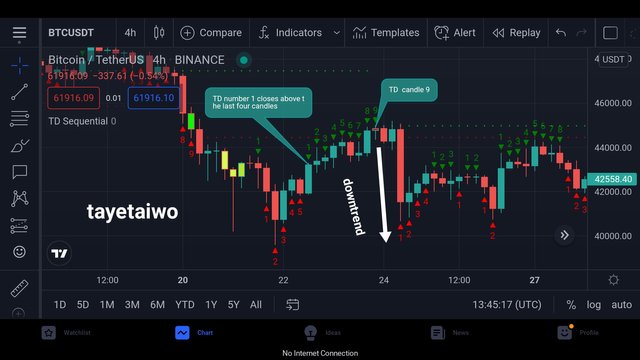
Bullish setup
The bearish setting is the opposite of the bullish setup. We just want to buy the asset when the price is low for a bullish situation. As a result, for a bullish situation, price must fall.
There must be a price change in order to set up the indication for a purchase order. That is, once an asset's price has been in an uptrend for a specific amount of time, a price shift in the opposite direction must occur, moving the price downward. as soon as the price changes, we begin counting to determine if the count is correct.
The TD number 1 is the first to notice following the price change. This is an important number in the count. The closing of TD number one must be below the four-period candle, that is, below the preceding fourth candle.
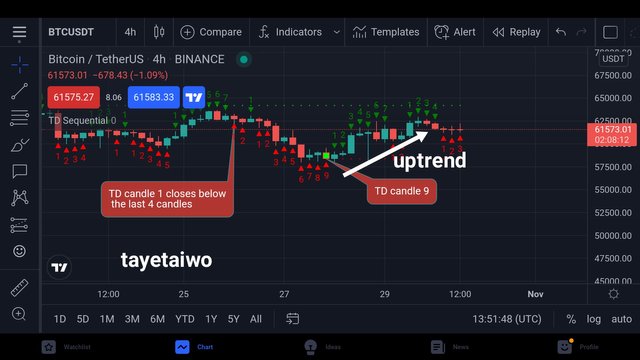
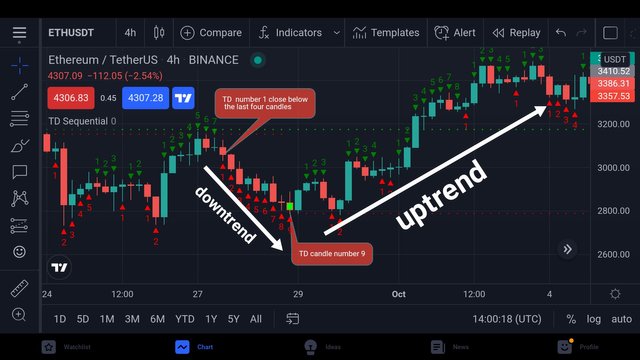
Downtrend Reversal
To begin, we must first insert the TD Sequential Indicator onto the chart and then examine it. The market should be trending downward, i.e. its price should be falling.
Numbers will be added to the Candles of the Chart after using the TD Sequential Indicator. We will search for Candles to signal trend reversal if there is a continued downward trend.
We need to look at the TD Number 1 Candle, and its closure must be lower than the closing of the preceding 4 Candles.
As a result, the TD Number 1 Candle will travel lower, and it will continue to move downward until it reaches TD Number 8 or 9, after which there will be a Trend Reversal, and the market will go upward.
Here is an example of this Trend Reversal-
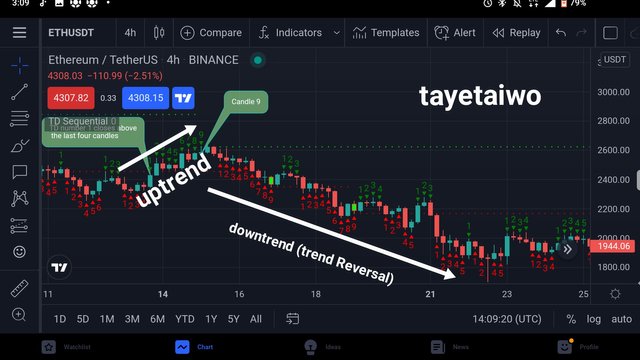
Uptrend Reversal
There should be an ongoing uptrend before we look for Candles to indicate a trend reversal.
We must examine the TD Number 1 Candle, and the TD Number 1 Candle's closing must be higher than the closing of the preceding 4 Candles.
As a result, the TD Number 1 Candle will travel upward, and it will continue to do so until it reaches TD Number 8 or 9, at which point there will be a Trend Reversal, and the market will go downward.
Here is an example of this Trend Reversal-
I'll use the TD Sequential Indicator to do technical analysis on the ETH/USDT pair. I'm going to use Resistance, Support, Entry Point, and TD Number Candles to symbolize the Entry Position and Buy/Sell Positions.
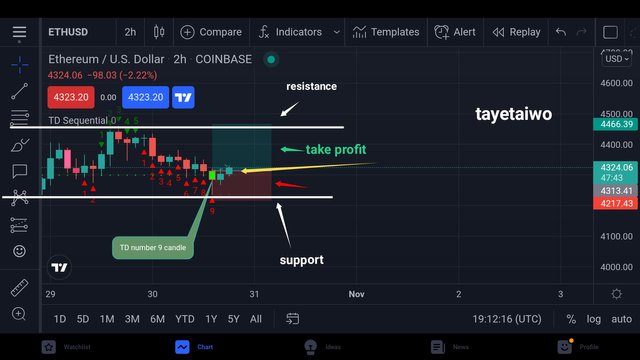
The point of entry, as seen in the above picture, was at the TD Number 9 Candle, which was pointing downward. I've highlighted the Take Profit and Stop Loss levels immediately below the Resistance Line and just above the Support Line, respectively.
As a result, I'll do this trade via Binance Exchange. I open a trade on ETH/USDT spot trade. As you can see in the graphic below, I purchased Entry at $4335
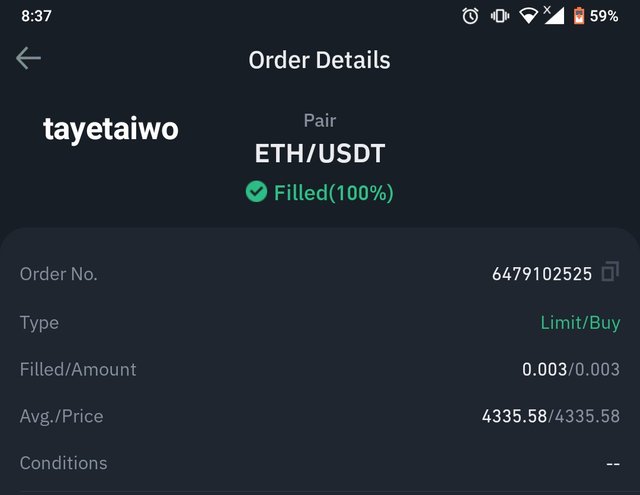
After some time my asset price increase as predicted and got profit after selling it. The Order information may be seen here.
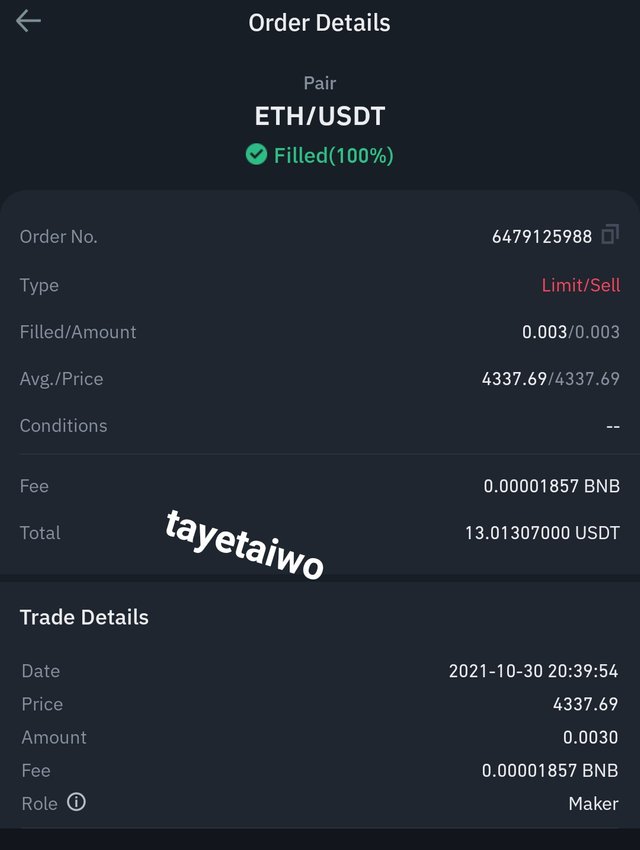
That was the technical analysis utilizing the TD Sequential Indicator, which provided me with a considerable profit in a short period of time, indicating that this indicator is really useful in trading
Professor @reddileep, thank you for this class. Indicators are becoming highly important in trading. The TD Sequential Indicator is also a highly useful trading indicator since it may offer us with Entry/Exit Points.