

Question (1)
What do you mean by Global In/Out of the Money? How is a cluster formed? Explain ITM, ATM OTM, etc with examples?
- What is Global in and Out of the Money
Global in and out of the Money is an on-chain mechanism that arranges the holder address of a crypto asset into clusters and price ranges to determine which addresses are in or out of profit.
Addresses that are arranged into clusters are determined by the period, price range and volume at which the crypto asset was purchased. The current price of the crypto asset is used to determine which of these clusters are either In or Out of the Money.
- How is a cluster formed
A cluster is the sectional arrangement of the addresses which are categorized based on Price range, Volume and Average price. The cluster is formed when a large number of addresses purchase a crypto asset within a specified price range, the GIOM metrics then arrange or uses this set of address to form a cluster that contains a minimum and maximum price, Volume of the asset that is held, Average price range and number of addresses. The clusters could be In the Money(i.e in profit), At the Money( i.e breakeven zone) or Out of the Money (i.e in Loss).
- What is the ITM, ATM OTM
The Clusters of the GIOM are categorised into three which are;
ITM or In the Money
ATM or At the Money
OTM or Out of the Money
ITM or In the Money
This is a set of clusters that are deemed to be in profit because its minimum and maximum price range are less than the current price, this means that addresses within these clusters are in profit, they can also serve as support to the price action based on the size of the volume of the cluster.
ATM or At the Money
This is the cluster that is said to be at the breakeven point, this means that they are neither in profit nor in loss, it also means that the average price range of the cluster is the same or equal with the current price.OTM or Out of the Money
These are a set of clusters That are said to be out of profit or are out of Money, this means that the average price of these clusters is greater than the current price range of the asset. These clusters can serve as a resistance to price based on the size of the Volume of the cluster.

The above image shows the sub-division of the three cluster categories, the image shows that 68.37% of addresses in possession of the BTC crypto asset are currently in profit. The GIOM generally shows that the majority of the dominant number of holder addresses are in profit also it shows that only 25.30% of addresses are out of the Money.

Question (2)
Explain about Large Transaction Volume indicator with examples? What is the difference between Total and Adjusted Large Transaction Volume?Examples?
- What is Large Transaction Volume
The Large Transaction Volume indicator is an on-chain Metrics indicator that records transactions that are above $100k in value and then plotted in a chart. The essence of this indicator is to identify the rate of involvement of the big player or large investors.
The charts are plotted based on the numbers of transactions recorded and an increase at the rate of the transaction means an increase in the involvement of the big players, but these data might be very misleading because some individuals might decide to use multiple addresses to duplicate a single transaction that would eventually lead back to the primary address, this is why there are two types which are the Total Large Transaction Volume and the Adjusted Large Transaction Volume. This data helps small scale investors to identify when to enter or exit a crypto asset because a lack of large investors or a lack of interest from the big players often results in a reduction in the value of the asset.
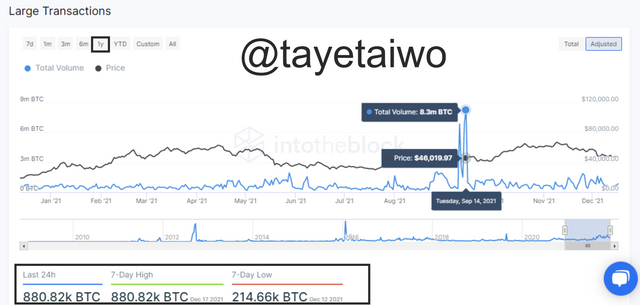
The image above shows the Adjusted Large Transaction volume of the BTC within a year, the area which has an increase in volume shows the increase in interest of the big player with the volume traded peaking at a high of 8.3million BTC.
- What is the difference between Total and Adjusted Large Transaction Volume?
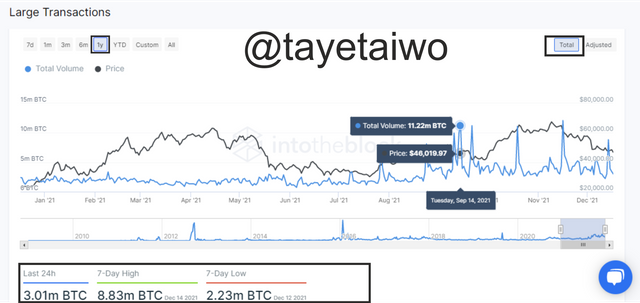
Total Large Transaction Volume is a category of The Large transaction volume which has a record of all the executed transactions that has occurred within the market of a particular crypto asset, without its records being filtered. This means that this chart or record is prone to error or can mislead its users because of individuals who carry out a transaction with multiple wallets which leads back to the originating wallet.
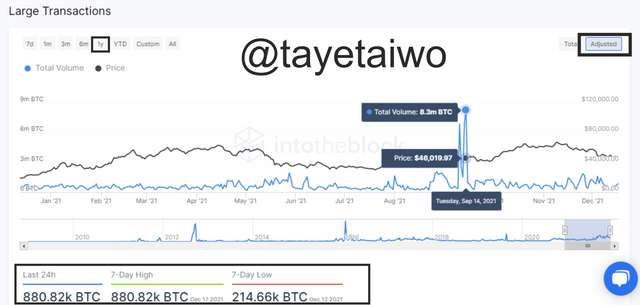
Adjusted Large Transaction Volume is the category that has its records of executed transactions filtered of irregularities or transactions that lead back to the originating address. This means that the data that is given by the Adjusted Large Transaction Volume is deemed more accurate because of rigorous screening of executed transactions.
The Major difference between these two categories can be seen in the images above, the Total Large Transaction Volume shows that from late August 2021 that there has been an increase in the interest of large investors in the BTC asset and that interest has been rampant spike till early December. The Adjusted Large Transaction Volume says the Opposite with its chart sitting the spike in interest of big players around September 14 with the volume transaction peaking at a high of 8.3million BTC, but this interest quickly died off with the coming months but the Total Large Transaction Volume shows that the interest kept on going with the coming months.

Question (3)
Analyze a crypto asset(other than BTC) using on-chain metric: GIOM, and Adjusted Large Transaction Volume? Ascertain whether it supports a Bullish or Bearish bias or Neutral? How do you find the support and resistance using GIOM? How do you ascertain the upside/downside momentum using GIOM? Use the InTotheBlock app or any suitable app? (Examples/Screenshots)?
- Analyze a crypto asset(other than BTC) using on-chain metric: GIOM, and Adjusted Large Transaction Volume?
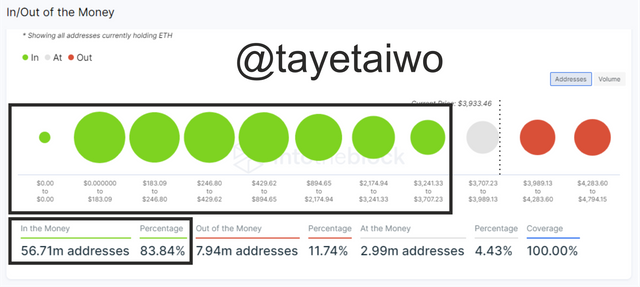
Ethereum is the second-largest crypto by market capitalization, the Ethereum crypto-asset under the GIOM 0n-chain metrics shows that in the long term the majority of the Ethereum holders are in profit due to the current price of the asset being greater than 83.84% of the holder addresses. This means that majority of the current holder addresses of the Ethereum crypto-asset purchased this asset when the price was still low and the majority of its holders purchased it in large volumes.
The GIOM clusters of the Ethereum crypto-asset tends to contain high volumes of Etherum assets that is why its clusters are able to keep the price action at bay because of its large volume.
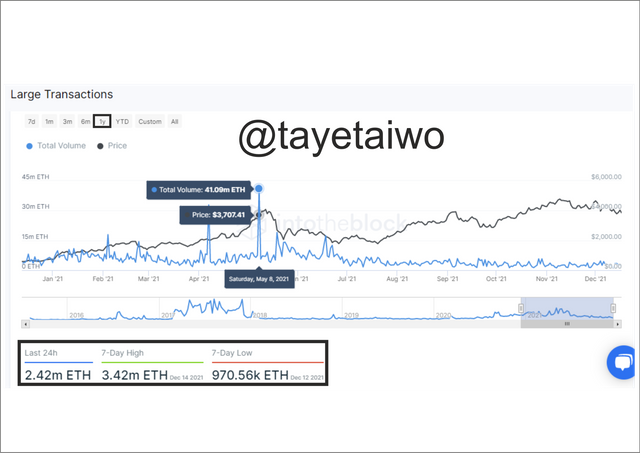
Under the Adjusted Large transaction volume, the Ethereum price action tends to move increasingly as the interest of the large scale investors and big players began to rise, their involvement tends to always spark a bull run in price action, and also with a diminishing interest comes with a reduction in the value of the Ethereum crypto asset, but their involvement will spark fire amongst other small scale investors who will then push the price to keep going up.
- Ascertain whether it supports a Bullish or Bearish bias or Neutral?
I believe the GIOM supports a Bullish movement because the majority of the Holder addresses of the Ethereum crypto assets are in profit, also it can be identified that its ITM clusters have huge volumes of Etherem which means it can serve as strong support to the price action, this can be seen in the screenshot above.
- How do you find the support and resistance using GIOM?
The ITM of the GIOM serves as support while the OTM serves as Resistance, but they can only serve as strong support or resistance which can have an impact on price only when either of their clusters has a large volume of the Ethereum asset held by addresses within the cluster.

The image above shows an identified resistance cluster of the Ethereum asset, this is so because the volume of the asset held by addresses within this cluster is relatively larger than the ATM and the following cluster of the ITM. Currently, the price is moving towards this resistance cluster, but the price action could bounce back off this cluster because of its strong resistance.
- The Momentum based on GIOM
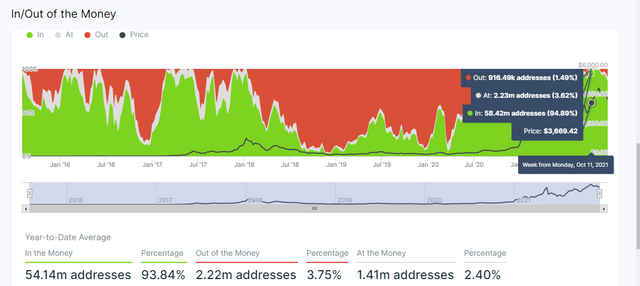
Looking at the long term period of the Historical GIOM it is clear that the presiding momentum driving the market is Bullish this is as a result of over 83.84% of the holder address being in profit. But over the short term period, the current driving momentum is Bearish because over the last three months there has been a reduction in the quantity of address in profit, this could be as a result of two things, one being that the ITM did not serve as strong support which could hold off the price action, the second being a reduction in the interest of large investors.

Conclusion
The Global in and out of the Money is a very good on-chain metric indicator that helps identify when clusters of holder addresses are in either profit or loss. These clusters can either serve as a resistance or support based on whether they are OTM or ITM respectively but it is determinant on the volume of each cluster.
The Large Transaction Volume on-chain metrics record transactions that are over $100k in value, but it is categorized into Adjusted and Total Large Transaction volume. The Adjusted Large Transaction Volume is better used for analyzing the number of executed transactions over $100k because it filters the recorded transaction by getting rid of transactions where individuals use the same address multiple times for a transaction that eventually gets back to the primary address.
Thank you Professor @sapwood for this insightful lecture.