Hello everyone, I trust you are all doing great. Today I will be discussing about:
What is Chart Patterns?
Price Breakout
Continuation Patterns
Reversal Patterns
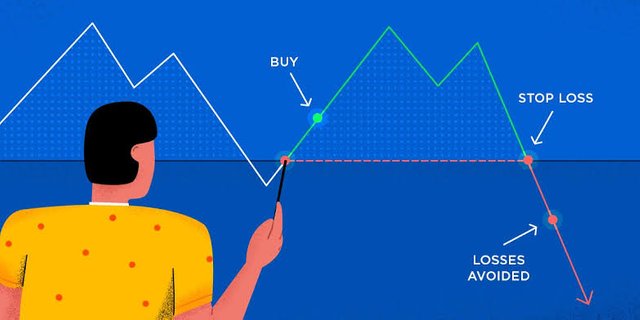
Stoploss
What is a Chart Pattern?
A chart pattern is a shape within a price chart that helps to suggest what prices might do next, based on what they have done in the past.
Chart patterns are the basis of technical analysis and require a trader to know exactly what they are looking at, as well as what they are looking for.
Source
Types of chart patterns
We have 3 types of Chart patterns.
A continuation chart patterns : This type of chart pattern signals that an ongoing trend will continue either uptrend or downtrend
Reversal chart patterns: This pattern signal that a particular trend may be about to change it direction
Bilateral chart patterns: This pattern signal to trader to know that the price could move either way
An Image Illustration of a chart pattern
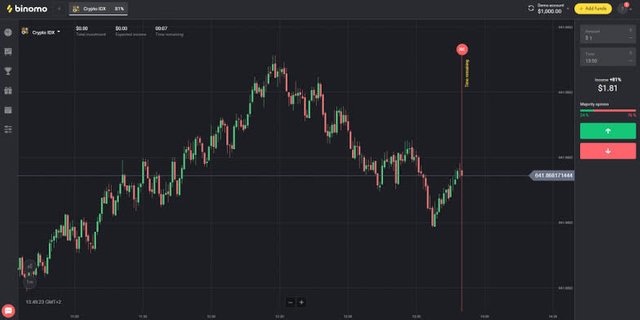
What is a Price Breakout?
When a price of an assets breaks out of some kind of consolidation or trading range then there is a price breakout. When a breakout occurs the plan is to enter the market right when the price makes a breakout and then continue to ride the trade until volatility dies down.
An Image Illustration of a Price break
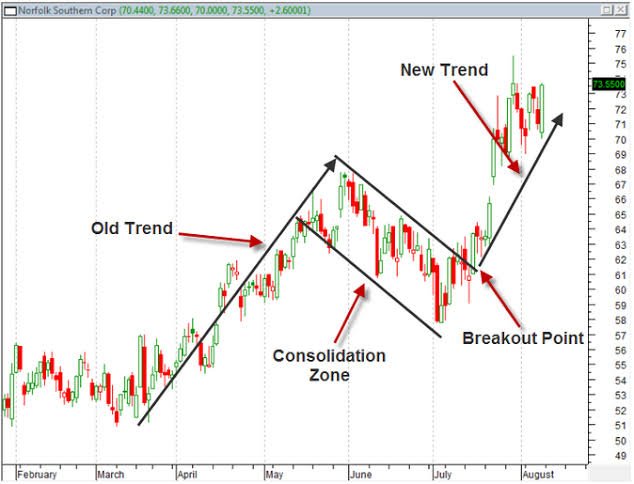
What is a Continuation Pattern?
A continuation pattern refers to the movement of price that signals to the trader that there is a temporary halt in the current ongoing trend, but that the current trend should continue after the break.
An Image Illustration of a Continuation pattern
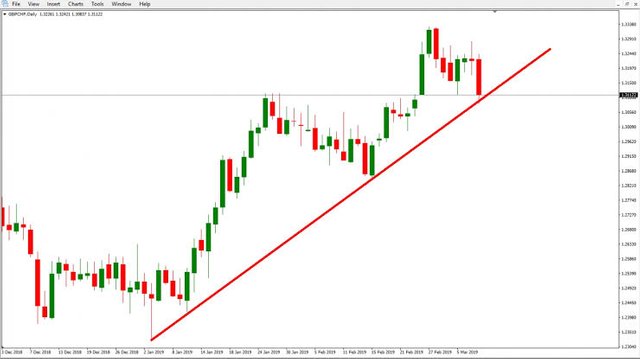
What is a Higher High Formation?
When a price of an assets is higher than it was high the previous day, this automatically give traders confidence to continue trading.
An Image Illustration of higher high formation
What is a Lower Low Formation?
Lower low formation is the opposite of Higher high formation, when the price of an asset is lower than how it was the previous day. Trader loses confidence to continue trader.
An Image Illustration of a lower low formation
What is a Reversal Pattern?
When there is an ongoing trend, and the ongoing trend is about to change course then it is said to be a reversal patterns
Let assume during an uptrend, a reversal chart pattern form then there is a hint that the trend will reverse and that will make the price to go down soon
Or let say during a downtrend, and a reversal chart pattern is seen then it suggests that the price will go up soon
An Image Illustration of a Reversal pattern
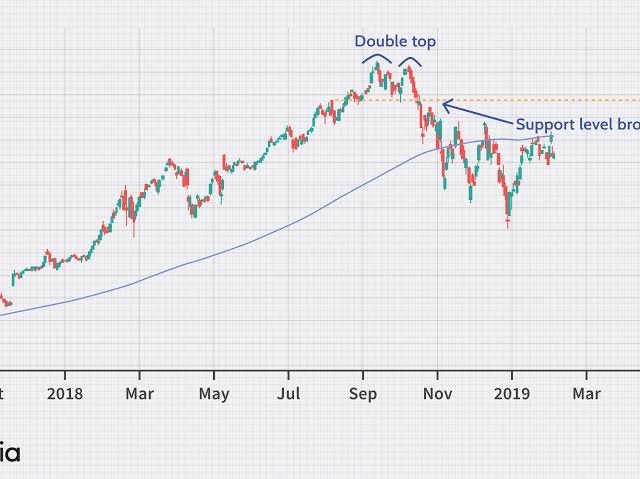
What is a Double Top Pattern
The reversal pattern that is formed after there is an extended move up is called a double top pattern.
An Image Illustration of a Double Top Pattern
What is a Double Bottom Pattern?
The double bottom occur after extended downtrends when two valleys or “bottoms” have been formed. This is also a trend reversal formation, but this time the traders are looking to go long instead of short.
An Image Illustration of a Double Bottom Pattern
In Investing & Trading What Is The Importance of Stop Level (STOPLOSS)?
Stop level or stoploss is when a trader decided to leave a trade after entry and the price dropped, considering the drop in price the trader set a stop level or stoploss to avoid more losses. When a trader doesn't have time to study the market it is important for him to set a stop level or stoploss to avoid big loss.
Where To Find & How To Set A Stoploss
A trader need to study the history of the assets he/she wanted to trade, by doing so the trader can look for where to place the stoploss order.
The trader can decided to place his/her stoploss order at 15%, while some traders can choose to place at 5%, it depend on the trader choice, because their is no rule guiding the point at which a trader should place his/her stoploss order. The important thing is that the trader should make should his/her placement follow the first, second and third support level.
Conclusion
I really appriciate professor @stream4u for this great lecture but I will be more happy if the profesor can share more light on Stoploss cause after the lecture and some researches I made I don't really understand it.
I will be glad if he share more light on it.
Special mention
Cc: @steemcurator01
Cc: @steemcurator02
.png)
.png)
.png)
.png)
