

Question (1)
What is Aroon Indicator in your own words? What are Aroon-Up and Aroon-Down? (Show them on Chart).

Over the years, traders have always sought the best indicator to determine Trend momentum and the directions Trends will take, this has prompted technical analysts to delve into finding palatable solutions by developing better Trend indicators.
Tushar Chande is one of the technical analysts who have been instrumental in the creation of various indicators such as the Qstick, Chande Momentum and Aroon Oscillator, but today I will be discussing one of his notable developed indicators which is the Aroon Indicator.
The Aroon indicator is a Technical analysis tool that is used majorly in the identification of a trend, it can do this by reading or measuring the time between highs and lows and by doing so, the Arron indicator identifies changes in the trend directional movement and also it confirms the momentum or strength of a particular trend.
Traders who trade market trends would hugely be appreciative of this indicator because of its ability to identify changes in trend directional movement, with the use of two lines called the Aroon-up and Aroon-down.
- What are Aroon-Up and Aroon-Down
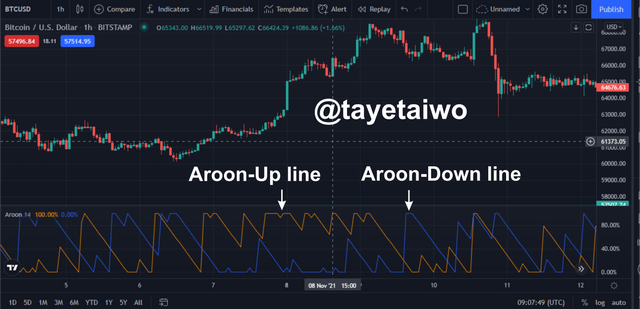
The Aroon-Up and Aroon-Down are the two lines that are used to identify the direction of a trend. The lines move within a range of 0 - 100.
- The Aroon-Up
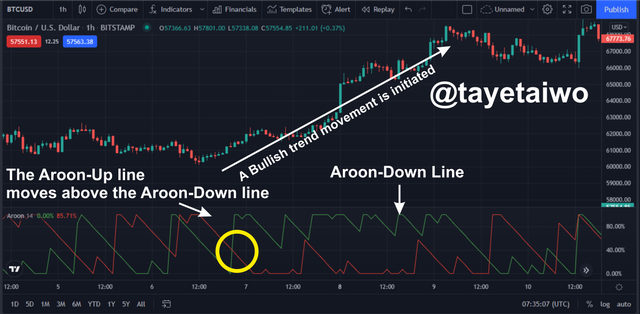
The Aroon-Up is one of the Aroon indicator lines that is used to identify a bullish trend direction or strength when its line crosses above the Aroon-Down line.
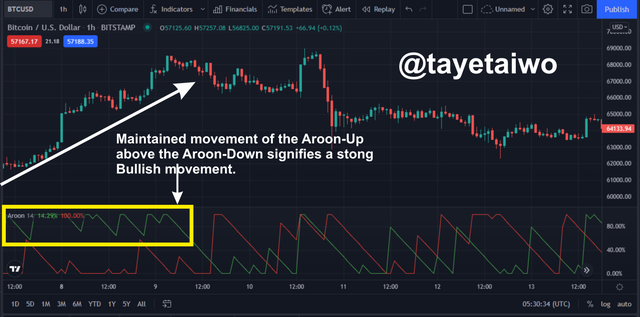
Also, the strength of the trend is identified when the Aroon-Up line crosses above the Aroon-Down line and maintains a continuous movement above it.
- Aroon-Down
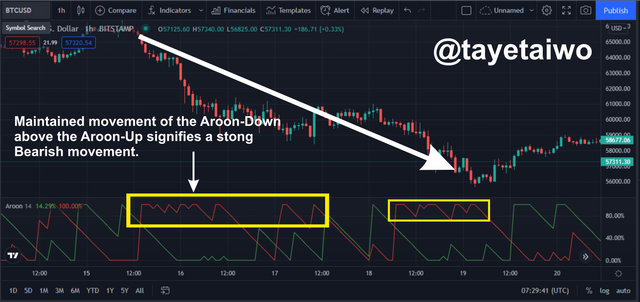
The Aroon-Down is one of the Aroon indicator lines that is used to identify a Bearish directional impulse or movement when its line crosses above the Aroon-Up line.
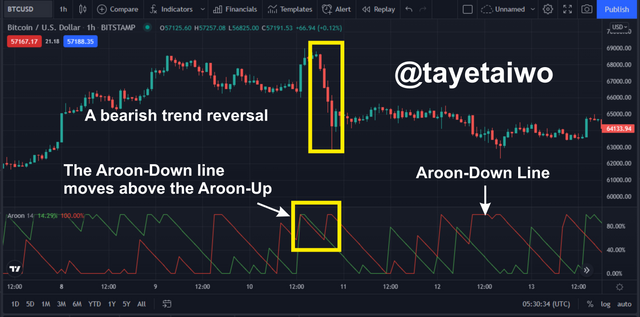
Also, the strength of the trend is confirmed when the Aroon-Down line movement is maintained above the Aroon-Up line.

Question (2)
How is Aroon-Up/Aroon-Down calculated? (Give an illustrative example).

The Aroon indicator just like every other indicator has a mathematical calculation or formula behind its usage, below is the formula used in the calculation of the Aroon indicator.
Aroon-Up = [(nPeriod – Periods Since the Highest High within nPeriod ) / nPeriod] x 100
Aroon-Down = [(nPeriod – Periods Since the Lowest Low for nPeriod ) / nPeriod] x 100
Where nperiod = The default period or the period was chosen for the analysis, eg 14 or 25
For example, if the Aroon-Up period is 14 and the period since the highest high within nperiod was 8.
Therefore Aroon-up = ((14 - 8)/14) x 100
Aroon-Up = (6/14) x 100
Aroon-Up = (6/14) x 100
Aroon-Up = 0.43 x 100
Aroon-up = 43
Likewise, if the Aroon-Down period is 14 and the period since the lowest low within nperiod was 3.
Therefore Aroon-Down = ((14 - 3)/14) x 100
Aroon-Down= (11/14) x 100
Aroon-Down = (11/14) x 100
Aroon-Down = 0.79 x 100
Aroon-Down = 79
From the two calculations illustrated above, it can be said that the Aroon-Down line is currently above the Aroon-up line, thereby identifying a Bearish movement or trend.

Question (3)
Show the Steps involved in the Setting Up Aroon indicator on the chart and show different settings. (Screenshots required).

To set up the Aroon indicator visit the Tradingview Charting platform and choose any pair of your choice to trade.
- The First step is to click on the Inticator icon on the top.
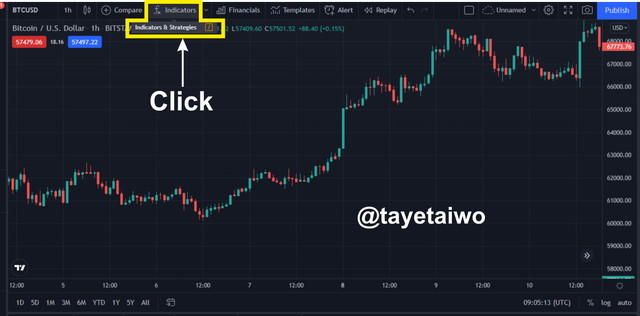
- The second step is to click on built in to show all the inbuilt indicators, thensearch for Aroon and Click on it.
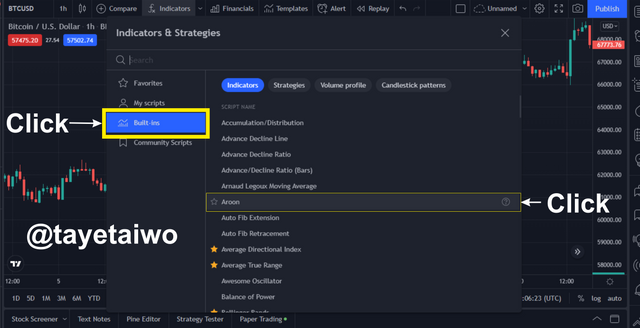
- After You click on the Aroon indicator it will appear on the trading chart. Below is the Aroon indicator with its two lines indentified.

To Modify the Aroon Indicator, below are the steps to follow.
- Click on the settings icon on the down left corner of the chart.
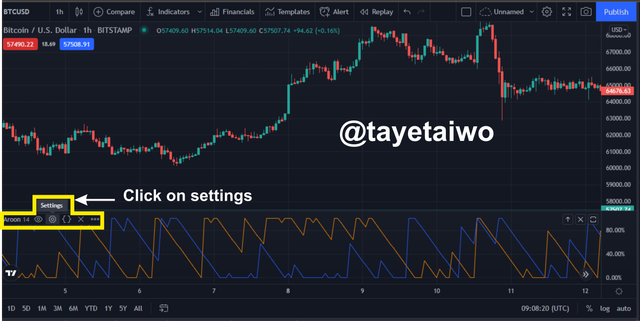
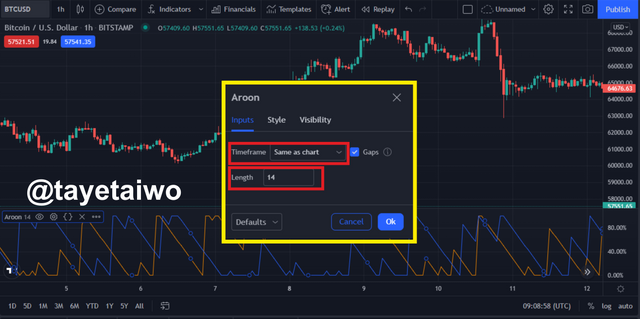
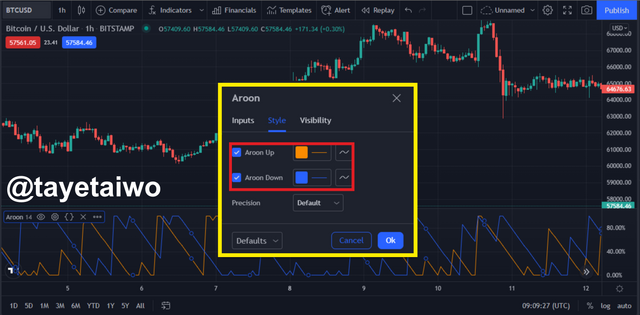
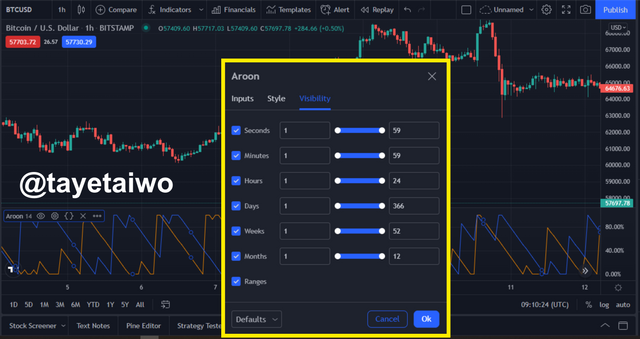
After you click on it a pop-up box will appear in front of the chart, containing different modification options for the Aroon indicator, They are Inputs, Styleand Visibility
Inputs
The inputs section has setting options on the timeframe of choice and number of periods or lengths that a user can choose from, this means that you can choose a time frame that is entirely different from the main chain, also you can change the period or length to suit your style of trading.
- Style
The Style setting option deals with the colour of choice that can be assigned to any of the Aroon lines either Up or Down, the aim is to differentiate the two lines to suite the viewer or user.
- Visibility
\visibility modification or setting option deals with what the user wants to see, on the Aroon display panel, this means that the user can clear up the noise caused by other encroaching data supplied by the Arron indicator so that the viewer can have a nice outlook to the trading chart.

Question (4)
What is your understanding of the Aroon Oscillator? How does it work? (Show it on the chart, kindly skip the steps involved in adding it).

The Aroon Oscillator is a trend indicator that was developed by Tushar Chande in 1995. The Aroon oscillator was developed based on the Aroon indicator system. The word Aroon means “Dawn’s Early Light” in Sanskrit because it was developed to determine or predict the starting point of a trend. It is also used to verify the strength or momentum of a trend.
How does the Aroon Oscillator work?
The Aroon Oscillator line moves within the -100 and +100 range with the 0 points acting as its centre line. The Aroon oscillator identifies or signals a trend when its line moves either above or below the 0 or centre line.
Aroon Oscillator Bullish Signal
For a Bullish trend, the Aroon oscillator line has to move above the 0 or centre line.
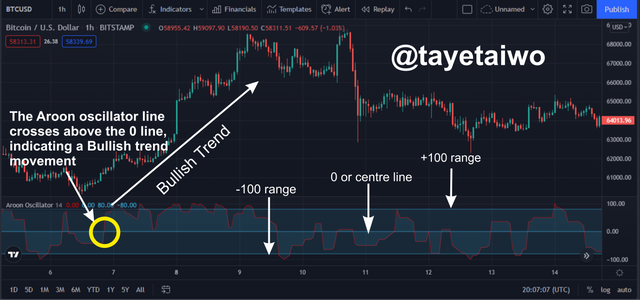
From the image given above it is seen that with the crossing of the Aroon oscillator above the centre or zero line a Bullish trend was signalled.
Aroon Oscillator Bearish Signal
when the Aroon Oscillator line moves below the 0 or centre line it signals or identifies a Bearish trend.
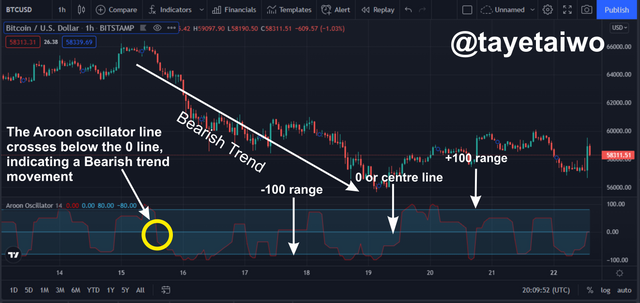
From the image given above it is seen that with the crossing of the Aroon oscillator below the zero or centre line a Bearish trend was signaled.
The Aroon oscillator signals are derived by subtracting the values of the Aroon-Up and Aroon-Down, therefore the formula of the Aroon oscillator is as follows below;
Aroon Oscillator=Aroon Up−Aroon Down
Where Aroon Up = ((25−Periods Since 25-Period High)/25) x 100
Where Aroon Down = ((25−Periods Since 25-Period Low)/25) x 100
For example, I will carry out a calculation using the formula above, but I will be using the values derived from question 2.
Therefore if Aroon Up = 43
and Aroon-Down = 79
Therefore the Aroon Oscillator value = 43 - 79
Therefore the Aroon Oscillator value = -36
With the value of the Aroon oscillator being -36, it signifies that the Oscillator line is currently on a Bearish trend

Question (5)
Consider an Aroon Indicator with a single oscillating line, what does the measurement of the trend at +50 and -50 signify?

As stated above the Aroon oscillator is a single line oscillator that ranges between -100 and +100 with 0 as its centre line. The movement of the Aroon oscillator line above the 0 or centre line signifies a Bullish trend, while the movement of the line below the 0 or centre line signifies a Bearish trend.
The above explanation identifies when a trend will begin but to identify if that trend is strong or if it has momentum, then the Aroon oscillator line has to cross above or below the +50 and -50 range respectively to confirm that a Bullish or Bearish trend has strong momentum.

Question (6)
Explain Aroon Indicator movement in Range Markets. (Screenshot required)

A ranging market is a situation when the price action of an asset makes a sideways movement without, plotting out a particular trend, during this period the Aroon indicator will make a zig-zag movement without making a crossover against each other.
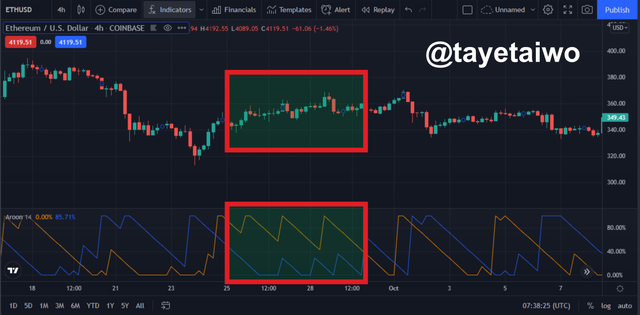
From the image above the Aroon-up and Aroon-Down lines are seen making zig-zag movements without crossing over each other, this is as a result of the market making a sideways or ranging movement. this is a very tricky time to trade, so most traders ignore the market during this period, but still they are on the lookout for a cross over that could initiate a trend.

Question (7)
Does Aroon Indicator give False and Late signals? Explain. Show false and late signals of the Aroon Indicator on the chart. Combine an indicator (other than RSI) with the Aroon indicator to filter late and false signals. (Screenshots required).

The Aroon indicator, just like every other indicator has its own false. The Aroon indicator is lagging, this means that the data that is produced by it is based on historical data or price action of an asset.
Aroon False Indication or Signal
The Aroon indicator gives sell and buys signal for a market entry, but sometimes these indications or signals might be false due to a cross-over of either the Aroon-Up or Aroon-Down, this cross-over could be a result of a short-selling volume or it could be due to high volatility within a short period.
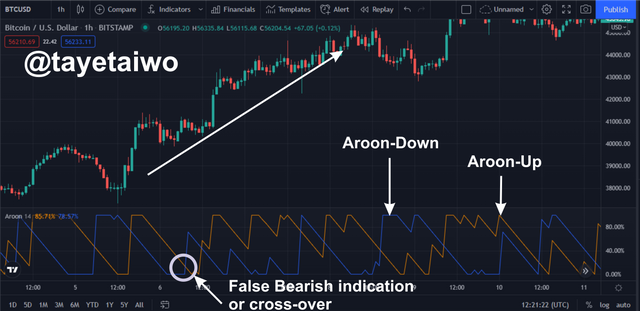
The image above it shows that the Aroon-Down made a cross above the Aroon-Up line, but this movement only lasted for a short while because sellers in the market were eventually drowned out by the Buyers, thereby causing the Aroon-Up line to cross above the Aroon-Down again.
This false signal could be detrimental for traders who do not clearly understand the market or traders who do not use the risk management procedures.
Aroon Late Indication or Signal
Entring the Market early enough is what most traders long for because by doing so they can harness a large amount of profit, also they would not be too afraid of making many losses even if the market drops against them.
The Aroon indicator sometimes is guilty of making late indications or signals because it is a lagging indicator.
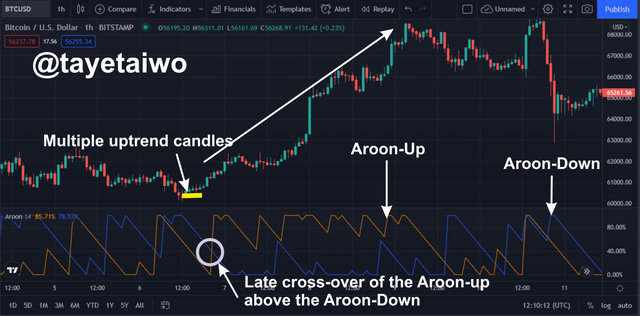
The image above shows that the Aroon-Up indicator made a late cross above the Aroon-Down hours after multiple Bullish candles seem to have established a Bullish pattern.
Some traders will often lose out of a perfect entry for a trade if they should blindly follow the signals or indications produced by the Aroon Indicator.
How to filter late and false signals using the Aroon indicator and the Bollinger Bands
The Bollinger Band is a Leading indicator that was developed by a Technical Analyst called John Bollinger. The Bollinger Band is used to identify a Bullish or Bearish signal and Volatility, also its Bands which are made of SMAs or Simple moving Averages act as a support to the price action.
Having established my definition of a Bollinger Band, it is safe to note that since it is a leading indicator, it means that it can predict the price movement or action before it happens, therefore it serves as a good merger to the Aroon Indicator which is a Lagging indicator.
Aroon Late Indication or Signal
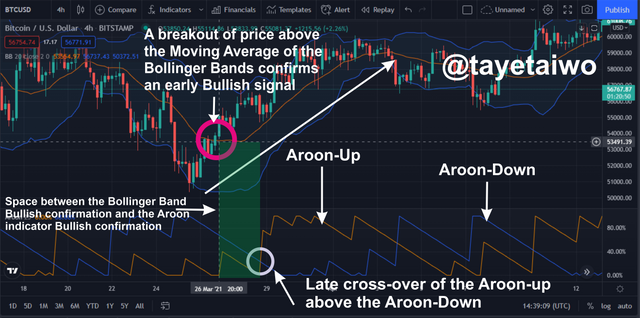
From the image above the Aroon indicator is combined with the Bollinger Band to analyse the market on the BTC/USDT chart. The image shows that the Arro-Up made a late cross above the Aroon-Down to identify a Bullish trend, but before the Aroon indicator identified this Bullish trend, the Bollinger Band had already identified and signalled a Bullish trend After Price broke above its middle Moving Average. The Bollinger was able to make an early call or signal for a Bullish trend and in doing so filtered out the late response of the Aroon indicator.
Aroon False Indication or Signal
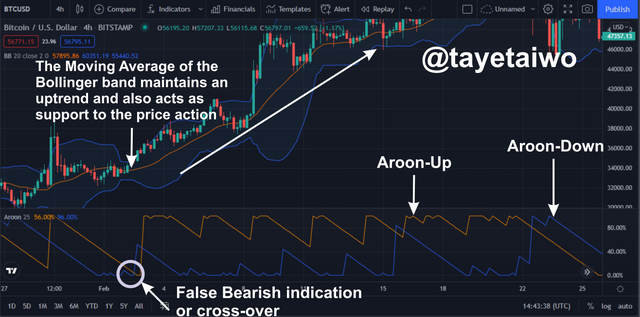
The image above shows that the Aroon indicator made an early call or signal for a Bearish trend when the Aroon-Down line made a cross above the Aroon-Up line, but this signal was filtered out by the Bollinger Band which maintained support for a continuous bullish trend for the underlying crypto asset.

Question (8)
Place at least one buy and sell trade using the Aroon Indicator with the help of the indicator combined in (7) above. Use a demo account with proper trade management. (Screenshots required).

- A Buy Order with the Aroon and Bollinger Band Indicators.
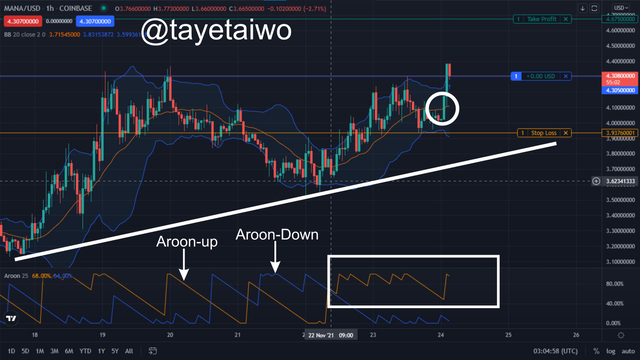
The image above shows an executed Buy order on the MANA/USD chart. for this trade, I made use of the Bollinger Bands and the Aroon Indicators to analyse and execute the trade.
Before I executed the trade I was able to identify the general Bullish market Trend. I also identified that the Aroon-Up indicator has already crossed above the Aroon-Down which indicates a Bullish signal, also identified that the price of the crypto asset has made a breakout above the middle SMA (simple moving average) which also signifies a Bullish movement.
With all these confirmations in check, I placed a Buy order for the asset with a risk management procedure of Stop-loss and Take-profit set at a ratio of 1:1, the essence is to be cautious and not risk too much.
- A Sell Order with the Aroon and Bollinger Band Indicators.
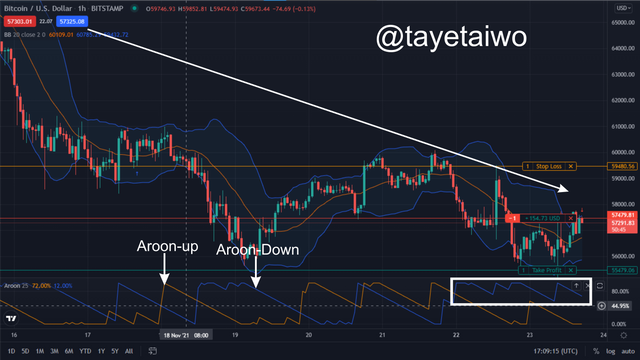
The image above shows an executed Buy order on the BTC/USD chart. for this trade, I made use of the Bollinger Bands and the Aroon Indicators to analyse and execute the trade.
Before I executed the trade I was able to identify the general Bearish market Trend. Then I discovered that the Aroon-Down indicator has already crossed above the Aroon-Up which indicates a Bearish signal, also I identified that the price of the crypto asset has made multiple breakouts below the middle SMA (simple moving average) which also signifies a Bearish movement.
With all these confirmations in check, I placed a Sell order for the asset with a risk management procedure of Stop-loss and Take-profit set at a ratio of 1:1, the essence is to be cautious and not risk too much.

Question (9)
State the Merits and Demerits of Aroon Indicator.

Merits of the Aroon Indicator
The Aroon Indicator provides good entry and exit points for the market.
The Aroon indicator can provide data or information on the strength or momentum of a Trend when either of its lines maintains a steady movement above the other for a period.
It cross-overs can help traders determine an emergence of a new Trend, this means that when its two lines(Aroon-Up and Aroon-Down) cross above each other they indicate or signal a change in Trends.
Demerits of the Aroon Indicator
Because the Aroon indicator is a lagging indicator it sometimes takes time to confirm or identify a trend thereby causing traders to miss out on good entry opportunities.
Price action will always affect the movement of the Aroon indicator because it will react to quick and short changes in market trends, thereby creating false signals which could be detrimental for traders.
During a ranging market the Aroon indicator always gives out false signals, that is why it is ideal to merge it with other indicators.

Conclusion

The Aroon indicator is a Technical analyses tool used to identify Market Trends, it is also used to identify entry points in the market.
The Aroon Indicator is made up of two lines called the Aroon-Up and the Aroon-Down. A cross over of the Aroon-Up and the Aroon-Down line above each other signals a Bullish or Bearish trend. The Indicator can also be used to know the strength or momentum of the trend if either of the lines maintains a steady movement above the other.
The indicator is prone to errors, therefore it's advisable to merge it with a leading indicator to achieve better outcomes during analysis.
Thank you professor @fredquantum for this great and mind-blowing course.