

Question (1)
Creatively discuss Keltner Channels in your own words.
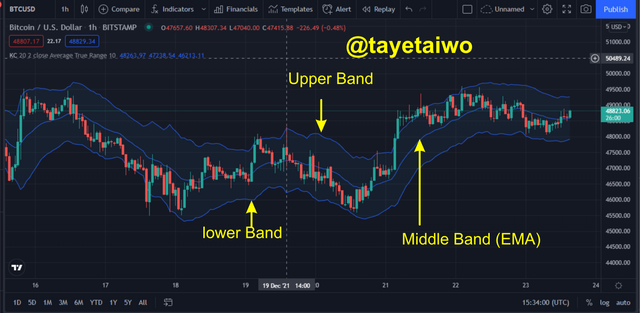
The Keltner Channel is a volatility based technical and analysis tool used to identify and measure volatility in the market. The indicator was first introduced by Chester Keltner in the 1960s, during this period the Keltner Channel made use of SMA or Simple Moving Averages, but after it was reviewed by Linda Raschke in the 1980s, the SMAs were replaced by two bands which are set above and below the EMA which is set at a default of a 20 period.
The Keltner Channel indicator is made of two bands which are above and below the EMA. Each of the bands placed above or below the EMA are times two of the ATR. The Keltner Channel can signal trend directions with the movements of the channel, breakouts of the price action out of the channel can also signal changes in trend direction, it can also be used to identify breakouts and trend confirmation.

Question (2)
Setup Keltner Channels on a Crypto chart using any preferred charting platform. Explain its settings. (Screenshots required).
- The first step is to visit a charting platform, and for this task, I will be using the Trading view.
- When the chart display is open, click on the indicator icon to bring out the list of inbuilt indicators on the platform.
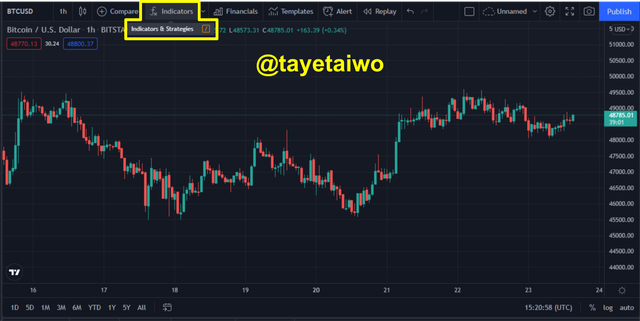
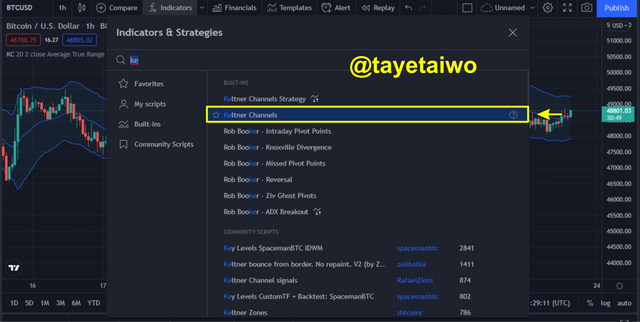
- The next step is to search for the Keltner Channel indicator and click on it to appear on the chart display.
- Below is how the Keltner Channel indicator looks like, it can be seen to have 3 lines that are made of one EMA line and two Bands.
- For settings and modification of the indicator click on the Settings icon.
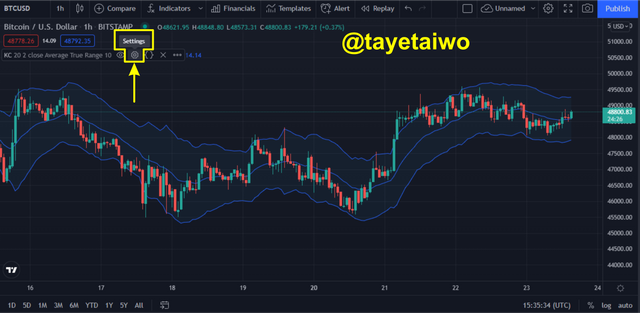
- The First setting option is the Inputs; this is where the user or trader is able to alter the periods and time frame of the indicator.
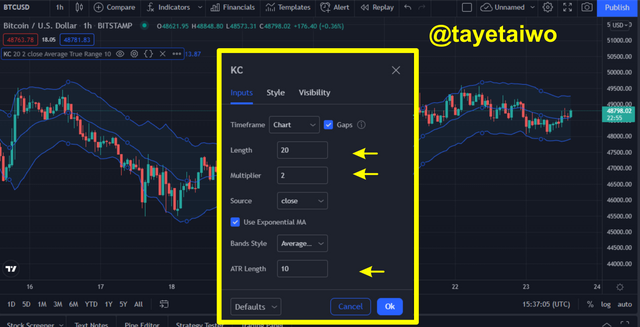
- The second setting option is the style which is where the trader can alter the colour of the Bands and EMA, also the background can be altered.
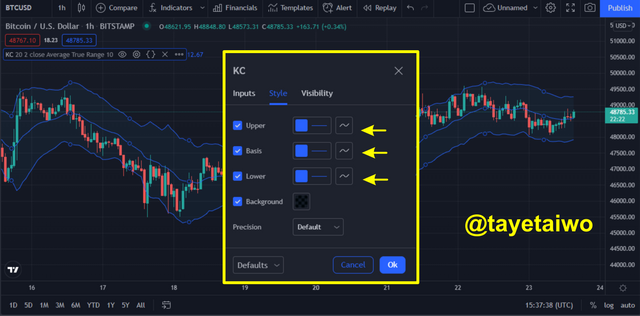

Question (3)
How are Keltner Channels calculated? Give an illustrative example.
The Keltner Channel indicator is calculated using the formula below.
Upper Band of the Keltner Channel = EMA+2 x ATR
Middle Band of the Keltner CHannel = EMA ( based on the period used)
Lower Band of the Keltner Channel = EMA−2 x ATR
Where:
EMA = Exponential Moving Average
ATR = Average True Range
For an illustration Keltner Channel formula, I will give an example below to be considered.
An ADA/USDT chart displays the following values:
EMA period = 15
ATR length = 5
Multiplier = 2
Therefore the Keltner channel indicator is calculated as follows:
Middle line/ EMA = 15 .
Upper band = 15 + (2 × 5)
Upper band = 15 + 10
Upper band = 25
Lower band = 15- (2 × 5)
Lower band = 15 - 10
Lower band = 5
The illustration given above it shows that the Keltner Channel band are making bullish movements.

Question (4)
What's your understanding of Trend confirmation with Keltner Channels in either trend? What does sideways market movement looks like on the Keltner Channels? What should one lookout for when combining 200MA with Keltner Channel? Combine a 200MA or any other indicator of choice to validate the trend. (Separate screenshots required)
- Trend Confirmation
Trend confirmation is an ideal prerequisite for every trader in order to be sure that the execution of their analysis for future trades are correct in order to increase their chances of success. The angle positions of the Keltner Channel indicator during its movement helps to determine the dominant trend. I will give illustrations below on the BUllish and Bearish trend confirmation.
- Confirmation for Bullish Trend
Trend confirmation using the Keltner Channel indicator is quite simple to understand. To confirm a trend the Keltner CHannel should make a movement in accordance with the price action, also the price action will be moving in between the Upper Band and the EMA, with the Upper band serving as resistance, while the EMA is serving as the support to price action.
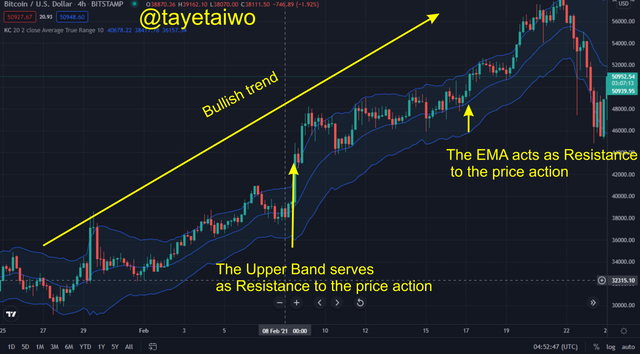
The image above shows an illustration that identifies a Bullish trend, the price action could be seen making movements between the upper band and the EMA while the Upper band serves as resistance to price and the EMA serves as support, also the Keltner channel is making an upward movement in accordance with the price action.
- Confirmation for Bearish Trend
For a Bearish trend confirmation, the Keltner CHannel has to make a downward movement in accordance with the price action, also the price action will be moving in between the EMA and the lower band with the EMA serving as resistance while the Lower band will serve as support to the price action.
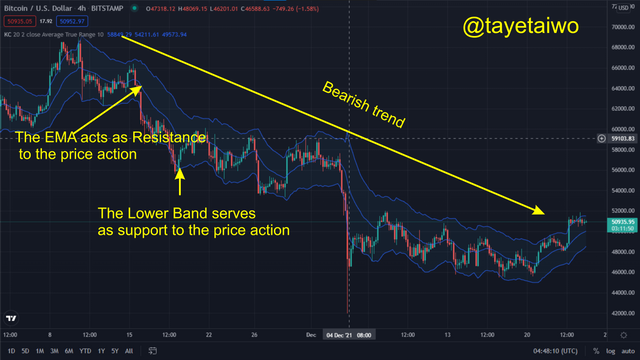
The image above shows a trend confirmation for a bearish trend, with the price action making movements in between the Lower band and the EMA with the EMA serving as resistance, while the Lower band serves as support to the price action.
- Keltner Channels on a Sideways market
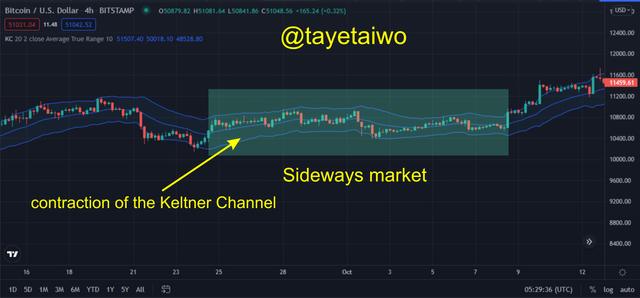
A sideways or ranging market is a situation where the price action moves in a sideways pattern without a particular trend being identified. This period is identified also with a presence of low volatility.
With the use of the Keltner CHannel indicator a sideways market can be confirmed or identified when the Keltner channel bands contract, also this period the price action will make upward and downward movement in between the bands of the indicator, with the upper band serving as the resistance and the lower band serving as support. A breakout of price above or below either of the bands will signal the emergence of a new trend.
- Combining the Keltner Channels with a 200 MA or another indicator
For a combination of the Keltner Channel and the 200 MA or Moving Average, it can be further used to establish a concrete confirmation of a trend.
- Bullish Trend
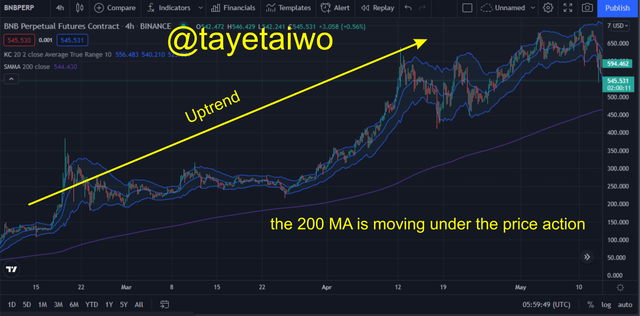
To confirm a Bullish trend using the 200 MA and the Keltner Channel indicator, the 200 MA has to move in an upward direction below the price action and the Keltner Channel indicator. Also, the price action should be moving in between the upper band and the EMA.
- Bearish Trend
For a Bearish trend, the 200 MA should be moving above the price action, while the price action should be moving in between the EMA line and the Lower band.

- Sideways or Consolidating market
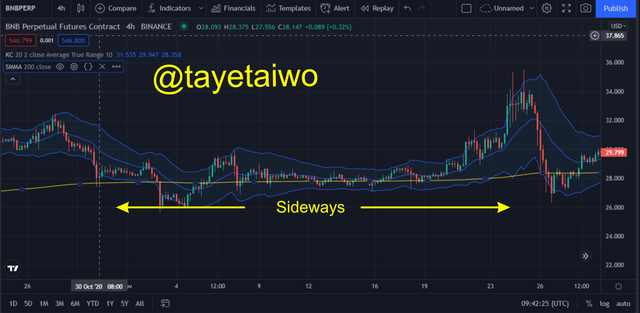
For a sideways market, the 200 MA would move in a horizontal fashion, while the Keltner Channel would also contract. The price action in this period would make movement in between the whole channel, the Lower and Upper band serving as its support and resistance respectively.

Question (5)
What is Dynamic support and resistance? Show clear dynamic support and resistance with Keltner Channels on separate charts. (Screenshots required).
Support and Resistance are the two most common words used in trading, it is a common terminology that is used to refer to levels where the price is unable to break above or below of. These levels are usually identified when we draw horizontal and vertical lines across the price action, this is usually done to identify the areas of potential breakouts or drawbacks in price action.
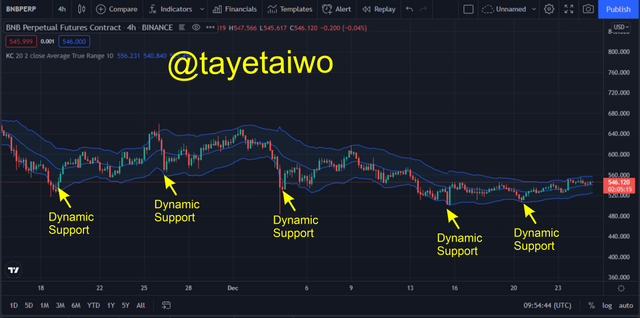
Dynamic Support and resistance are not so different from normal support or resistance, the only difference is that they can be identified diagonally and with the use of the Keltner Channel indicator these levels can be identified because the Upper and lower band all serve as Support or Resistance to the price action.
- Dynamic Support
The Dynamic support can be identified with the use of a Lower band line which automatically serves as support to price action, this can be seen in the image below where the price action is trying to break below the lower band.
- Dynamic Resistance
The upper band of the Keltner Channel indicator serves as a resistance to price action, this means that price will find it hard to break above it, and if it cannot then a bounce back or reversal would occur.
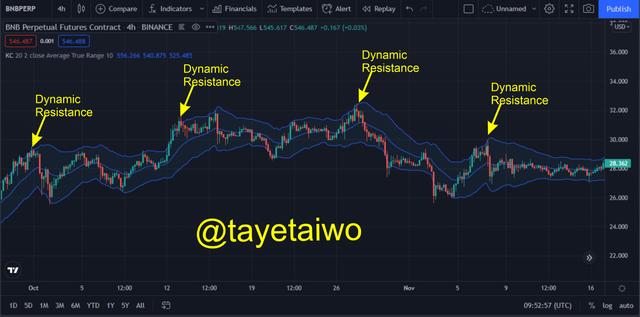

Question (6)
What's your understanding of price breakouts in the Crypto ecosystem? Discuss breakouts with Keltner Channels towards different directions. (Screenshots required).
- Price Breakout
Breakout in the crypto ecosystem is not so different from the Forex market, but the major difference is the presence of high Volatility in the crypto ecosystem. Breakout is the movement of price above or below a strong or weak resistance or support, this mostly happens after the market has consolidated and built up momentum, as a result of the huge traded volume of the crypto asset within a period, the price plunge above or below the support or resistance, thereby initiating a new trend.
- Bullish Breakout
The upper band of the Keltner Channel indicator serves as resistance to price action, therefore for a Bullish breakout to occur price needs to break and close over the upper band of the indicator. This would initiate the emergence of an Uptrend, this can be identified with the example of the screenshot below.
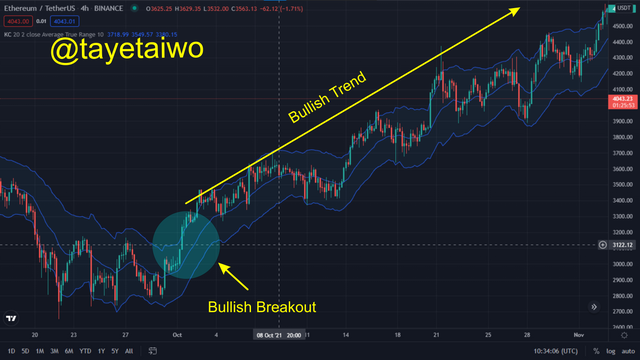
- Bearish Breakout
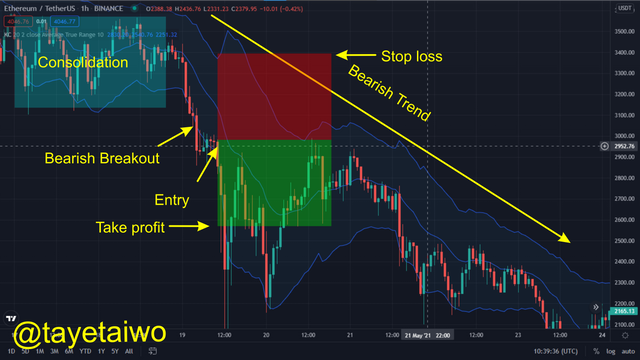
For a Bearish breakout to occur the price action needs to break and close below the lower band of the Keltner Channel which serves as support to the price action, this move below the indicator will then initiate a Bearish trend, this can be seen in the screenshot below.
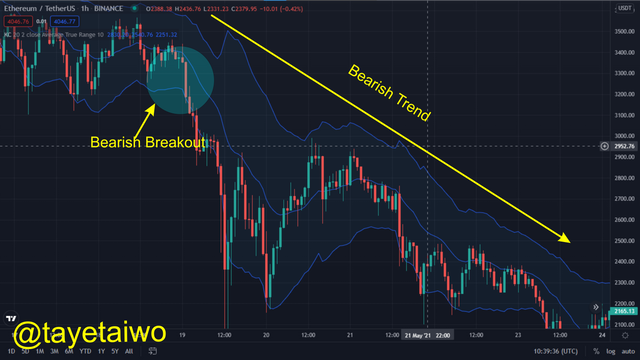

Question (7)
What are the rules for trading breakouts with Keltner Channels? And show valid charts that work in line with the rules. (Screenshot required).
Rules for a Bullish Trade Breakout
A Bullish breakout occurs after a sideway or consolidated market.
The Price action has to break above and close above the Upper Band which serves as resistance to the price action.
The Price movement should continue a sustained move above the EMA which should then serve as support to the price action.
When executing or making an entry, you can either wait for the price to retrace back to the support or EMA or for 2 to 3 candles to appear which would confirm the continuation of the trend. Risk management of 1:1 is ideal as a measure for risk management.
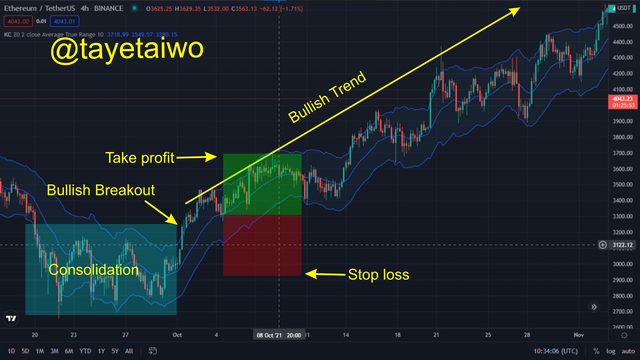
Rules for Bearish Breakout on Keltner Channels
The Breakout should occur after a sideways or consolidated market
The price action should break and close below the lower band which serves as the support level to the price action.
The Price action should continue a sustained movement in between the EMA and the Lower band, thereby establishing that the dominant trend is Bearish.
When making a sell entry into the market, the trader has to either wait for the price to retrace or wait for 2 to 3 candles to appear to establish that the dominant trend is Bearish. A 1:1 risk ratio should be used as a risk management measure.

Question (8)
Compare and Contrast Keltner Channels with Bollinger Bands. State distinctive differences.
| The Keltner Channel indicator | Bollinger Band Indicator |
|---|---|
| It was developed by Chester Keltner | It was developed by Jhon Bollinger |
| It makes use of upper and lower bands that are made up of 2x +/-ATR values | Its bands are made up of two SMA( simple moving averages)+/- (2 x Standard Deviation) |
| Its middle line is made of an EMA (exponential moving average) with a default of a 20 day period | Its middle line is made of an SMA line with a default of a 20 day period |
| It is not very sensitive to price action | It is very sensitive to price action |
The Keltner Channel and Bollinger Band indicator both serve the same purpose because they both have similar abilities in terms of identifying volatility, Breakouts, Trend confirmation. etc. But the Keltner Channel is less prone to error due to its low response to price action, unlike the Bollinger Band.

Question (9)
Place at least 4 trades (2 for sell position and 2 for buy position) using breakouts with Keltner Channels with proper trade management. Note: Use a Demo account for the purpose and it must be recent trade. (Screenshots required).
Buy Trade 1
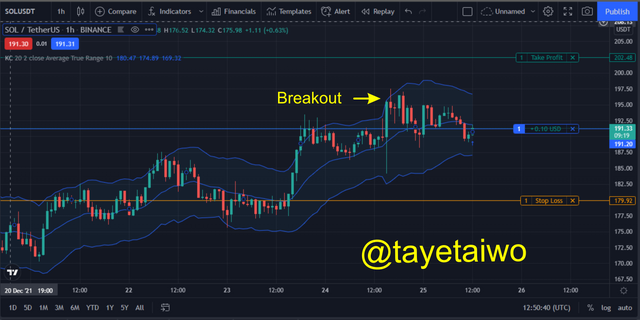
For the first buy trade, I sued the SOL/USDT pair to execute the trade. Before I executed the trade I noticed that price has already broken above the upper band, then I waited for the price action to retrace back to the EMA before making an entry, I then used a 1:1 risk ratio as a risk management measure for the take profit and stop loss.
Buy Trade 2
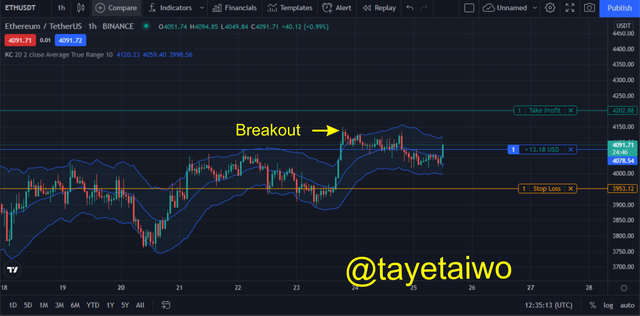
For the second buy trade, I used the ETH/USDT pair. Before I executed the trade I made sure that the price has already broken above the upper band as shown below in the screenshot, then I waited for the price action to retrace before making an entry. For this trade, I used a 1:1 ratio as my risk management measure for the take profit and stop loss.
Sell Trade 1
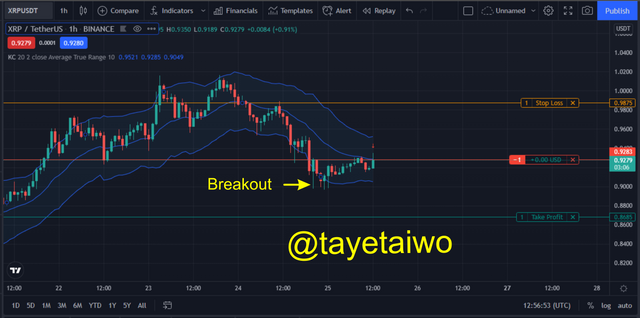
For this trade, I made use of the XRP/USDT. Before I executed the trade I made sure that the price action broke below the lower band which serves as a support for the price action, after the breakout occurred I then waited for the price to retrace back to the EMA line before making an entry. I used a ratio of 1:1 as my risk management measure for the take profit and stop loss.
Sell Trade 2
For the second trade, I used the AVAX/USDT pair. Before I made an entry I made sure that the price broke below the lower band which serves as support to price action, then I waited for the price to retrace back to the EMA line before making an entry. For this trade, I made use of the 1:1 ratio as my risk management measure for the take profit and stop loss.
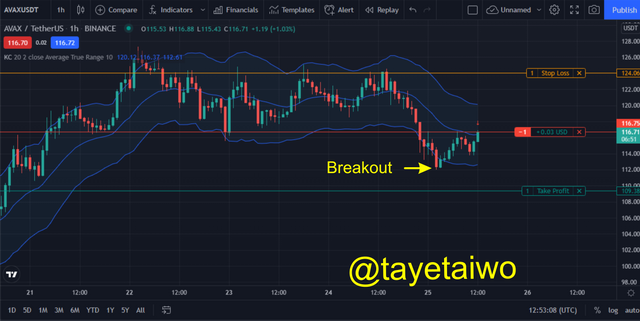
Below are the current outcomes of the trade and evidence of their execution.


Question (10)
What are the advantages and disadvantages of Keltner Channels?
Advantages of Keltner Channels
- It is very helpful when used to identify breakouts.
- It is a very helpful technical tool that can be used for trend confirmation
- The indicator is very simple to comprehend
- It is very good for signal identification in a trending market
Disadvantages of Keltner Channels
- It reacts to volatility in the market very fast, thereby making it prone to error.
- They cannot be used as a stand-alone indicator
- The indicator is useless in a ranging or sideways market.

Conclusion
The Keltner Channel indicator is a volatility based indicator that was developed by a technical analyst called Chester Keltner in the 1960s, although it was later revised by Linda Raschke in the 1980s. The Indicator formally used SMA lines but after it was revised it began to use 2 x +/- ATR values as its two bands, also it began to use the EMA as its middle line.
The Bands serve as Dynamic support and resistance to price action during a ranging market but during a trending market, the Upper band and the EMA serve as resistance and support respectively during a Bullish trend while the Lower band and EMA serve as support and resistance respectively during a Bearish trend.
The indicator best works for a trending market and its reaction to price action is very low. the indicator cannot be used as a stand-alone therefore it is ideal to merge it with other leading indicators to achieve the best result.