

Question (1)
In your own words, explain your understanding of On-Balance Volume (OBV) Indicator.
The OBV indicator is a momentum technical analysis tool that uses the flow of Volume to predict the buying or selling pressure of the market. The OBV indicator was first developed by a technical analyst called Joseph Granville in his 1963 book called Granville's New Key to Stock Market Profits.
The OBV uses the Volume of either the buying or selling pressure to predict the outcome of the assets price, this means that the OBV can identify the public interest towards an asset that could be negative or positive, based on the flow of the volume in either direction of the market.
The OBV helps traders to identify when the big players are present or absent in the market because large investors have the ability to alter the market when they start making an entry into the market either on the selling or buying side, an example of this was during the bitcoin bull run early 2021, the then Tesla CEO announced that the company will go into the purchase of bitcoin shortly after the announcement there was a huge increase in the buying volume of the BTC, this helped to fuel the bull run and setting the BTC up to $63k.

Question (2)
Using any charting platform of choice, add On-Balance Volume on the crypto chart. (Screenshots required).
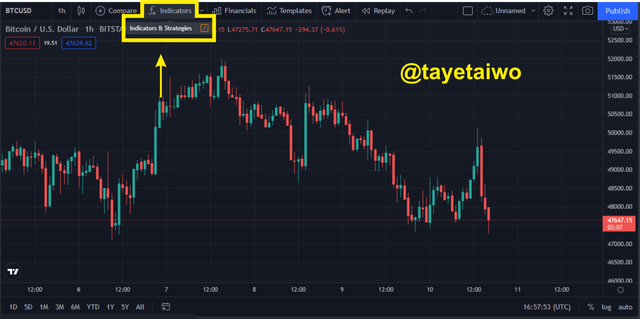
- The First step is to visit a charting platform, for this task I will be using the Trading View charting platform, then click on the indicator icon to bring out the list of all the inbuilt indicators of the platform.
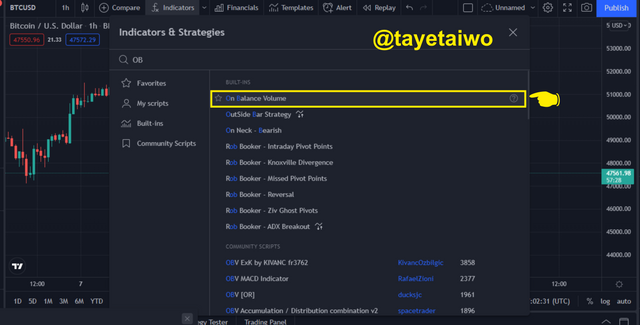
- The next step is to search for the OBV indicator by putting in the name on the search bar, then clicking on the indicator.
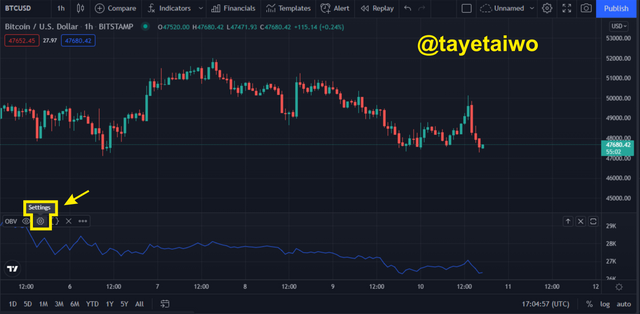
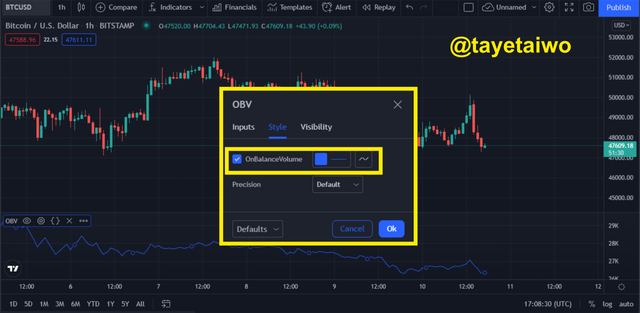
- After clicking on the indicator it will automatically appear on the chart display area, then if you want to modify or alter its settings click on the settings icon on the down left corner of the chart view.
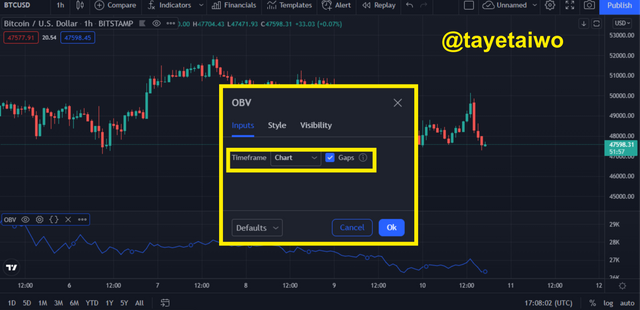
- After clicking on the settings a popup box that contains Input and Style modification options will appear, by clicking on the inputs you can be able to change the time frame of the indicator, also by clicking on the Style you can also be able to change the colour of the indicator.

Question (3)
What are the Formulas and Rules for calculating On-Balance Indicator? Give an illustrative example.
The OBV indicator requires various formulas because of the variations between the current and previous closing day prices. below are the three scenarios involved with the OBV indicator.
OBV = Previous Days OBV + Current Day volume
This formula is used if the current or present-day close is greater than the previous day close, this means that the current candle is bullishOBV = Previous Days OBV - Current Day volume
This formula is used when the current or present-day close is less than the previous day close, this means that the current candle is bearish.OBV = Previous Days OBV
This is used when the current or present-day close is equal to the previous day close.
Let's take for example a five-day closing period price of an asset.
- Day 1: Closing price = $40, Volume = 800,000
- Day 2: Closing price = $45, Volume = 805,000
- Days 3: Closing price = $42, Volume = 802,000
- Day 4: Closing price = $46, Volume = 805,000
- Day 5: Closing Price = $46, Volume = 807,000
To calculate the data given above, thus;
- Day 1 OBV = 0
- Day 2 OBV = 0 + 805,000 = 805,000
- Day 3 OBV = 805,000 - 802,000 = 3000
- Day 4 OBV = 3000 + 805,000 = 808,000
- Day 5 OBV = 808,000

Question (4)
What is Trend Confirmation using On-Balance-Volume Indicator? Show it on the crypto charts in both bullish and bearish directions. (Screenshots required).
Trends are the directions a market can take it could be a Bullish or Bearish trend. Every trader is on the lookout for the emergence or confirmation of a trend and with the OBV indicator, a trader can identify or verify an already occurring trend.
- Bullish Trend and the OBV Indicator
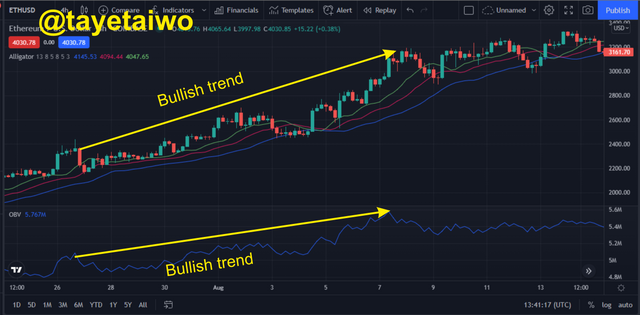
The OBV indicator can be largely influenced by the buying pressure of the market, thereby making the indicator steer in the same direction as the price action of the underlying asset. A trend confirmation by the OBV Can be identified when the OBV line makes continuous bullish movement or makes higher high and higher low movements, just as indicated in the screenshot below.
- Bearish Trend and the OBV indicator
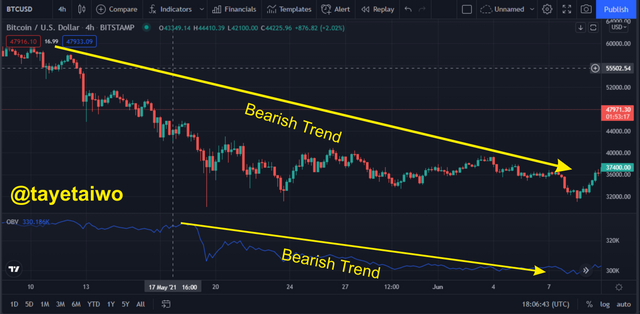
The OBV indicator can be influenced by the selling pressure of the market, therefore making the indicator tilt in the same direction as the price action, but a trend confirmation can only be verified by the OBV indicator when its lines make a continuous bearish movement or makes a continuous lower low and lower high pattern, just as indicated in the screenshot below.

Question (5)
What's your understanding of Breakout Confirmation with On-Balance Volume Indicator? Show it on crypto charts, both bullish and bearish breakouts (Screenshots required).
First, I would like to explain what a breakout is, it is a situation that occurs when the market has consolidated over time(this means there is no present occurring trend), during this period traders are on the lookout for the emergence of a new trend which could go in either direction, but before that trend can occur, it has to breakout above the resistance for a Bullish trend to occur or below support for a bearish trend to occur.
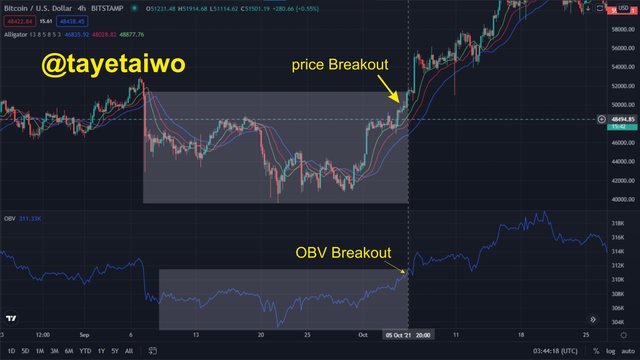
A Bullish breakout confirmation can occur when the price successfully breakout above the resistance level after the market has consolidated over time, the OBV indicator reacts to the price action during the consolidation, but most importantly the OBV moved in a corresponding direction with the price action during its breakout, thereby confirming the Breakout. This indicates the massive buying pressure in the market.
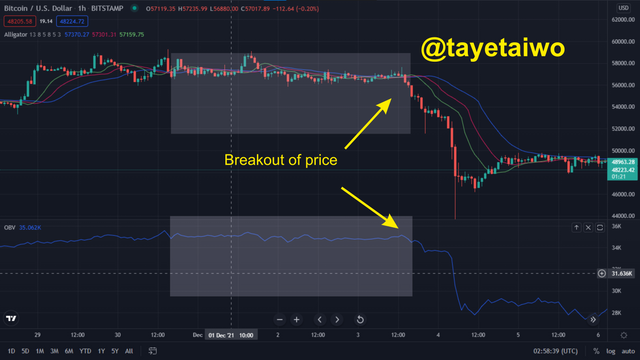
For the OBV indicator to confirm a Bearish breakout, the PBV line has to move correspondingly with the price action during consolidation and most importantly during the breakout of the price below the support level. This indicates the massive selling pressure that is active in the market.

Question (6)
6 Explain Advanced Breakout with On-Balance Volume Indicator. Show it on crypto charts for both bullish and bearish. (Screenshots required).
As I explained above that a Breakout is the emergence of a bearish or bullish trend after the consolidation of a market over time. For an advanced breakout to occur in regards to the OBV indicator, the OBV indicator would first identify the Breakout before the price action will be able to make the move. This means that a breakout below support or above resistance will occur in the OBV indicator before it occurs on the price action.
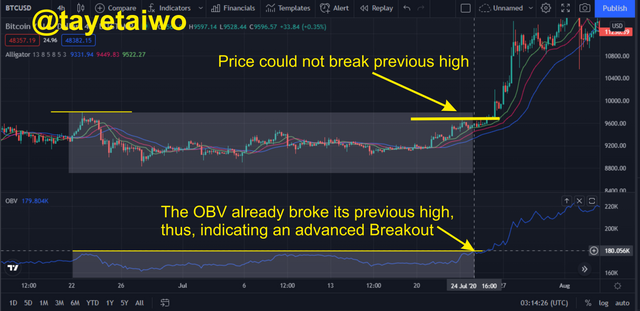
An Advanced Breakout above resistance can be identified with the OBV indicator, this is possible because the OBV indicator can react or detect a huge buying pressure before the price action can make its move towards the breakout. AS seen in the image above the OBV has already crossed above its previous high before the breakout could occur in the price action.
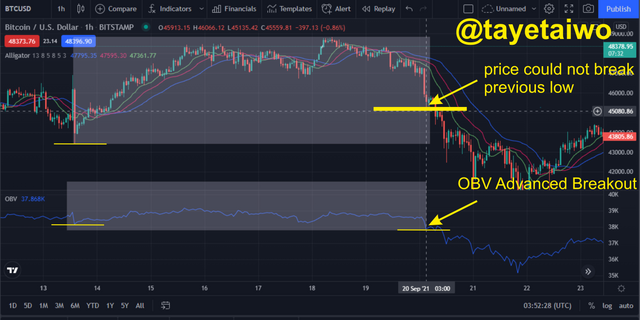
For the Advanced breakout to be identified by the OBV indicator, its current low should surpass its previous low before the consolidation, this means that the OBV line should break below its resistance first before it is evident in the price action. As seen in the image above the price action could not break below support, but the OBV indicator line has already moved below its support.

Question (7)
Explain Bullish Divergence and Bearish Divergence with On-Balance Volume Indicator. Show both on charts. (Screenshots required).
Divergence is a very useful strategy that can be used to detect a reversal in price movement or the exhaustion of a particular trend movement.
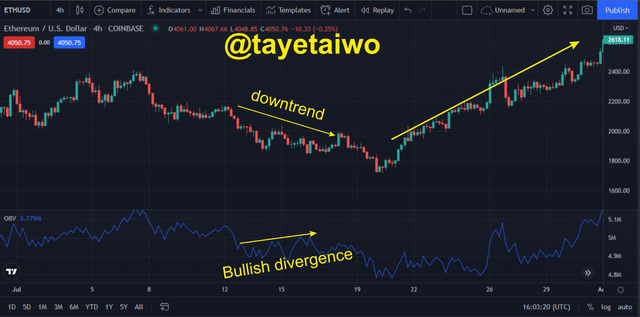
For a Bullish divergence to occur using the OBV indicator, the OBV which has an oscillating line has to make a to make higher highs and higher low movement, while the price action makes a bearish movement, this indicates that there is an increase in the volume of buyers entering the market and soon there will be a reversal in the trend.
The image of the ETH/USD shows a clear example of the situation, here the OBV makes higher high movements while the ETH/USD pair was still on the bearish trend. This could indicate that the occurring trend has been exhausted of sellers.
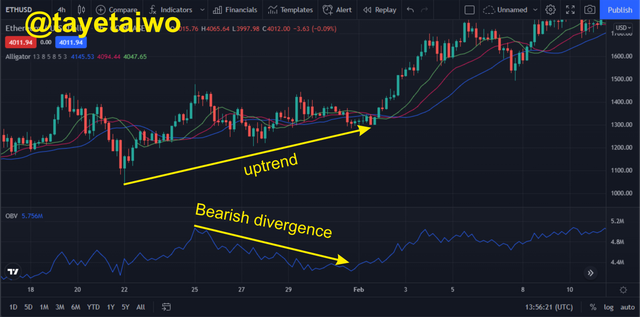
The Bearish divergence also occurs in a situation where the OBV indicator makes lower low and lower high movements, while the price action makes a bullish movement. This means that there is an influx of selling volume which will in o time alter the trend movement.
The image of the ETH/USD shows a clear example of the situation, here the OBV makes lower low and lower high movements while the ETH/USD pair was still on the bullish trend. This shows that there could be a reversal in trend or that the occurring bullish trend has been exhausted of buyers.

Question (8)
Confirm a clear trend using the OBV indicator and combine another indicator of choice with it. Use the market structure to place at least two trades (one buy and one sell) through a demo account with proper trade management. (Screenshots required).
To carry out this task I will be combining the OBV indicator with the Alligator Indicator. The Alligator indicator will help me to verify entry points and also confirm trend movements.
- BUY ORDER
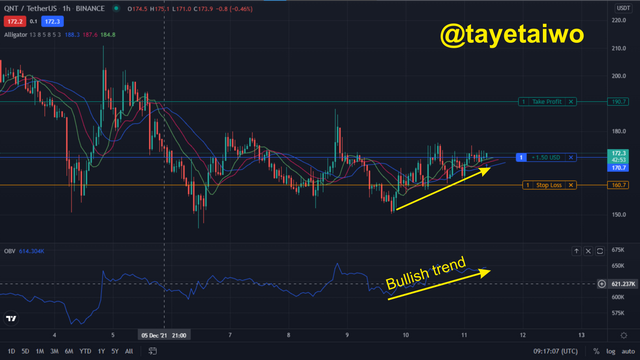
For a buy order, I used the QNT/USDT pair. From the image below, the OBV indicator is seen to be making higher high movements, this indicates a high buying pressure is entering the market. Also, the Alligator indicator corresponds to the OBV indicator with the Alligator lips/green line making a move above the Alligator teeth/red line and Alligator jaw/ blue line, this confirms the emergence of a Bullish trend, therefore I placed a buy order with a risk management ratio of 1:2 as my Stop Loss and Take Profit.
- SELL ORDER
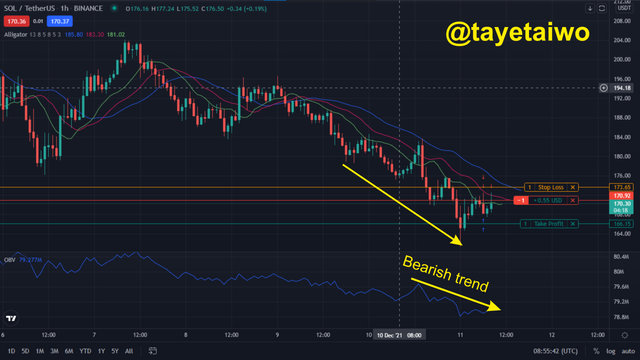
For the sell order, I used the SOL/USDT pair. From the image below the occurring trend in the market is the Bearish trend and this was confirmed by the OBV indicator which made lower low and lower high movement, thereby indicating a huge selling pressure in the market. The Alligator indicator also confirmed the bearish trend, with its jaw/ blue line making moves above the Alligator teeth/red line and the Alligator lips/green line, this confirms the emergence of a continuous bearish movement. Therefore I executed a sell order with a risk management procedure of the take profit and stop-loss set at a ratio of 2:1 respectively.

Question (9)
What are the advantages and disadvantages of On-Balance Volume Indicator?
Advantages
The OBV indicator is used in the confirmation of trends.
The OBV indicator can help identify the amount of buying or selling volume that is injected into the market at a specified period.
The Indicator has a very simple structure and it is easy to comprehend.
The OBV indicator can be used to identify divergence and breakouts in price action.
The Indicator can be combined with another indicator to produce better results.
Disadvantages
It is a leading indicator which means that it can be subject to making errors due to low volatility or manipulation in the market
The OBV indicator cannot be used as a stand-alone indicator because therefore it has to be merged with other indicators.
Huge influx of selling and buying volume within a short period can deter the indicator, thereby creating false signals.

Conclusion
The OBV indicator is by no doubt a good indicator because it helps traders to confirm trends, identify breakouts and spot divergence in the market. The Indicator is a leading and momentum indicator that makes use of buying and selling pressure to predict the direction of the market.
The indicator is also sometimes prone to errors due to high volatility in the market, this is because the indicator is a leading indicator and it can be deterred by the huge influx of buying or selling pressure within short periods, this is why it is ideal to merge the indicator with a lagging indicator to get the best result, also with a good risk management procedure a trader will b able to minimize risk.
Thank you professor @fredquantum for this insightful lecture.