
Introduction

Friends, I hope you're all doing well. This week we have seen another beautiful lecture from a different professor, and today I attended the lecture of professor @allbert. After reading and digesting his lecture, I will be doing justice to his homework task, in which I will explain the concept and mechanics of Trading with Accumulation / Distribution (A/D) Indicator. I hope you enjoy and learn from my assignment.

Q1. Explain in your own words what the A/D indicator is and how and why it relates to volume?

While trading, we can make use of various of indicators. The mathematical formulas for each indicator are different. While some of these indicators make future predictions based on past price trends, others analyse lagging price movements to give us an insight of the market's trend.
The A/D indicator is a volume based Indicator, as the name implies this type of Indicator shows the the accumulation and distribution of the asset. The A/D Indicator make use of the relationship between the stock's price and the volume flow to help determine the trend of a currency or stock this will aid the trader to make the best investment decisions.
Accumulation simply refers to the rate at which people are purchasing the asset (demand), i.e., people are purchasing the item and keeping it, causing the asset's price to rise (Bullish). Distribution on the other hand, refers to the rate at which people sell their assets, causing the price to fall (Bearish).
As I previously indicated, this A/D indicator forecasts price movements based on volume changes. The A/D indicator was invented by a trader called Marc Chaikin with the goal of determining money movement in and out of an asset.
When viewed graphically, it is simple to comprehend: the indicator's line is situated directly below the price of the asset in question, and it moves up and down on a scale on the right side of the screen.
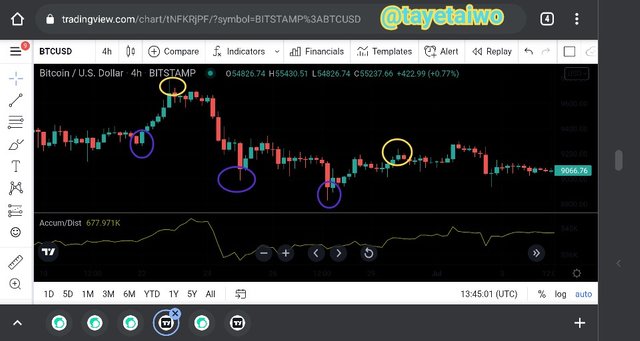
From the above Chart, the zones I outlined in green are the distribution zones, whereas the zones in yellow circles are the accumulation zones. The price of the asset are high in distribution zones, and traders want to sell their assets off while the price is low in the Accumulation zone, and traders are more likely to buy.
How it Relates to Volume
The A/D indicator uses it past and present value to denote it's indication, the Indicator shows divergence between the price and volume by combining both the volume and price. The A/D indicator is calculated with a formula;
A/D = Previous A / D + Current Period's Money Flow Volume
Money Flow Volume = Money Flow Multiplier X Volume for the Period
Money Flow Multiplier = ((Close-Low)-(High-Close))/((High-Low))
Where Close = Closing Price
Where Low = Low Price
Where High = High Price
Looking at the formula, to calculate the A/D Indicator we will surely need the money flow volume, and to get the money flow volume we have to multiply the money flow multiplier by the volume for the period, to get the money flow multiplier we need to minus the close from low, then subtract from the result of high minus low and divide by the high minus low. You can see from the illustration how volume is related to A/D Indicator.
Advantages of the A/D Indicator
- The A/D Indicator can help traders or investors predict trend reversals when there is a split in price movement and the A/D line.
This indicator allows traders to understand the current market position. For example, distribution indicates that the seller is in control and that now is the best time to purchase, whereas accumulation indicates that the buyer is in control and that now is the best time to sell.
Another advantage of the A/D indicator is that it may be used to track the money flow into and out of a particular asset, for instance, if the A/D line goes up, it suggests a money inflow, indicating increased purchasing pressure; if it goes down, it indicates a money outflow, indicating an increased selloff.
Disadvantages the A/D Indicator
- The A/D indicator has its own disadvantages, such as the fact that it does not indicate minor price changes from one period to the next, which might lead to irregularities.
- Another disadvantage of the A/D indicator is that the line of the Indicators moves using the data of the closing prices, which means that the breaches are not taken into account because they do not appear on the A/D indicator line.

Q2. Through some platforms, show the process of how to place the A/D Indicator (Screenshots needed).

Steps Involves In Adding The Accumulation/Distribution Indicator On The Chart.
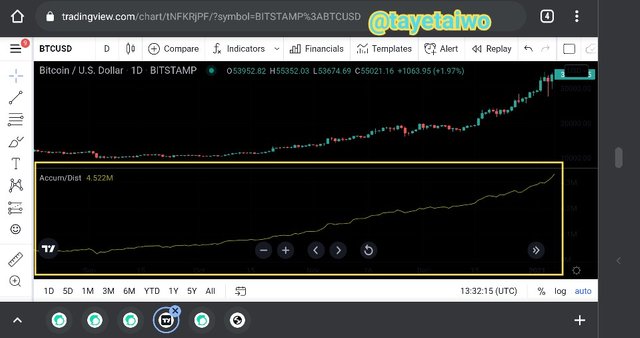
In the section of the task, I will be showing the steps involved in adding the A/D indicator to BTC/USD chart on Tradingview.
Step 1: Visit the Tradingview, search for BTC/USD and open the chart.
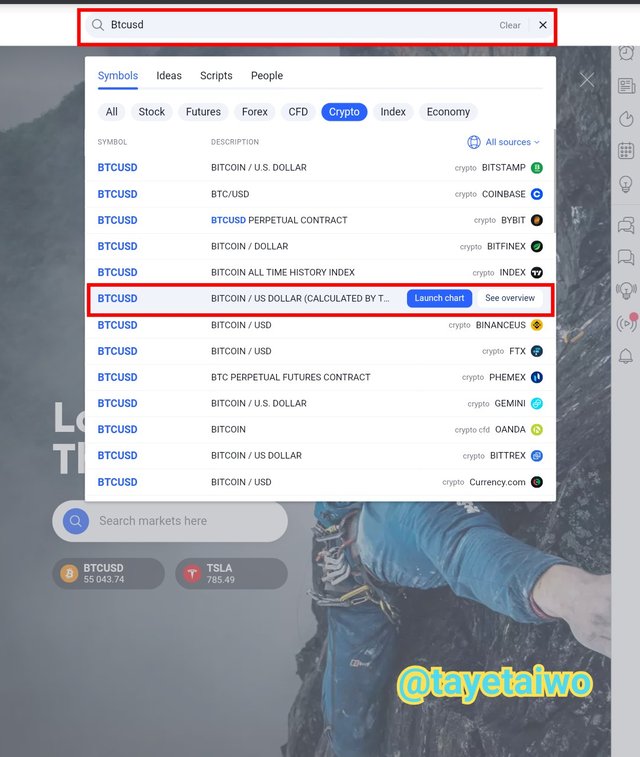
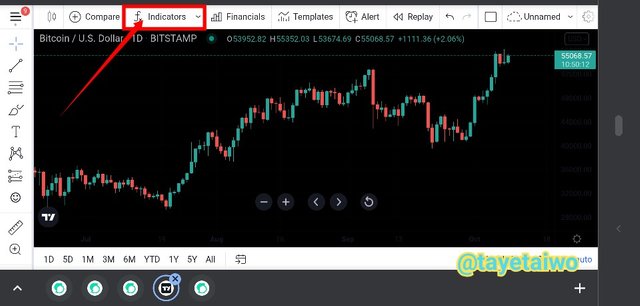
Step 2: On the chart locate the Fx and click on it.
Step 3: Now search for the AC and the Accumulation/Distribution Indicator will pop up, then select it.
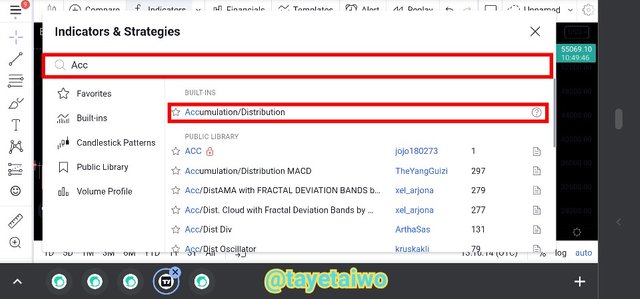
Congratulations you have successfully added the Accumulation/Distribution Indicator to BTC/USD chart on Tradingview

Q3. Explain through an example the formula of the A/D Indicator. (Originality will be taken into account).

We've already outlined that the A/D indicator is a volume-based indicator that traders and technical analysts can use to show the trend of an asset utilizing the relationship between its price and volume flow. We also talked about how accumulation represents the buying zone and distribution represents the selling zone.
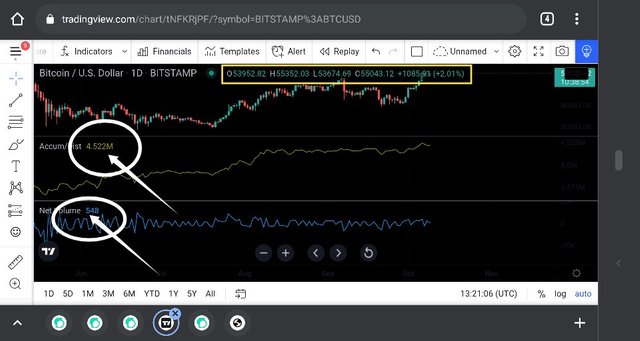
Now with the above chart, using the formula I stated at the beginning.
Previous A/D = 4.522
Volume = 54B
Closing price = 55043.12
Low price = 53674.69
High price = 55352.03
Now let calculate the Money Flow Multiplier, which is Money Flow Multiplier was Money Flow Multiplier = (Close-Low)-(High-Close)/ (High-Low).
The formula of Money Flow Multiplier was Money Flow Multiplier = (55043.12-53674.69)-(55352.03-55043.12)/ (55352.03-53674.69).
Money Flow Multiplier = 1368.24
Let proceed to the calculation of Money Flow Volume, which is Money Flow Volume = Money Flow Multiplier X Volume for the Period.
= 1368.24 X 54
Money Flow Volume = 73844.9
Finally, the A/D which is the A/D = the previous A/D + Current Money Flow Volume
= 4.522 M + (73844.9)
The A/D = 4,595,844
Now you need to continue to calculate till you reach the period you want, all you have to do is to be using the Money Flow as the first value and you are good to go

Q4. How is it possible to detect and confirm a trend through the A/D indicator? (Screenshots needed)

The primary functional of the A/D indicator is that it aids in predicting the volume flow direction. Thereby assisting the trader in determining the future trend of an asset's . After adding the indicator to our chart, we can check the asset's trend by looking at the direction of the indicator and the price movement.
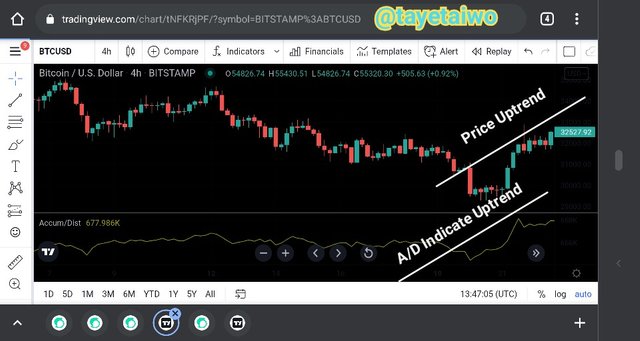
Using the A/D Indicator to confirm a price Trend of an Asset (Bullish)
When the price of an asset goes up and the line of the A/D Indicator moves up, it simply implies that money is flowing into the asset, and traders are buying the asset, indicating that the asset is in high demand (buying). As a result, accumulation has occurred or is occurring this implies a bullish trend.
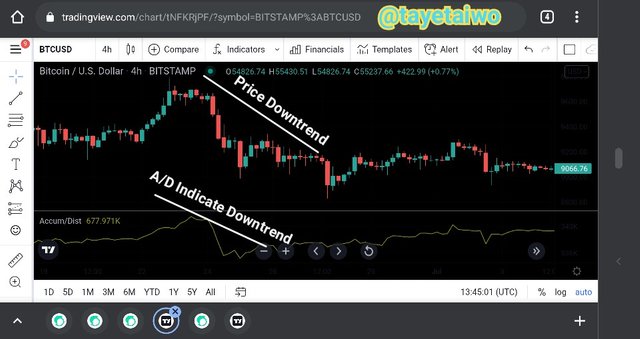
Using the A/D Indicator to confirm a price Trend of an Asset (Bearish)
When the price of an asset drops and the A/D Indicator line drops, it simply means that money is leaving the asset and traders are selling or dispersing it, implying that the asset is no longer in demand. As a result, distribution has taken place or is taking place, implying a bearish trend.
In addition, the A/D Indicator can also be used to predict a possible trend reversal, Whenever there is the price movement of the asset and A/D line are different. For intance If the price of an asset is going up while the A/D line is gojngy down, this indicates the end of the bullish trend and the beginning of a bearish trend; this reversal indicates money is leaving the asset.
Not forgetting, If the price of an asset is going down while the A/D line going up, this indicates the end of the bearish trend and the beginning of a bullish trend; this reversal indicates money is flowing into the asset.
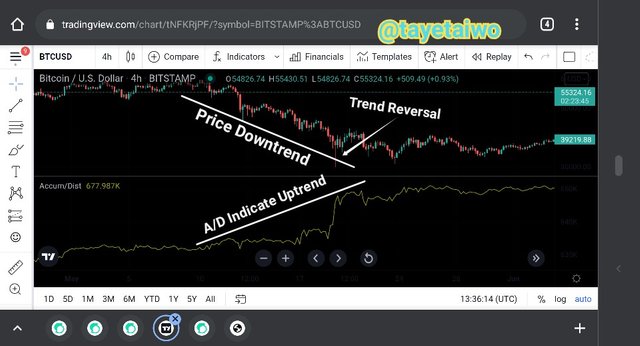
The chart above shows a difference in the direction of the asset's price and the direction of the A/D Indicator; you can see that the price is going down while the A/D line is going up, indicating that money is flowing into the asset. This is a trend reversal and it implies that the price trend of the asset reversed from bearish to bullish.

Q4. Through a DEMO account, perform one trading operation (BUY or SELL) using the A/D Indicator only. (Screenshots needed).

In this section of task I will be making use of the Tradingview website to perform Buy order on XRP/USDT
It wasn't an easy task, manage to get a good position after spotting a trend divergence.
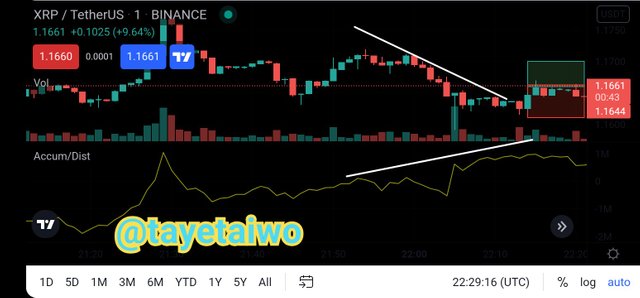
From the above Chart, the price of XRP is going down and the A/D indicate uptrend this implies that they will be a trend reversal from a bearish to a bullish so I quickly position myself to buy and set my stoploss below the lowest price. I decided to take my profit at the price that is higher than the price I bought it.
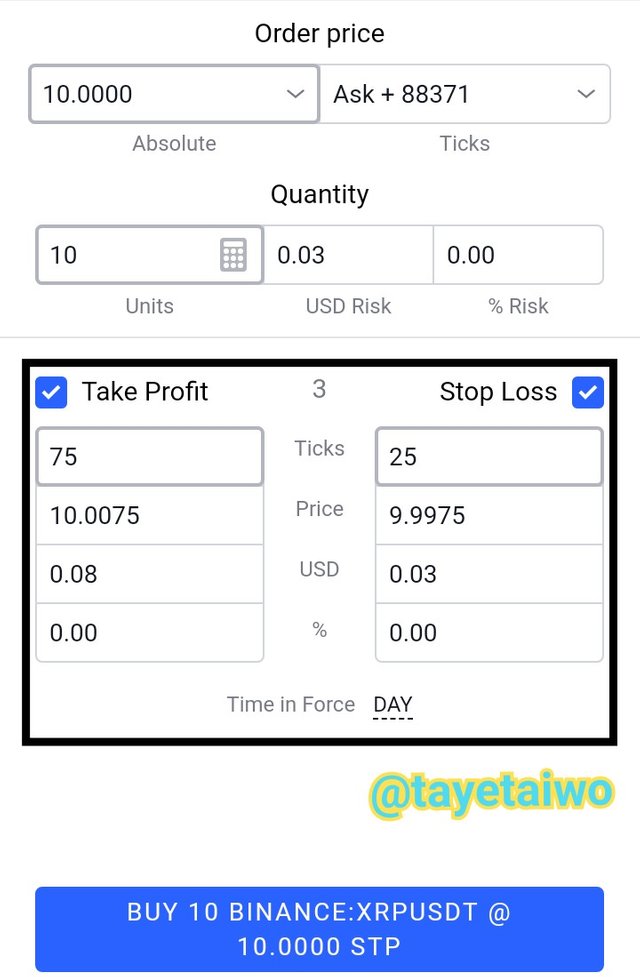
I hope I've been able to justify myself in this section of task, I would like the professor to please elaborate more on this, I will surely appreciate sir, thank you for understanding

What other indicator can be used in conjunction with the A/D Indicator. Justify, explain and test. (Screenshots needed).

While indicators might assist us in making a good trading forecast, they can also provide erroneous indications when used alone. One of the disadvantages of the A/D indicator is that it does not indicate minor movement. As a result, it would be beneficial to combine the A/D indicator with another indicator to ensure that the two indicators confirm or predict the same trend. This will assist traders or investors in making the best decision possible.
In this section of the task, I'll combine the A/D indicator with the RSI indicator, which is a momentum oscillator that shows when an asset is overbought or oversold. This combination is a great way to ensure accurate trend prediction and pick our false or fake signal.
In RSI Indicator the scale of 0-30 shows an oversold while 70-100 shows an overbought.
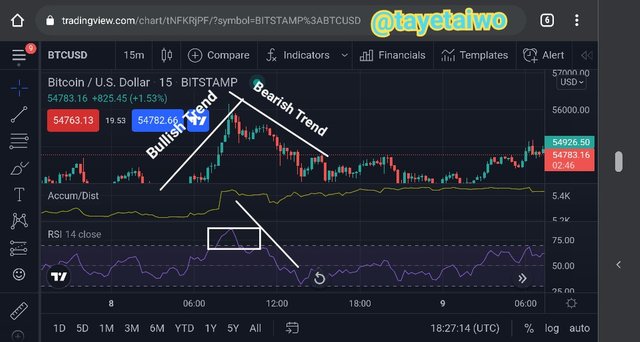
As shown in the above Chart, the asset's price trend is bullish (uptrend) until it reaches overbought levels. The asset was overpriced at this point since the price trend had reached its apex. As a result, we might expect a possible trend reversal, which was recently observed with a bearish movement (downtrend), i.e. the price of the asset started dropping.
With the combination of the A/D indicator and the RSI Indicator traders or Investors can readily predict or forsee the market trends and take early trade positions for profiteering.

Conclusion

A/D indicator is a type of indicator that traders use to determine an asset's accumulation and distribution phases. When money flows in and out of an asset, this indicator indicates it. The Accumulation zone indicates greater buying activity, whilst the Distribution zone indicates more selling activity. The A/D indicator is commonly referred to as a volume-based indicator because it uses both price and volume.
The A/D Indicator, like any other indicator, has several shortcomings, one of which is that it does not detect slight price movement, resulting in no signal. Combining the A/D Indicator with other indicators like the RSI Indicator will assist in identifying fake and false signals as well as confirming the accurate trend prediction.
Professor @allbert, thank you for bringing up this fantastic lecture. I learned a couple of things from this excellent lecture, one of which is how to properly combine the A/D Indicator and the RSI Indicator to confirm a trend movement.
I eagerly anticipate your next course, sir, and may God bless you and all the readers.
Hello @tayetaiwo Thank you for participating in Steemit Crypto Academy season 4 week 5.
Downvoting a post can decrease pending rewards and make it less visible. Common reasons:
Submit
Note sir.
Thank you so much for the correction, I will work better next class.
Downvoting a post can decrease pending rewards and make it less visible. Common reasons:
Submit