Hello Prof @dilchamo.
It is good to be back to the academy after a long time of break and also to be a part of your first class as a professor. I congratulate you on your promotion and I look forward to always be a part of your homeworks.
Without wasting much time, let me shed some lights to the questions you have asked to test my understanding of the subject you taught.
In the world of cryptocurrencies, there are basically two ways the information of the price is represented for traders to see. These are bar charts (candlesticks) and jointed lines. Every trader interprets the price of an asset according to the information presented on any of this charts and take decisions on their trades. The most used is the candlestick but this time, we want to familiarize ourselves with the line charts.
Define Line charts in your own words and Identify the uses of Line charts.
A line according to the Mariam Webster Dictionary is:
A long narrow mark on a surface or an area or bother that separates two places.

Line chart is a jointed/segmented graphical representation of the price of a cryptocurrency asset that shows periods of bulls and bears.
In my definition, I used the word jointed/segmented to describe the line chart because the line chart joins the bulls period and bear period, with an indication of when the period started.
For instance, in a line chart, when an asset is in an uptrend, the line will accordingly be drawn in the upwards direction until the trend changes. Once it does, the price close and the asset will start to move in a downtrend. No matter how long it takes for any of this trend to continue, what will be noticeable on the chart is when the price closes. No extra line will be drawn separately to continue a trend or to change it.
A line chart is not only a straight line. It can take a zig-zag form, a V-shape, a U-shape, or be curved. It's shape depends on the movement of the price. Based on the shapes the line chart takes at any given time, it can be used to:
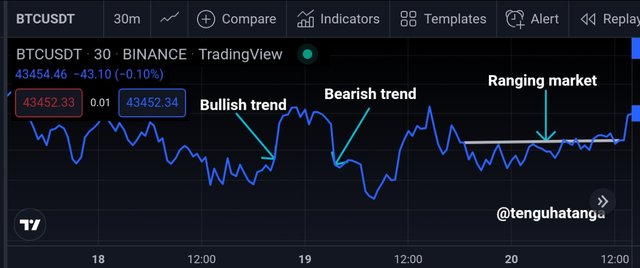
Determine the direction of the trend.
The direction the price moves is the direction the line chart is drawn. The line can be drawn towards and an upwards or downward direction depending on the direction of the price.Determine when the market is ranging.
A ranging market is a market that has do defined direction. It can happen in a downtrend or an uptrend and take a somewhat straight but zigzag form.Determine the closing price of the asset.
On the line chart, the price closes when the asset turns to move in another direction. You will often see a pointed end of the line, showing where the movement in that direction stopped.
How to Identify Support and Resistance levels using Line Charts (Demonstrate with screenshots)
The levels of support and resistance are very important in an trading trading strategy. This are important points that determine the success of trades, giving them utmost importance in every technique adopted to trade.
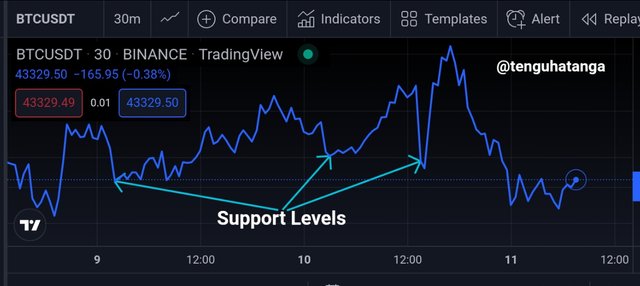
A support level is a point where buyers have purchased more of an asset and thereby pushing the price up. It is the level where the price of an asset cannot go further down. At this point, selling is weak but there is usually a strong buying in the market. The points of support on line chart is easily identifiable because of the shape formed. I call this shape a V-shape. For there to be support, the price of the asset mut have been in a decline. So when buyers push the price up, the line is drawn in the upward direction, there is an drastic upward movement, making it form a V-shape. A support level today can become a level of resistance in the future if the asset falls beyond this level.
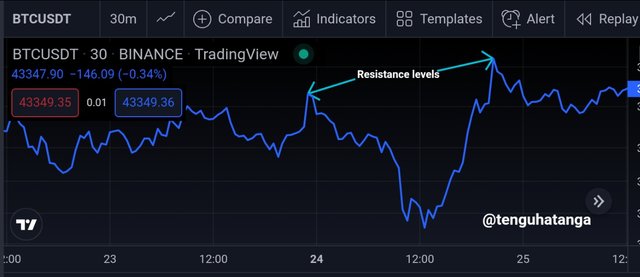
Resistance level is the point where the selling pressure is high, therefore more of an asset is sold. This is the point the price asset cannot go further up. At this level, there is high selling pressure and a weak buying pressure in the market of the asset.
The resistance level on a line chart can be identified by the shape of an inverted V. At this point, there is drastic decline in the price of the asset as many persons have taken off their profits. Resistance level today can turn a support level in the future if the asset moves past this point.
Differentiate between line charts and Candlestick charts.( Demonstrate with screenshots)
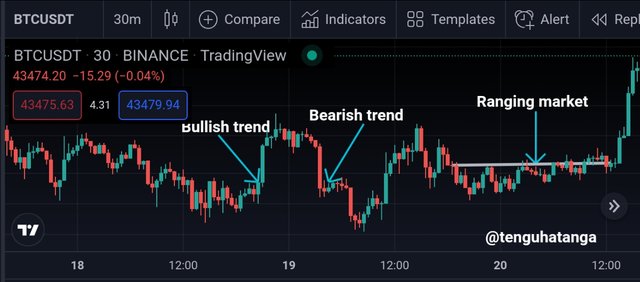
Line chart is a single line that shows upward and downward movements the price of an asset. It shows only where the price closes in any given direction of movement. It takes just a single colour which can be changed depending on the colour preference of a trader. A line chart can have a zigzag appearance, a V-shape, an inverted V or a straight line.
On the other hand, candlestick chart is a group of vertical bars that are used to represent price of an asset at any given time frame. Candlesticks shows the opening, closing, high and low of an asset. Candlesticks takes the shaped of a rectangle, square, hammer, or a cross or plus sign that comes in colour combination of green/red or white/black, with green and white standing as bullish candles and red and black representing bearish candles.
Line charts do not apply time frame to represent the price of an asset. As long as the price goes in a particular direction, the line is continuously drawn in that direction.
On the other hand, time frame is used to represent the appearance of candlesticks. A candlestick appears for the period of the time chosen by a trader.
Line charts are not associated with the noise in the market but candlesticks charts are associated with so many noise generated in the market.
| Line chart | Candlesticks Chart |
|---|---|
 |  |
Explain the other Suitable indicators that can be used with Line charts.(Demonstrate with screenshots)
Line charts are suitable for identifying critical support and resistance levels in the market of an asset. This makes them to be better combined with indicators that can easily spot these points as they walk with the price. Exponential moving average and the simple moving average are very suitable to be combined with line charts to determine trends, trend reversals, points of support and resistance. To use line charts to trade successfully, it should be combined with these averages.
Exponential moving average for example identifies a support level when it goes below the price. When this happens, a trader who knows how to use it sees a perfect entry time. It also identifies a resistance level when it goes above the price. This means that it the price cannot further go up. So it is best a trader takes profit and exit the market.
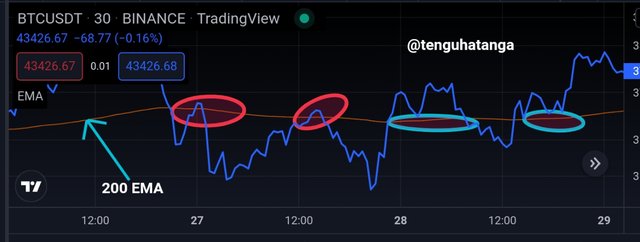
In the screenshot presented above, I have marked clearly the areas where the 200 EMA moves above the price that resulted in a downtrend and where it moved below the price that resulted in an uptrend. When the EMA is above the line chart, the price is resisted from moving up, resulting in a downtrend while when it is below the line chart, the price is supported from moving down, therefore an uptrend.
Prove your Understanding of Bullish and Bearish Trading opportunities using Line charts. (Demonstrate with screenshots)
Bullish and Bearish trading opportunities are very important opportunities every trader should look out for no matter the strategy they use in trading. If an asset wants to go bullish and or has started going bullish and a trader identifies it on time, maximum profits can be made from it. As ascending triangle is an uptrend that leads to a bear. It let's traders leave the market, descending triangles spots good entry points in trade and they are signs to expect a rapid upwards movement of the market price.
With the use of line charts, both bullish and bearish opportunities can be spotted using ascending and descending triangles. While ascending triangles in a line chart come with higher lows, descending triangles in line charts come with lower highs. This points are segmented in a line chart
I am going to use screenshots to explain better.

Using the ascending triangle, bearish opportunity can be spotted as the triangle often lead to a downtrend. A trader in the market at the sight of an ascending triangle should prepare to sell before the reversal of the trend making the line chart to turn in the downward direction.
Also, using the descending triangle, bullish opportunity can be identified as it often leads to an uptrend. A trader that has bought an asset at the sight of a descending triangle should look out for an uptrend, where the line faces up and move in the direction. Such a trader should set a take profit level or monitor the trade to see it move up.
Investigate the Advantages and Disadvantages of Line charts according to your Knowledge.
Advantages of line Charts.
A. It it is easy and simple to read. When there is a bullish trend, it can be identified with the line drawn upward. In the same vain the bearish trend is the line drawn downwards. When the market ranges, a zigzag line can be drawn sideways.
B. It filters the noise in this market by giving only the closing price.
C. Line charts give even the slightest change in the direction of the price at every time
Disadvantages of Line Charts
A. It cannot be used with many indicators like other charts. It is only best used with the averages.
B. It only gives the closing price. It doesn't give the open, high and low prices.
C. It is difficult to tell the price of an asset in the past using line charts as it doesn't use time frame to form charts. Generally, line charts can be complicated due to many zigzag lines in a ranging market. The shapes associated with line charts alone makes it complicated to read the chart.
Conclusion.
This course has brought an illumination to the complicated line charts that I never used in my trading journey. Like I never used line charts to take any trading decisions. The lesson is worthwhile and I am glad I am a part of it. With line charts, I can easily read an asset trend and point of trend of trend reversal with the use of the exponential moving average. Points of support and resistance can easily be identified using line charts. It's a knowledge acquired and added to my archive of knowledge as it concerns crypto.
Thanks for reading my work. I look forward to possible corrections.