Thanks to dear professor @yousafharoonkhan for his class. I love the class, it really added to my knowledge. Here is my submission sir!
DEFINING THE TRADINGVIEW SITE AND HOW TO REGISTER AN ACCOUNT IN TRADINGVIEW? WHAT ARE THE DIFFERENT REGISTRATION PLAN?
Definition of Tradingview
Tradingview is a social media and a cloud based charting platform that enable its users to explore market analysis and charts in global market. This platform was founded by Stan Bokov, Denis Globa and Constatin Ivanov in the year 2011. They are currently having about 30million users in the world, this makes them one of the most popular platforms
Tradingview allow its users to trade through brokerage affiliate system. This simply means that users can log in through their broker account and perform their trade on tradingview.
How to register account on tradingview
To register an account on tradingview, you will have to follow the steps in the images below;

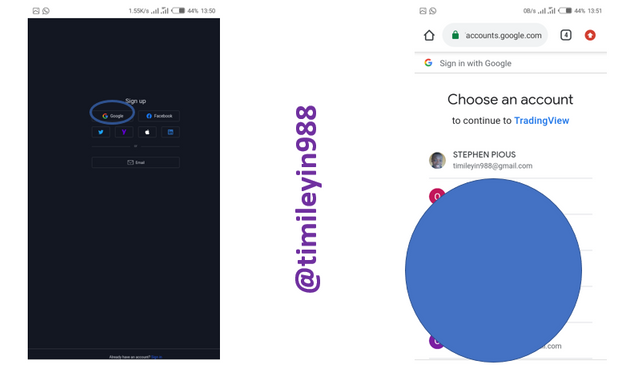
Press the image avatar at the top right corner of tradingview website
Press the “start free trial” option and you will be directed to the list of available plans

Choose your preferred plan and sign up with either your Facebook account, Gmail account, Twitter account, Yahoo account, Apple store account, LinkedIn or Email.
Different Registration Plans on tradingview
There are three basic registration plans on tradingview platform. Each of this plans have their different registration fees and different benefis.
a. PRO PLAN: In this plan, a trader will have to pay the sum of $14.95 monthly or $155 yearly before they can have full access to the plan
b. PRO+ PLAN: Here, a trader will pay the sum of $29.95 monthly or $299 yearly before they can have full access to the plan
c. PREMIUM PLAN: In this plan, a trader will have to pay the sum of $59.95 monthly or $599 yearly before they can have full access to the plan

The above image shows the list of available plans on tradingview platform
| Pro | Pro + | Premium |
|---|---|---|
| 5 indicators per chart | 10 indicators per chart | 25 indicators per chart |
| 2 charts in one window | 4 charts in one layout | 8 charts in one layout |
| 20 server-side alerts | 100 server-side alerts | 400 server-side alerts |
| Ad-free | 2 devices at the same time | 5 devices at the same time |
| Volume profile indicators | Intraday exotic charts | Second-based intervals |
| Custom time intervals | Charts based on custom formulas | Alerts that don't expire |
| Multiple enhanced watchlists | Chart data export | 4x more data on charts (20K bars) |
| Bar replay on intraday bars | Indicators on indicators | Publishing invite-only indicators |
EXPLAIN THE DIFFERENT FEATURES OF TRADINGVIEW AND WHAT IS YOUR FAVORITE FEATURE AND WHY?
| S/N | Features | Explanation |
|---|---|---|
| 1. | Chart | This part help usere to get information about the market price. It's a sheet that provide graphical information about market price of a commodity |
| 2. | Trade | Here we have two subdivision, we have the "Top broker" segment and the "Broker award" segment. The Top broker part shows the list of top brokers on tradingview platform while the broker award part is where the list of the award earn by each broker are listed. |
| 3. | Markets | The market feature is subdivided into Cryptocurrencies, currencies, stocks, indices, future and some other part. With this market feature, traders can view the list of the cryptocurrencies on tradingview, the list of major and minor currencies, the stocks, indices and market related to agriculture, energy and the likes |
| 4. | Screener | This part is subdivided into three forms. We have the Crypto screener, the forex screener and the stock screener. All this subdivision provide the list of available commodities and the last price with the percentage change in the market. Crypto screener provide the list of cryptocurrencies, Forex screener provide details for the international currencies and other exchanges and the Stock screener provide information about the available stocks on tradingview platform |
| 5. | Community | The community feature includes Ideas, Scripts, Streams and more |
| 6. | More | This includes Help center, Features, Pricing, About and For Business |
Among the listed features in the above table, Chart is my favorite.
I choose chart because it's the major reason why I know about tradingview platform, it has help to have positive feedback on my trading through the use of some major indicator that guide me when it comes to trading strategy.
HOW TO SET UP A CHART IN TRADINGVIEW AND USE TWO TOOLS TO EDIT IT.
Before we can set up a chart, we must have two trading pair of commodity e.g TRX/USDT. After getting to the chart page the next thing is to set up the chart to suit our view. We can do this by using some tools to modify the chart. We can change the chart from either candlestick, line, bar, hollow candles etc.
We can also
To complete this part. I will be changing the chart graph from a hollow candles graph to a candlestick graph. Below are the steps to change the graph.
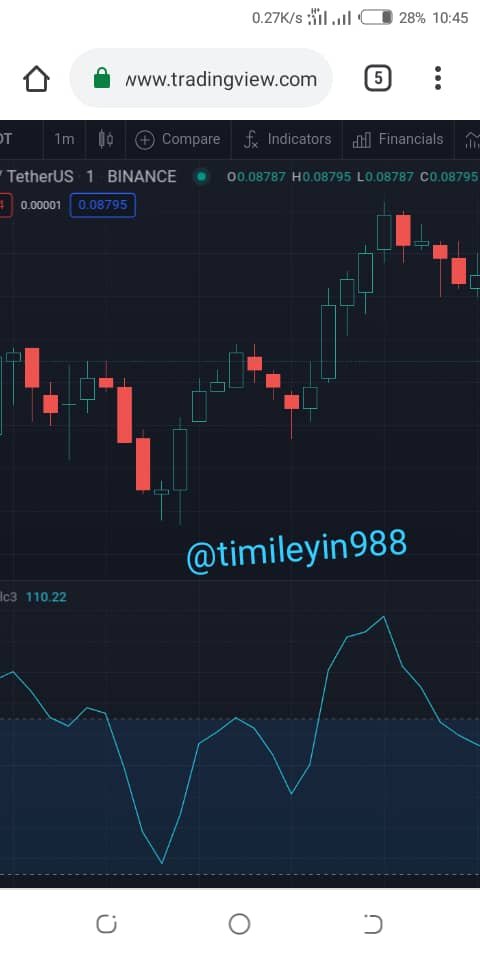
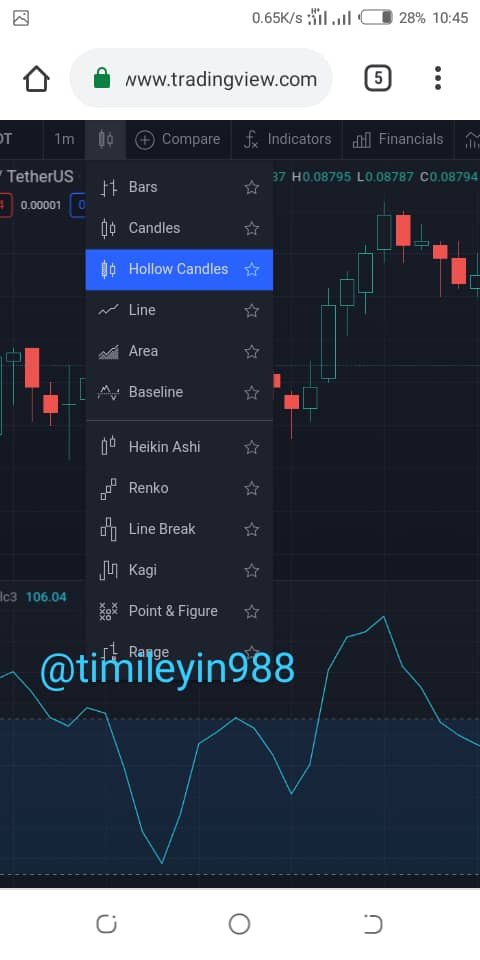
The two images above are for hollow-candle chart
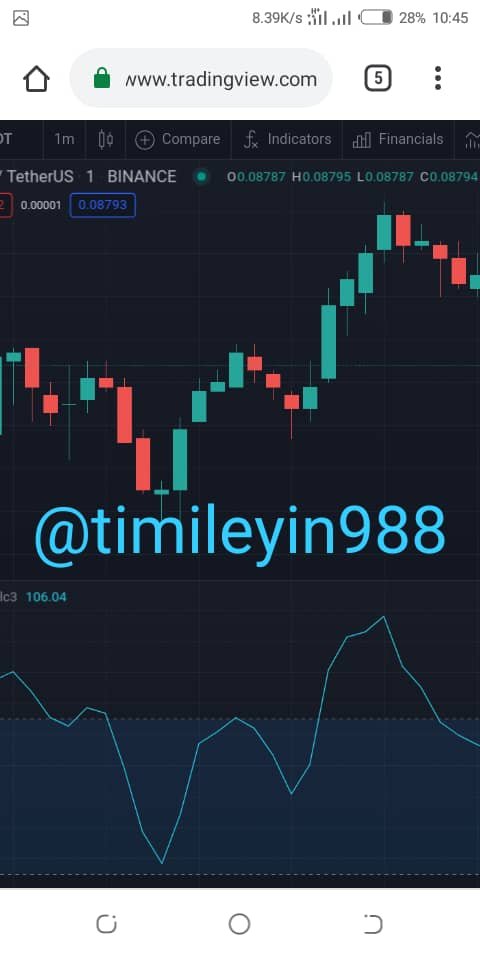
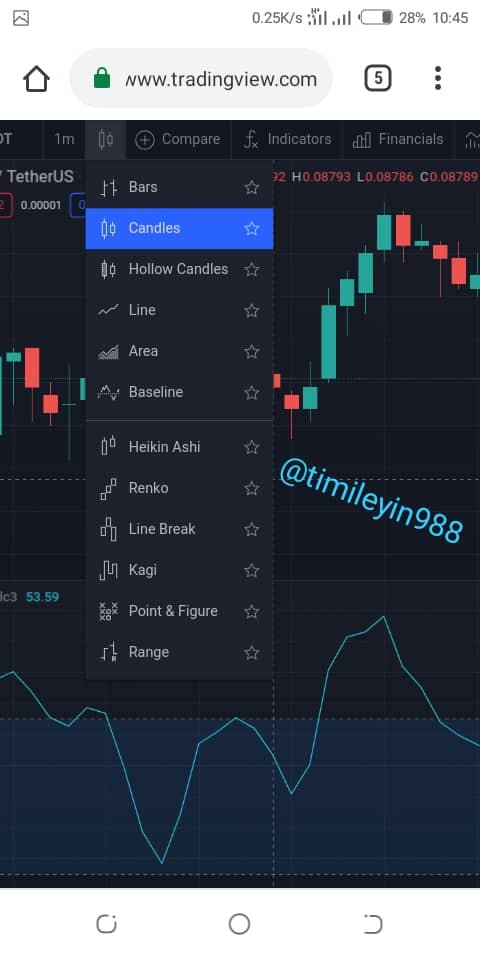
The above images are for candlestick charts
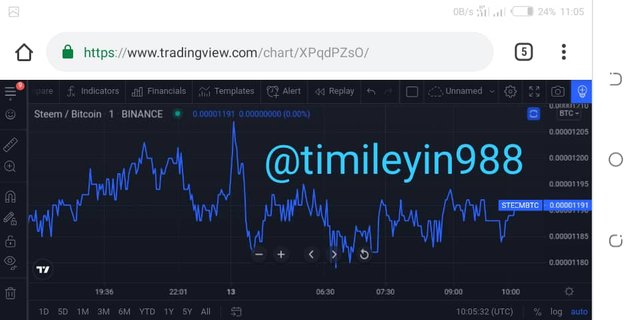
With the second tool, I will be changing the symbol of my chart.
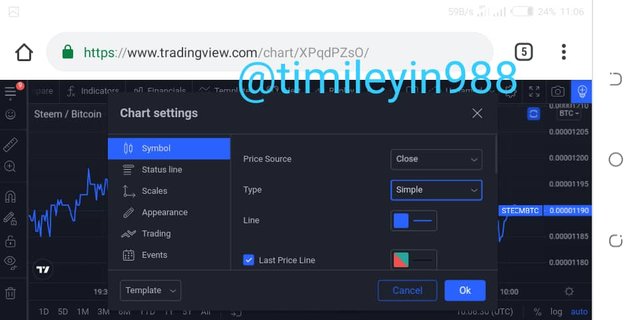
The trade I will be using here is STEEM/BTC and I will be using line graph by this time, not candlestick. The change I'm going to make on my chart is the line color and the type of line. In the above image, the graph is a simple line graph and I will be changing it to a step line graph.
This is the original feature of the line graph
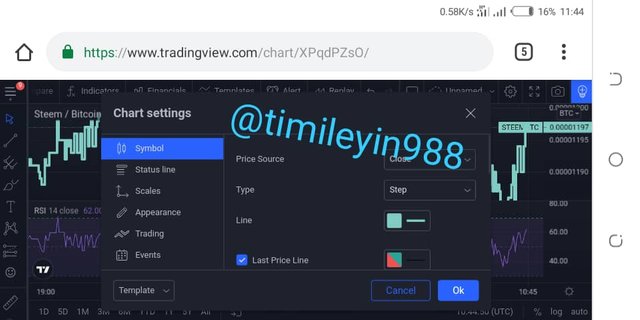
I have changed the features of the line here
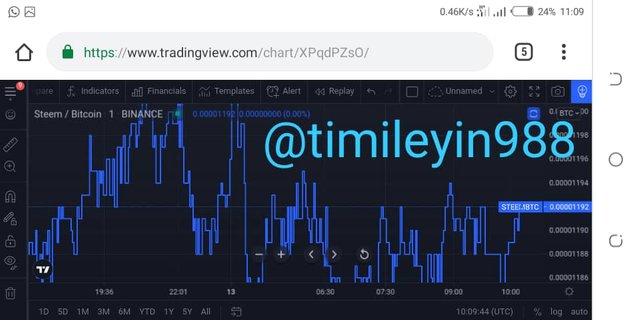
Here, I've changed the line from simple-line graph to step-line, but the thickness and the color is not yet changed
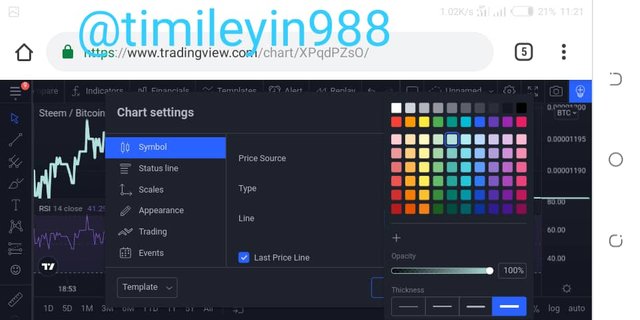
Here, I choose my preferred color and change the line thickness
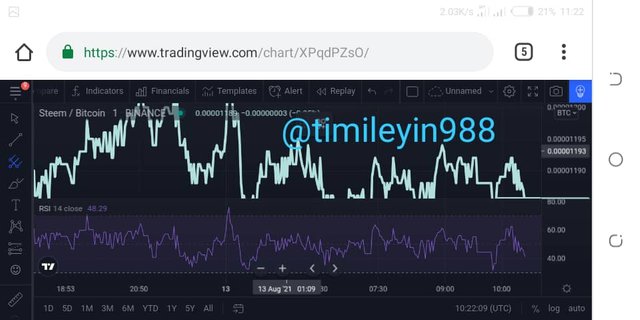
I have finally changed the line thickness, and the color
Question no 4:
EXPLAIN HOW TO ADD INDICATOR in CHART, WHAT IS YOUR FAVORITE INDICATOR AND WHY?
In this part, I will be adding one of my favorite indicators on tradingview chart which is named CCI (commodity channel index), below are the steps to choose the indicator;

I opened my google chrome app on my PC, and I typed the word "TRX/USDT Tradingview". I press the first result i.e the first link that come out.
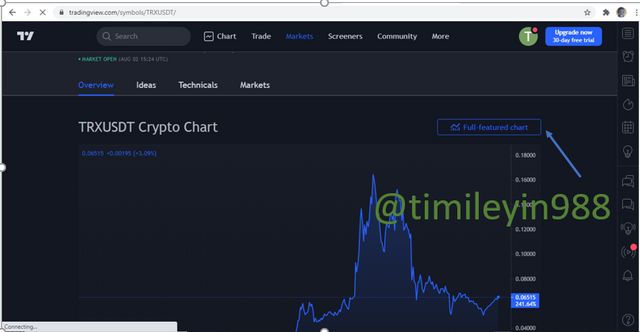
Here is the result that show after my search on google chrome, but for me to be able to choose my indicator I needed to press the "Full featured chart" option
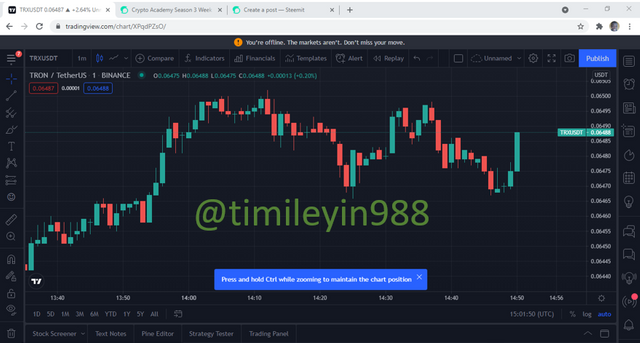
This is the chart without any indicator.
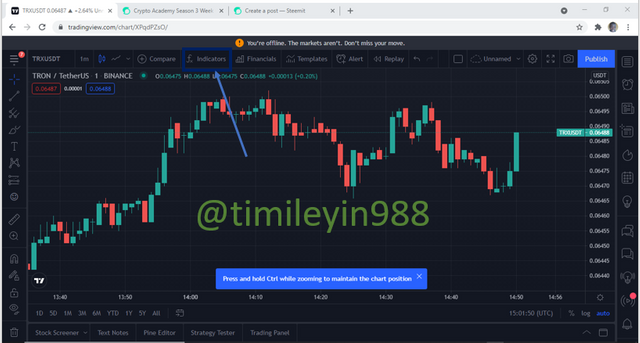
To choose my indicator, I press the "indicators" option above the chart
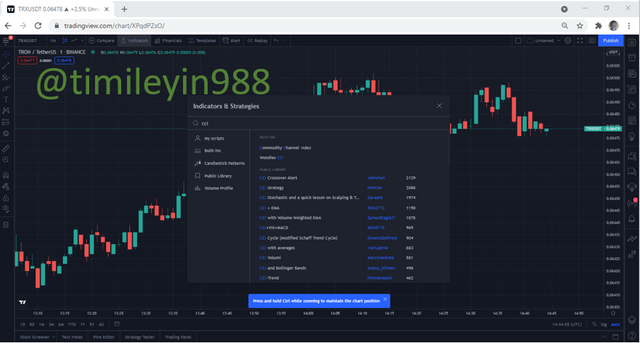
Here, I choose to use the CCI indicator which simply means "Commodity Channel Index". I pressed CCI in the search box and the indication came first in the search list.
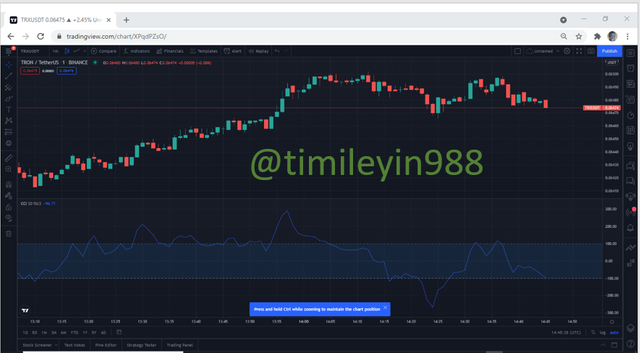
Here is the result after choosing CCI as my indicator
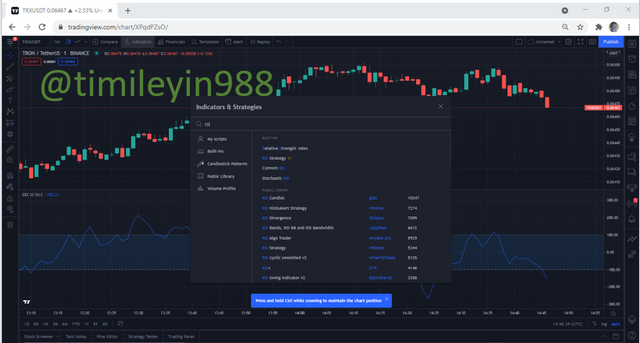
Can choose other indicators
DO YOU THINK TRADINGVIEW IS USEFUL IN PREDICTING THE MARKET FOR CRYPTOCURRENCY (TREND / PRICE)?
Tradingview is useful in predicting the market for cryptocurrencies price because of the ability to use indicators.
Some indicators help traders to know the best time to hold token and to know the best time to sell token.
One of the best indicator that help in this kind of prediction is the combination of the Relative Strength Indicator and the moving average indicator
Tradingview is one of the best platforms everyone must use. It help to manage your trading strategy because it allow the use of indicators which help trader to know the best time they can buy or sell token.
The platform also provide updates on currencies on their supported exchange platforms.
It's been a great experience since I started using tradingview, one of the professors also taught us about tradingview last week, which was interesting.
Hi @timileyin988
Thanks for participating in the Steemit Crypto Academy
Feedback
This is good content. Well done with your practical study on Tradingview.
Downvoting a post can decrease pending rewards and make it less visible. Common reasons:
Submit