Over the period I joined the cryptocurrency world and started trading, I noticed many forms of candlesticks but do not know there names or the psychology behind their formation. This is why this course is an eye opener and an enlightening one for me. It is just my pleasure to be a part of the course.
In your own words, explain the psychology behind the formation of the following candlestick patterns.
- Bullish engulfing Candlestick pattern
- Doji Candlestick pattern
- The Hammer candlestick pattern
- The morning and evening Star candlestick pattern.
BULLISH ENGULFING CANDLESTICK PATTERN
Generally, the engulfing candlestick pattern suggests that their is going to be a change in the direction of price movement in the market.
The bullish engulfing pattern occurs when a bullish candle comes after a bearish candle in the chart and overshadows it. In this case, the bullish candlestick is longer than the former candlestick, thereby the engulfing. This usually happens in a downtrend when the reversal of the trend occurs. That is discontinuation of the downtrend.
The psychology behind the formation of bullish engulfing candlestick pattern is that buyers are more in the market at that time. The buying action that goes on in the market pushes the price up. The candle that forms at this time usually longer than the former, it therefore engulfs the former candle.
DOJI CANDLESTICK PATTERN
The Doji candlestick pattern is also known as the Doji star candlestick pattern. It forms in the cryptocurrency or financial market chart when the opening and closing prices are almost the same or have no significant difference. The shadows of this kind of candlestick are long presenting a candle that looks more like a plus sign.
The psychology behind the formation of Doji candlestick is indecision in the market. That is buyers and sellers indecisive at that point in time. In this case, the buyers pushes the price up and the seller pushes it down. The market situation is represented by the body of the candles formed at that period.
THE HAMMER CANDLESTICK PATTERN
This kind of candle stick presents itself like an
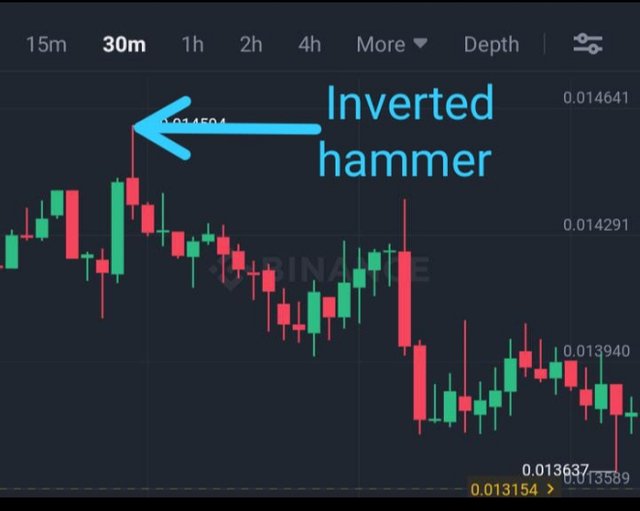
hammer, having a thick body at either the open or close point with a long wick. There are majorly two kinds of this candlestick pattern in a crypto chart, this are the bullish and inverted hammer. The bullish hammer can be seen in a downtrend where buyers push the price up while the inverted hammer associated with a bear is most visible in an uptrend when sellers push the price down. In a very strong downtrend that hasn't ended, an inverted hammer can still be formed, so also, in a very strong uptrend that hasn't ended, a bullish hammer can be formed. It all depends on the activities of both buyers and sellers at each point. The stronger force dominates, therefore an inverted hammer can be changed if the buyers are more active at that point and vice versa.
The open, close and low points of hammer candlesticks are almost the same.
The psychological behind the formation of this kind of candlestick is that it is an indication to a change in the direction of price movements (i.e the current trend). This means that the price would likely take a new direction of movement once the hammer candlestick pattern forms in a crypto chart.
THE MORNING AND EVENING STAR CANDLESTICK PATTERN
Both morning and evening Star candlestick patterns are associated with trend reversal. While morning star candlestick has to do with reversal of a downtrend leading to bullish run, evening star candle chart is associated has to do with an uptrend that leads to bearish run.
The psychological behind both candlestick pattern is an indication for a change in the direction of price movement. In morning star candlestick pattern, buyers takes over control of market that was in control of sellers making price to go up. Similarly, in evening candlestick pattern, sellers takes control of the market that has been controlled by buyers, making price go down.

Identify these candlestick patterns listed in question one on any cryptocurrency pair chart and explain how price reacted after the formation. (Screenshot your own chart for this exercise)
Bullish Engulfing Candlestick Pattern
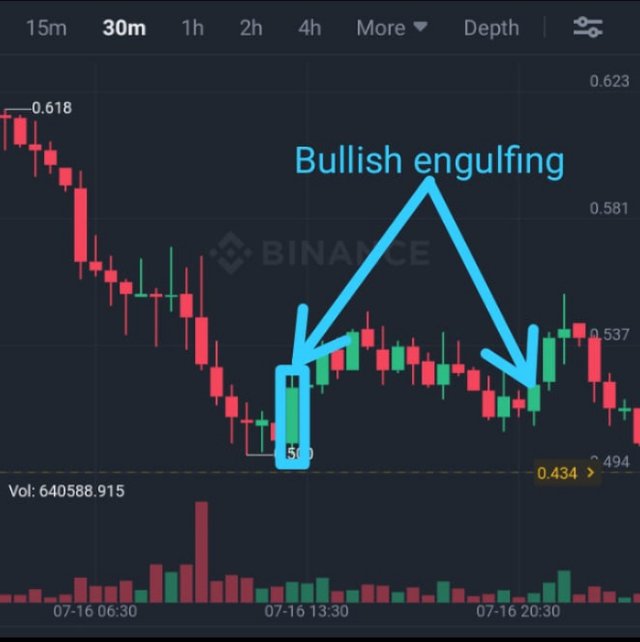
WIN/USDT PAIR
In the above chart, the downtrend continued for several hours with bear candles. The bull candle that appeared engulfed the last bear candle and led the uptrend. The price went up at the appearance of a bullish engulfing candlestick.
Doji Candlestick Pattern
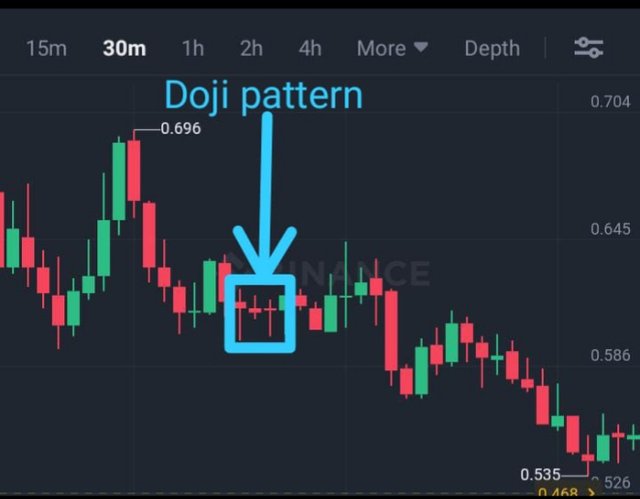
SUPPER/USDT PAIR
The price at the formation of these set of candles indicated in the image above showed that the price didn't move up too much neither did it move down too much. It was trading between a fixed region for about an hour and thirty minutes.
Hammer Candlestick Pattern
STEEM/BTC PAIR
The price opened from below and went down before it went up in an uptrend. As this candle pattern began to form, the price came down and went down the more forming a downtrend.
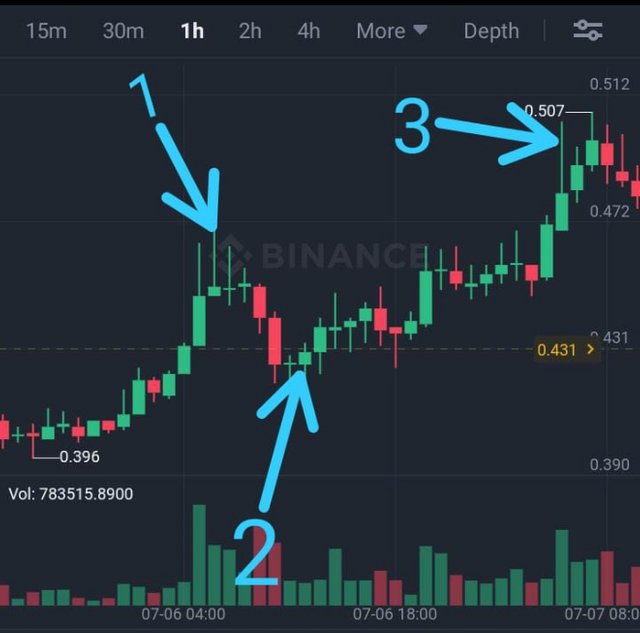
EPS/USDT PAIR
The candle labelled 1 is an inverted hammer that led to the fall in price as the candle formed. Though the candle opened as a bull but at a point it formed an inverted hammer that led the downtrend.
The candles labelled 2 is a bullish hammer candlestick patterns though inverted. It started as a bear candle but as the hammer candle formed, the price of the asset began to go up. An uptrend continued from there.
The 3rd candle labelled 3 is an inverted bullish candle but led to the fall in price as the candle pattern formed.
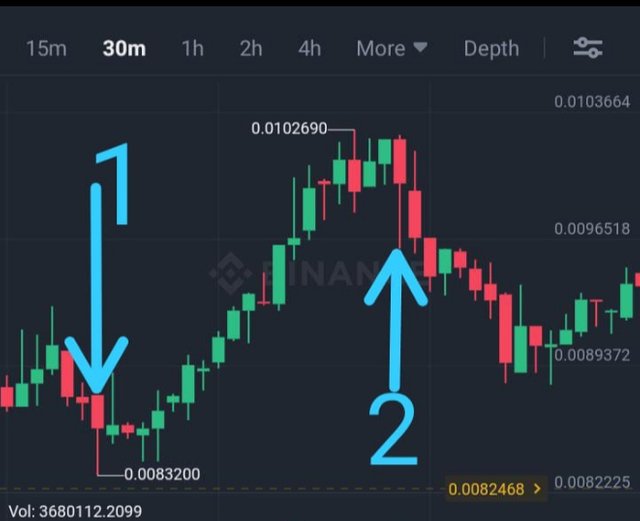
TKO/USDT PAIR
The first candle labelled 1 started as a bear but as the hammer candle formed, the price went up. The second candle labelled in the chart is a bear hammer candle that led to a downtrend as the price fell.
The Hammer candle pattern either inverted or upright can lead to upward or downward movement in price depending on the market situation as presented in the screenshots above.
Morning and Evening Star Candlestick Pattern
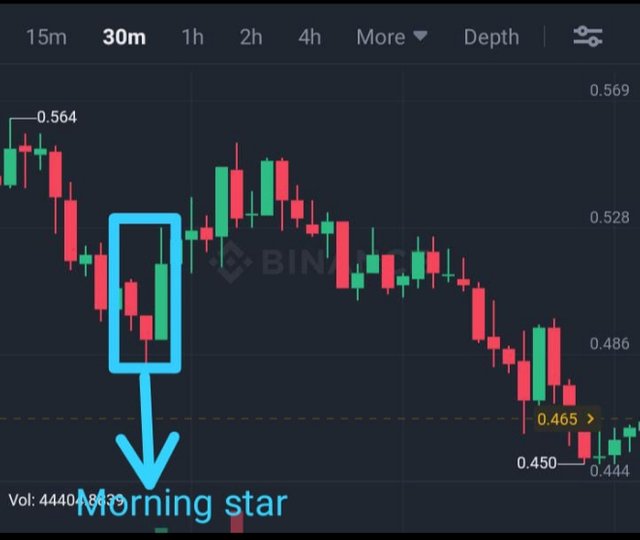
REEF USDT PAIR
The formation of this candle pattern led to an upward movement of price leading to a downtrend.
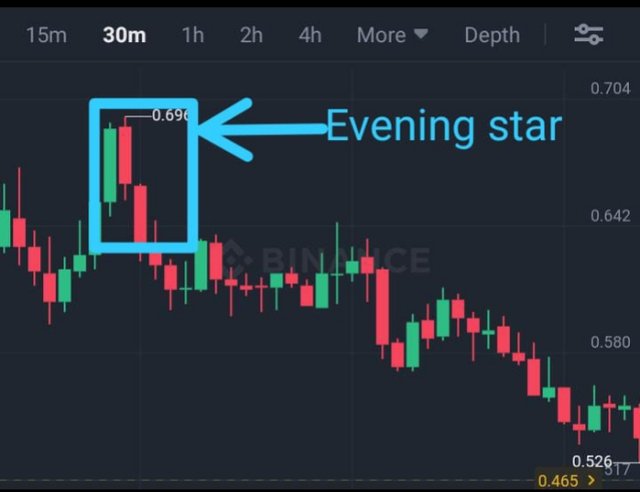
ASR/USDT PAIR
The formation of this candle pattern led to a downward moment of price, leading to a downtrend.

Using a demo account, open a trade using any of the Candlestick pattern on any cryptocurrency pair. You can use a lower timeframe for this exercise.(Screenshot your own chart for this exercise).
For this question, I do not have any demo account, so I used live account.
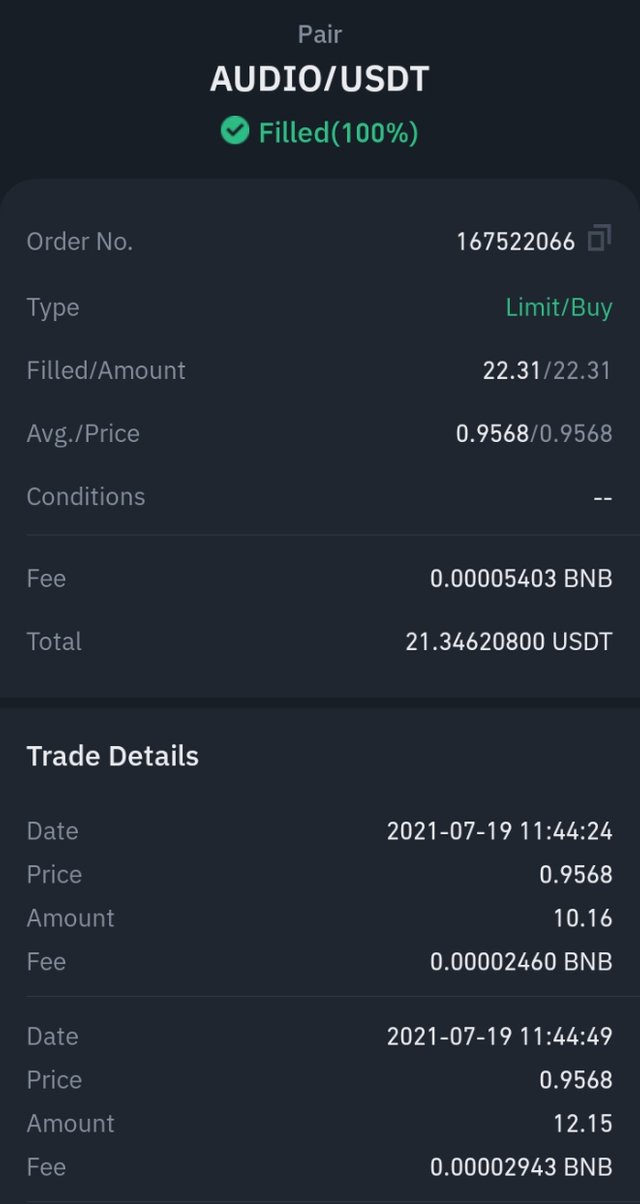
I opened a trade on the AUDIO/USDT pair using the Bullish Engulfing Candlestick Pattern. See screenshot below:
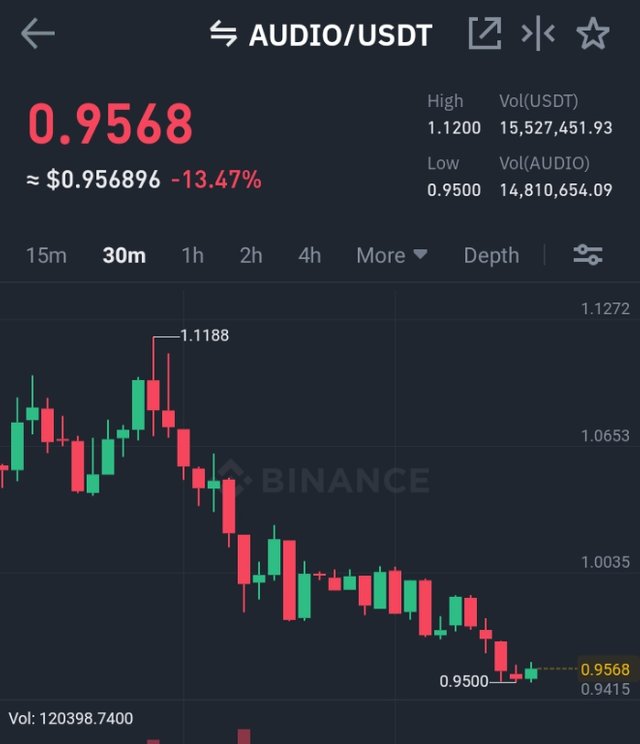
According to the candlestick pattern formed above, I bought AUDIO at 0.9568. Below are screenshots of details of the transaction.

Conclusion:
There are different patterns formed by candlesticks on cryptocurrency charts. This chart patterns are indicators to market situations as there are different psychologies behind their formations. They cannot be used independently. They should be used with technical analysis and good trading strategies.

Special Mentions:
@reminiscence01
.jpeg)
