Hello Friends, today I wish to enroll into this week's academy lecture, conducted by Professor @shemul21. Below are my engagement, thanks for patiently going through.

What is the Support & Resistance zone?

Support zones in trades are Strategic points where there is more buying pressure than sales orders in the market. These points are positions where the market tries to gain some momentum to push up price to the Bull than a continuous depreciation of asset price.
Nonetheless it is not % certain where actually a falling market could gain support so as to retrace back to the Bull. Nevertheless these zones could be marked based on a truders discretion as there may not be stipulated agreement on exactly where these points may fall in the market.
Resistance on the other hand are also strategic positions where there is a more selling pressure in the market, this could also be caused by an over-valuing of an asset which further retraces to the bear.
Moreso there is no precision as to where this area or position will actually be as this can be dynamic overtime.
Finally, traders can draw a resistance area based on the current trend of the market as this virus in different markets in areas for instance the resistance area in a horizontal market will never be the resistance point in a sloping or dynamic resistance.

Explain different types of Support & resistance with proper demonstration.

There are specifically three types of support and resistance in the market and they are as follows.
Horizontal, Sloping and Dynamic support and resistance all these I will be explaining below in detail.
Horizontal Support and Resistance:
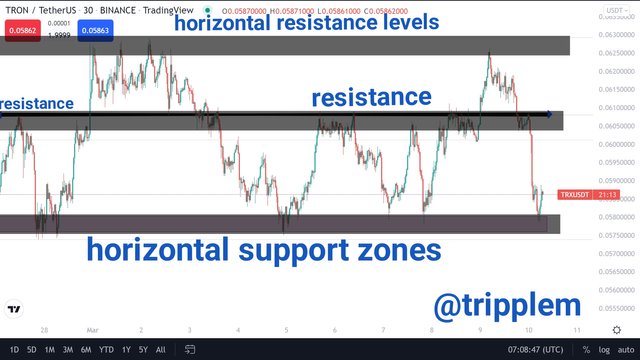
This is a kind of support and resistance scenario that is mostly spotted in a range market. To be able to ascertain a real horizontal support and resistance a trader has to specifically draw a horizontal line that cuts from one end of the price action to the other and this will help him to know if the market is in a truly horizontal support and resistance phase. I'll be illustrating this using the TRX/USDT price chart below.
From the screenshot above we can see the point math support disappoint where the market gained momentum because of a more buy pressure and on the other hand we can also see the point where I marked resistance these points are also levels of resistance which was as a result of a more sell pressure by traders and some other exigencies.
Sloping Support and Resistance:
This is a market scenario where there is a true trend and this could either be in an uptrend or a bear trend and hence this plunges price action into a sloping face.
Nevertheless we have a bull and bear sloping support and resistance. In a bull trend, we have more of a stronger support system which makes a pullback after its retracement while in a beer trend, we have more of a stronger resistance period which comes after a strong downward push in price. I will be illustrating these market scenarios using a bull and a bear market chart.
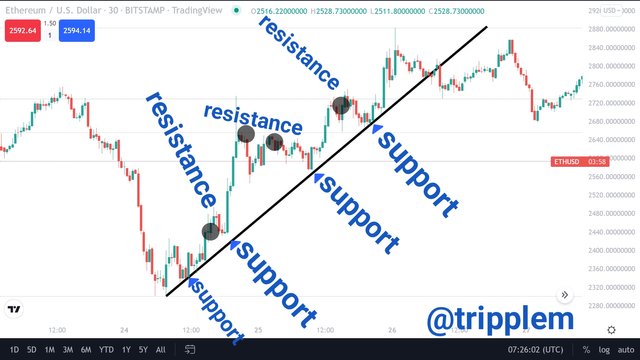
Sloping Support and Resistance in a Bull Trend
From the ETH/USDT price chart above we can observe these support and resistance points as the market keeps making a break and a pullback positions till the point of price consolidation at the peak of the trend.
Sloping Support and Resistance in a Bear Trend
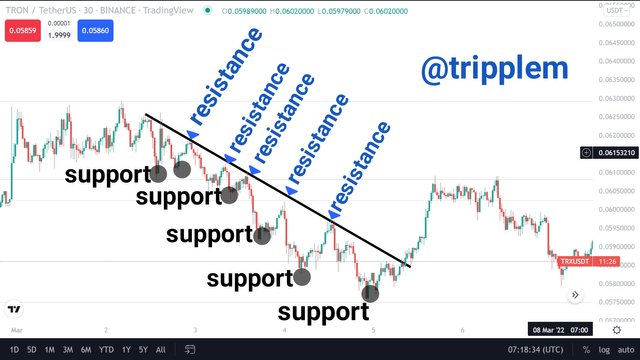
From the screenshot above, we can also observe the different support and resistance points, specifically we can observe that there is more resistance pressure in this market than a support force as the market redresses after each level of breakout and this could be as a result of a greater sale pressure which pushes price downwards with little adjustments which is the pullback positions.

Identify The False & Successful Breakouts. (demonstrate with screenshots)

First of all, a false breakout is a market situation where the price action has probably taken a strong break from the current trend and hence, either buyers or sellers we're able to push the price action in the opposite direction thereby leaving traders who have opted to trade in such direction in a deplorable condition.
Nevertheless I will be identifying this position in the market using ETH/USDT price chart specifically in a downtrend.
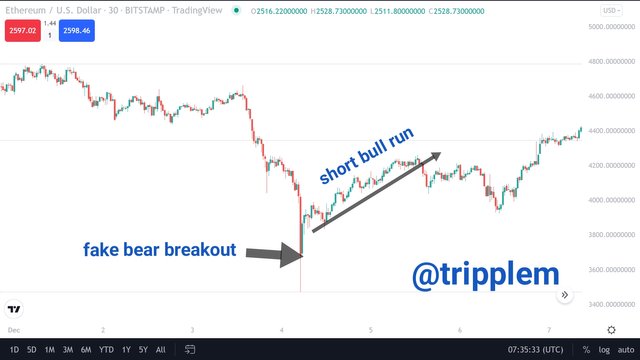
False Breakout in a Bear Trend
From the ETH/USDT screenshot above we can observe that the market was in a bear position, while it created a weak breakout and in the cause of the trend continuation, it also created another breakout which turned to be a false breakout from the bearish trend while the market then reverses to the Bull side probably as a result of a stronger buying pressure which corrected the ETH market.
Successful Breakout
This is a market scenario where the current market breakout is able to continue it's retracement after a pullback which retests the previous level of its price action as it continues until another reversal or consolidation point.
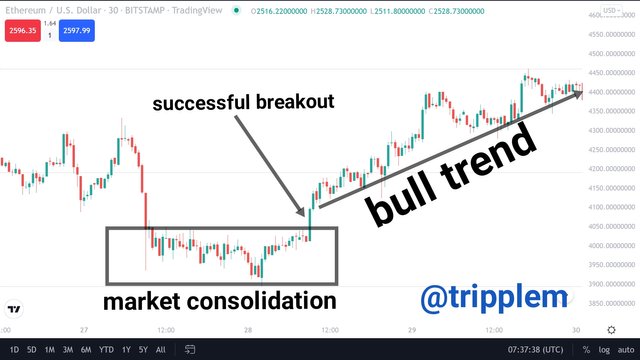
Nevertheless I'll be using the ETH/USDT price chart in a bullish direction in identifying this market condition.
From the screenshot above, we can observe that after the price consolidation period, at the base level of this market, there was a strong bullish breakout of price action, where also the ETH asset was able to maintain it's trend while making a series of retracements and higher highs.

Use Volume and RSI Indicator Combined with Breakouts & Identify the Entry Point. (demonstrate with screenshots).

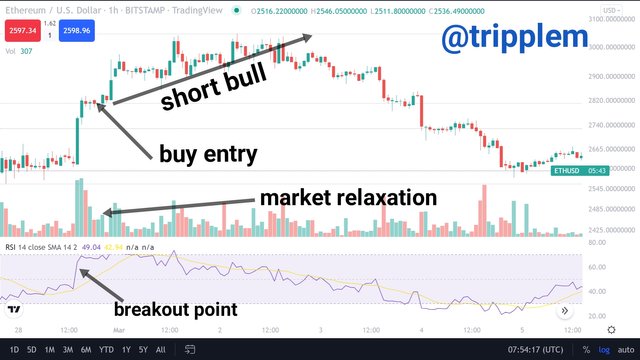
I'll be identifying these points of market entry using the screenshots below in both the bullish and bearish trend. It is also noteworthy that market breakout can be indicated in the RSI by showing a strong push either to the bull or to the bear which also applies to the volume. A strong bullish breakout will be shown in the volume by a long and strong indicated greenish volume while a bearish breakout will be indicated by a strong reddish volume.
Trade entry using this strategy in a bullish trend
From the screenshot above, we will observe that before the breakouts point, the market has been in a consolidation phase. After which there was a strong breakout which was also indicated in the volume and also the RSI showing a strong bullish push.
Nevertheless, to make an entry position in this market a trader has to wait until the RSI and the volume start declining as price action relaxes from the market breakout and all of these I indicated in the screenshot.
Trade entry using this strategy in a bearish trend
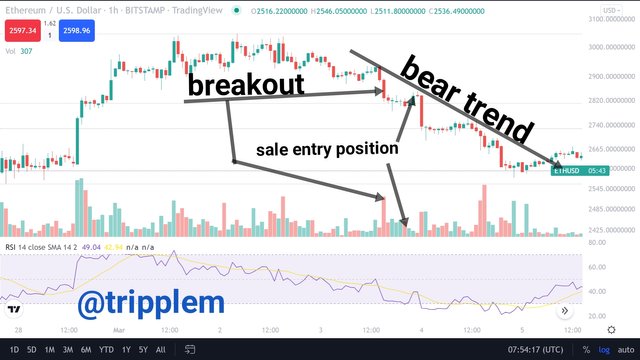
I will be illustrating this using the ETH/USDT price chart. But we have to first understand that in a bear breakout, the RSI usually makes a strong downwards push, while the volume indicates a strong and long reddish candle chart and all these were indicated in the screenshot below.
From the screenshot above we can see that there was a bearish chart breakout although after the consolidation period which indicated an apparent bearish trend.
Nevertheless, trade entry could be made at the retracement point where the trend had its first relaxation before pushing again to the bull where I marked the entry point.
Moreso, to confirm this breakout, we can see that there was a strong reddish volume which was also indicated in the RSI in its strong downwards push.

Take a Real Trade(crypto pair) on Your Account After a Successful Breakout. (transaction screenshot required).

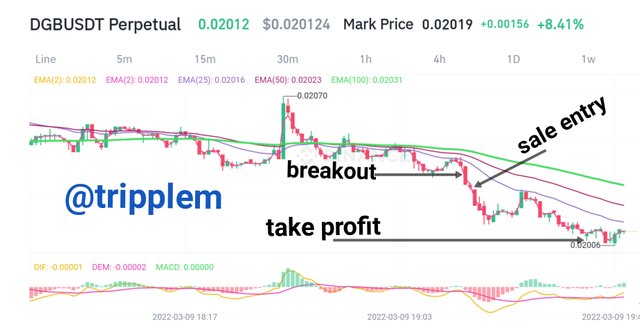
In this regard, I will be using the DigiByte crypto asset DGB/USDT in illustrating this in a sales trade option though using scalping method in a minute time frame on Binance trading app.
I entered the market after a successful breakout to the bear side as shown in the screenshot above. Hence we can also see the point I backed out of the market after a little bit of profit.
Wallet balance before trade

S
The screenshot below shows my trade history.
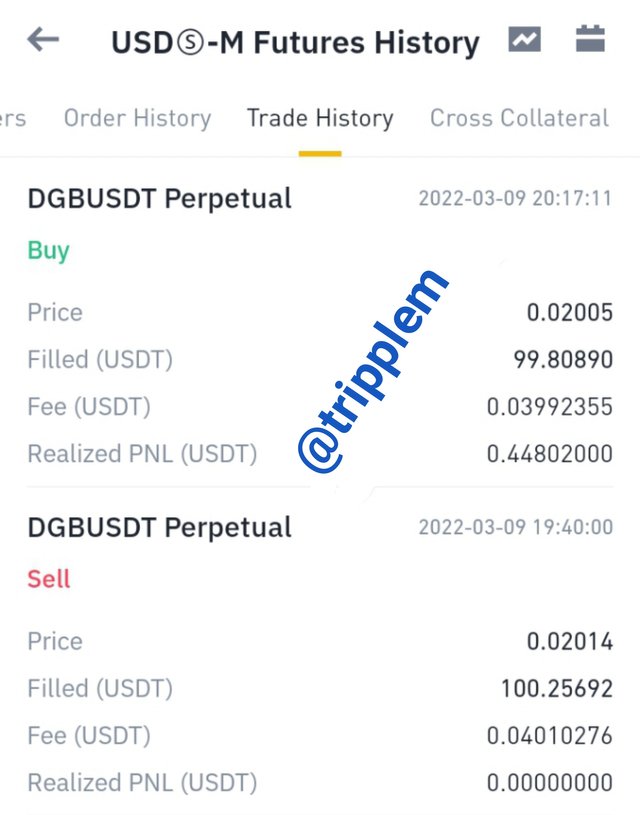
S
Balance after trade
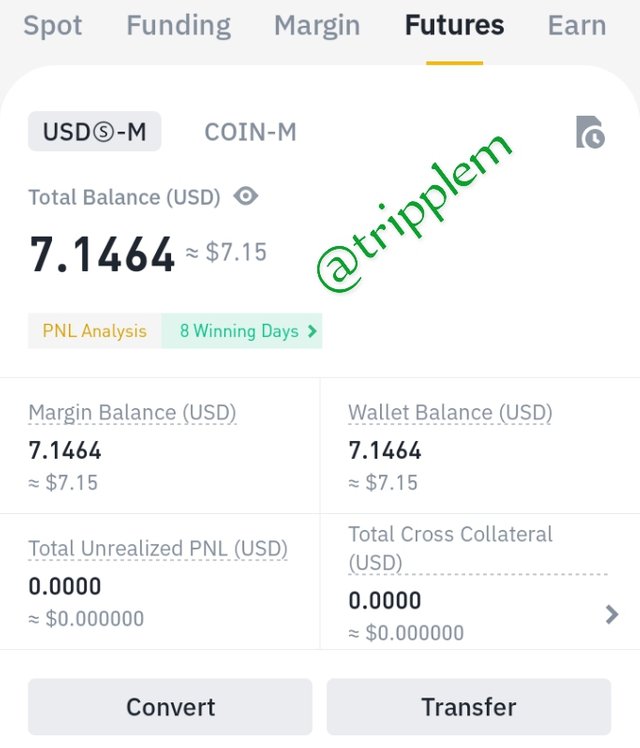
S

Explain the Limitations of Support & Resistance (false breakout).

The following are the limitations of support and resistance.
This trade pattern can not work perfectly without the help of other technical tools.
This is not the best trading strategy since there is no specific point where traders can truly rule to be the actual point of resistance and support.
This system can leave traders in a confused state most times as support can turn to resistance while resistance turns to support.
This system of trade may be very difficult to be applied by beginners.
A trend line may not accurately spot these positions as this can come with some lapses, where the price action can either move above or below the trend line unless spotted as zones than just using trend lines.
There is no position in price action where traders can either mark as support or resistance thereby making this system highly inconsistent.


Support and Resistance system is highly technical to be used by both beginner and professional traders, but the amalgamation of some technical tools which a trader is well acquainted with will really help in demystifying the whole process for a fluent trade placement. Thanks to Professor @shemul21 for a pretty exposure into this week's lecture.
