
Technical Details on Reverse Strategy
Introduction
Another new week of learning in the Crypto Academy. Various technical indicators and chart patterns are used to make decisions in the crypto market. Professor @stream4u have made a detailed explanation on a technique he called the "Reverse Strategy". I had never heard of this strategy before this lesson. I have done my study on this strategy and would make this post based on my understanding.
Now, what is the Reverse Strategy?

Reverse Strategy
The Reverse Strategy is a technique that follows the price movement of the market (bullish or bearish) and then creates an opportunity to make an entry or exit after a 24 hour cycle.
Traders sell off their positions after 24 hours. Buyers use this opportunity to make their entries into the market at a low price, causing the price to go up.
Take notes of the important points below:
Opening point: This is the price of the market at the beginning of the day.
Closing point: This is the last price of the market at the end of the day.
High Point: This is the highest price that the market reaches within the 24-hour cycle.
Low Point: This is the lowest price that the market reaches within the 24-hour cycle.
Bullish Trend
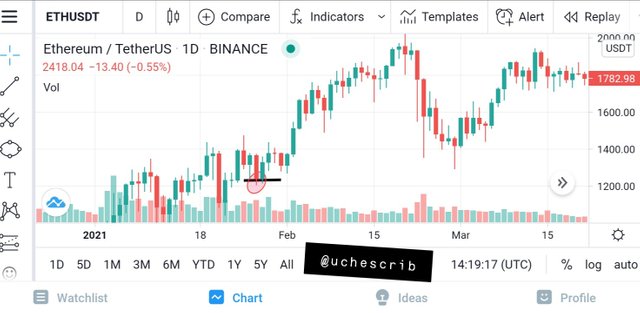
To identify a bullish trend that is suitable for the Reverse Strategy, there has to be a price change of at least 20% in price.
You would notice that the opening price is the same as the closing price of the previous day. The idea is to open a position at this point and take profit the moment the price shows a significant increase, which is after the fifth day of the entry in my diagram below.
It is advisable to place a stop loss at the previous low point in order to minimize loss incase the market does not follow the predicted bull trend.
Bearish Trend
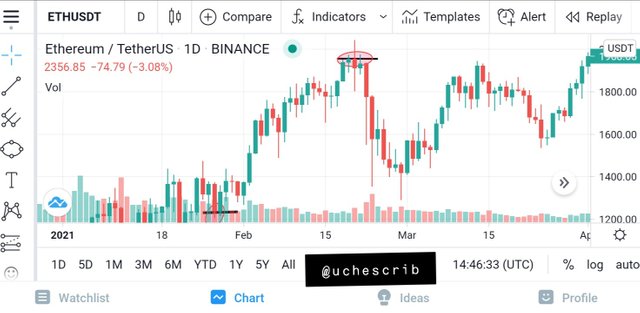
To identify a bearish trend that is suitable for the Reverse Strategy, there has to be a price change of at least 20% in price.
You would notice that the market opens at the closing point for the previous day. The new price would be indicated by a red candlestick. It is advisable to close position in this situation because it signifies a bearish trend.

Review Of COINGECKO

source
Coingecko is a platform that has a list of cryptocurrencies in the world and gives traders news and updates about these digital currencies.
It was created by TM Lee and Bobby OnG in 2014. The platform shows analytical data of cryptocurrencies in addition to trusted exchanges and price movement of these assets.

How Coingecko is Useful in a Crypto Market?
Coingecko has been used over the years because of the convenience it provides. This platform is useful in the following ways:
Accurate Data on Digital Currency:
Coingecko gives useful data on the cryptocurrencies listed. Such data includes market supply, trading volume, all-time high, all-time low, etc. This would be useful to investors in making decisionsTechnical Analysis:
Yet another tool that aids in decision making. Coingecko provides a chart that can be used for technical analysis and price forecasting of a crypto asset.Developers' Info:
Coingecko gives information on the developers of crypto assets. Information on the developers would help to show if a cryptocurrency can be trusted or if it is a scam.Exchange:
The platform offers a list of exchanges, their market capitalization, along with other info. It also shows the trustworthy levels of these exchanges, giving further info on the best exchanges to use.News:
Coingecko also provides news updates on the available cryptocurrencies. It helps traders because vast news on cryptocurrencies would be accessible on one platform.Portfolio:
Coingecko offers a digital portfolio where investors can track their investments and favourite digital assets.

Features of Coingecko
I have been using Coingecko app for Android for 6 months. As a result of this, I'll explain the features offered by the application.
List of Cryptocurrencies
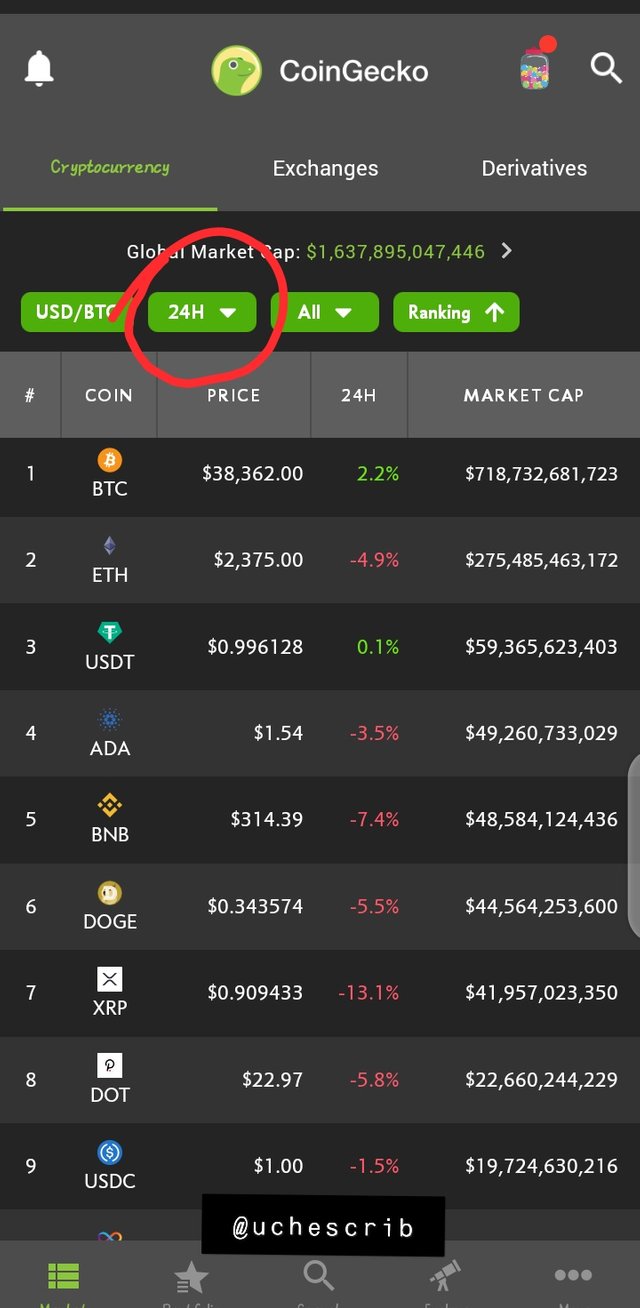
The Coingecko homepage shows a list of cryptocurrencies. The cryptocurrencies are ranked by their market capitalization.
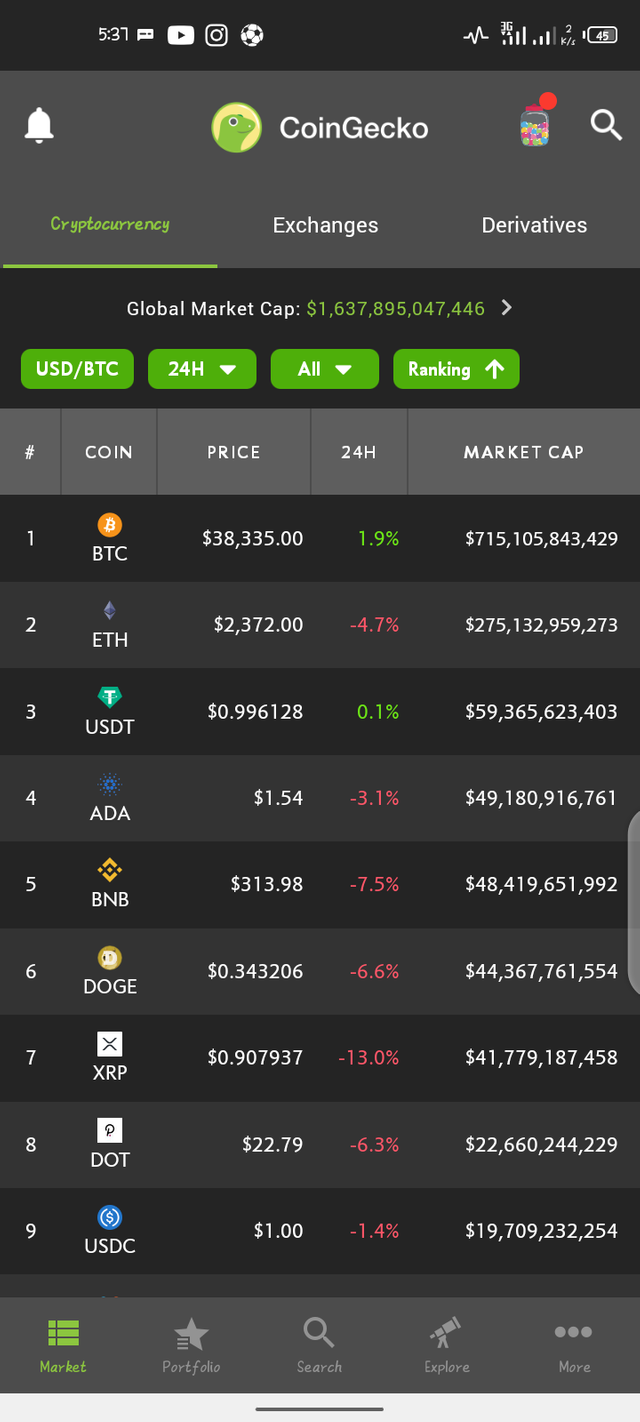
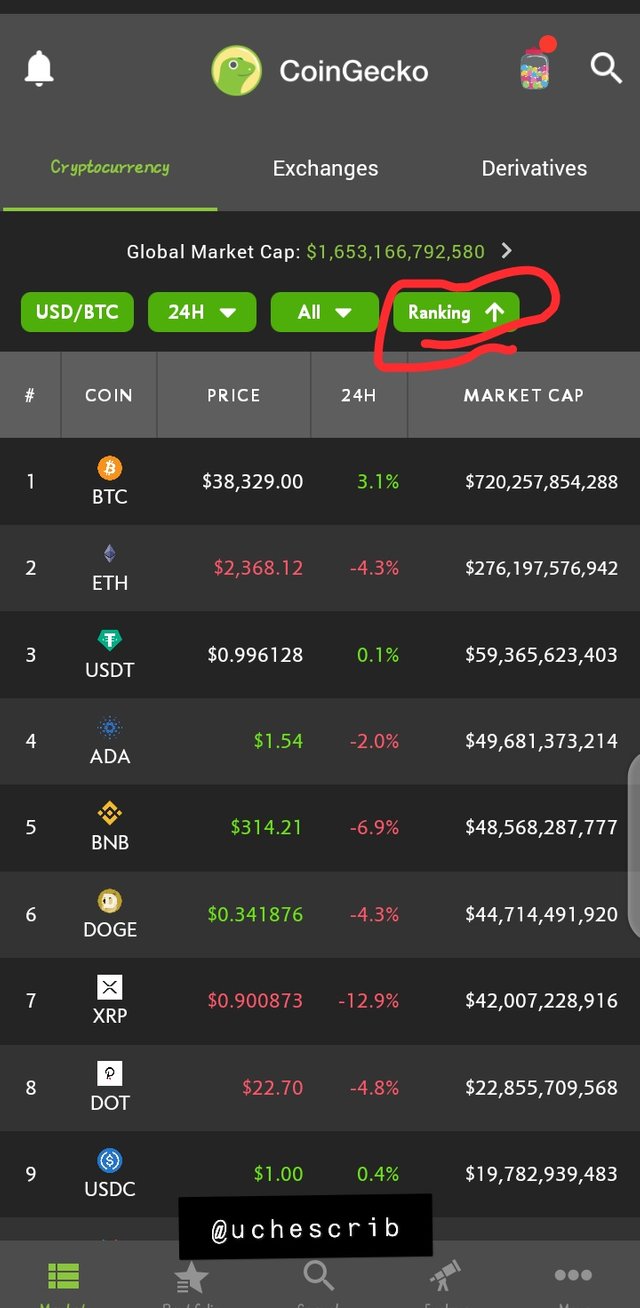
In this cryptocurrency list, you can;
switch price currency between USD and BTC. The default price currency is USD.
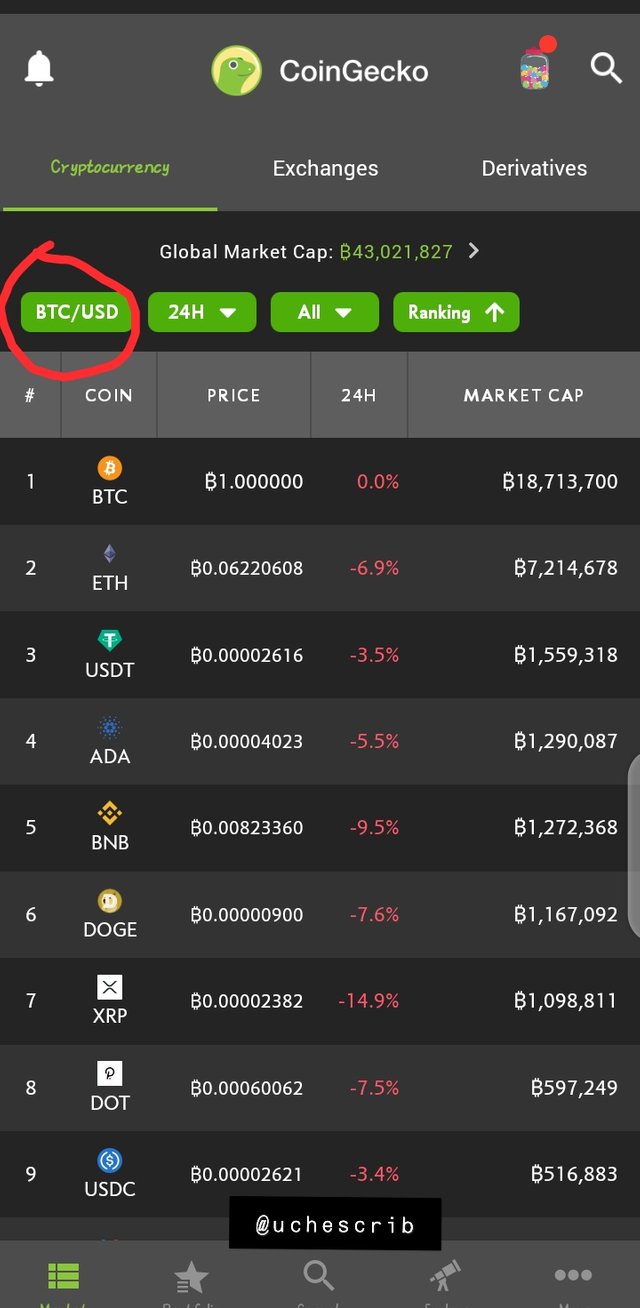
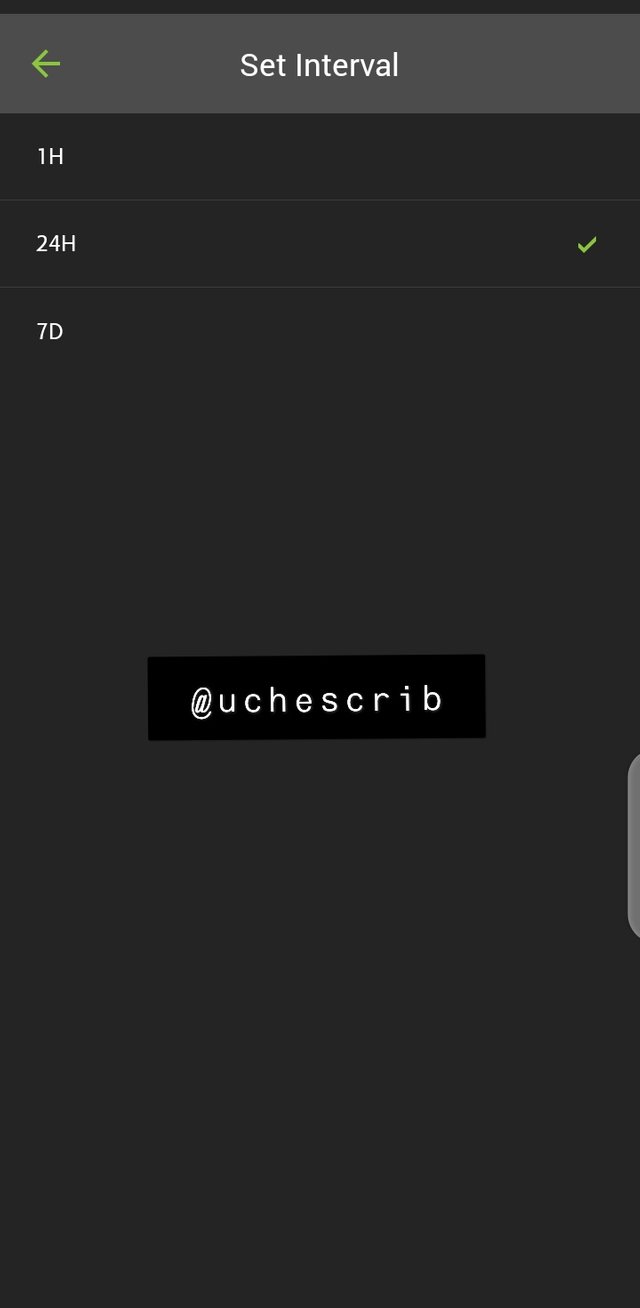
BTC price currencyset time interval for price movement
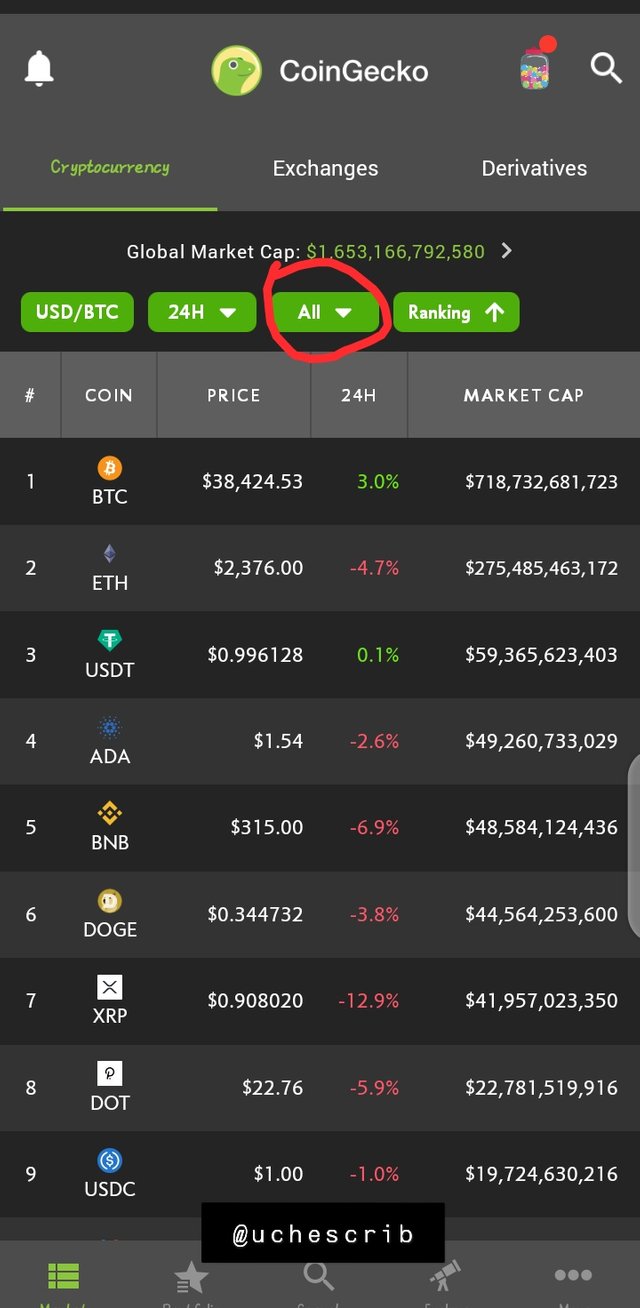
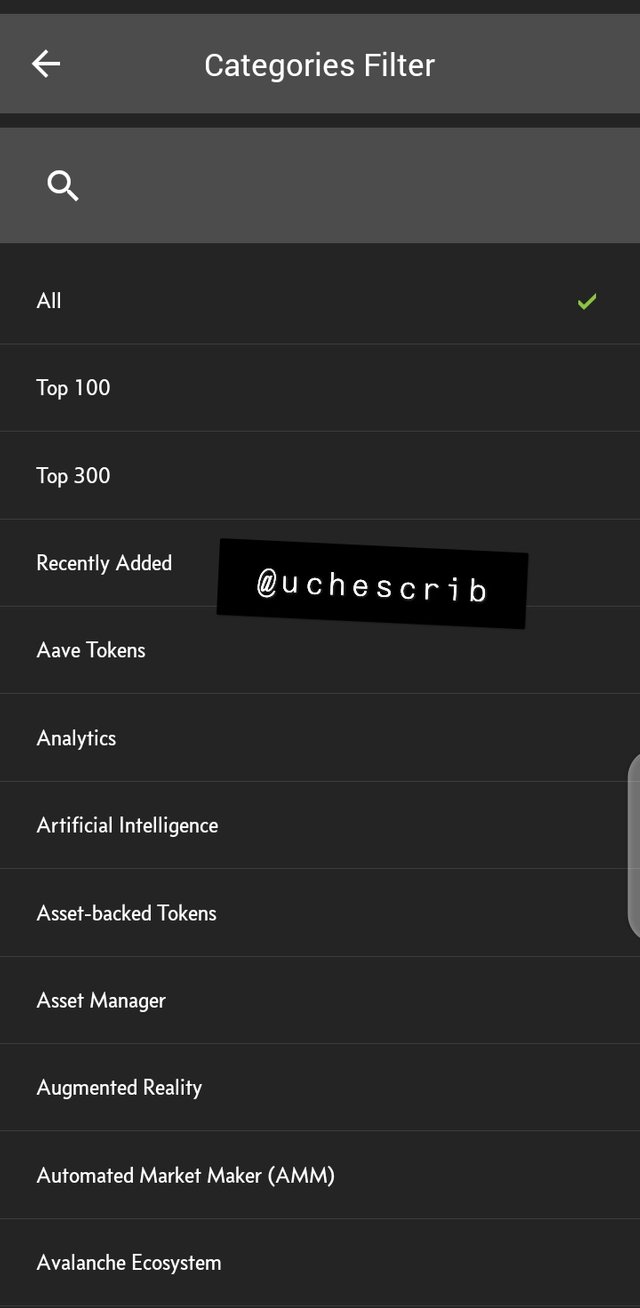
list cryptocurrencies based on category. The categories are 111 in number which include Binance Ecosystem, Collectibles, Derivatives, NFTs, etc.
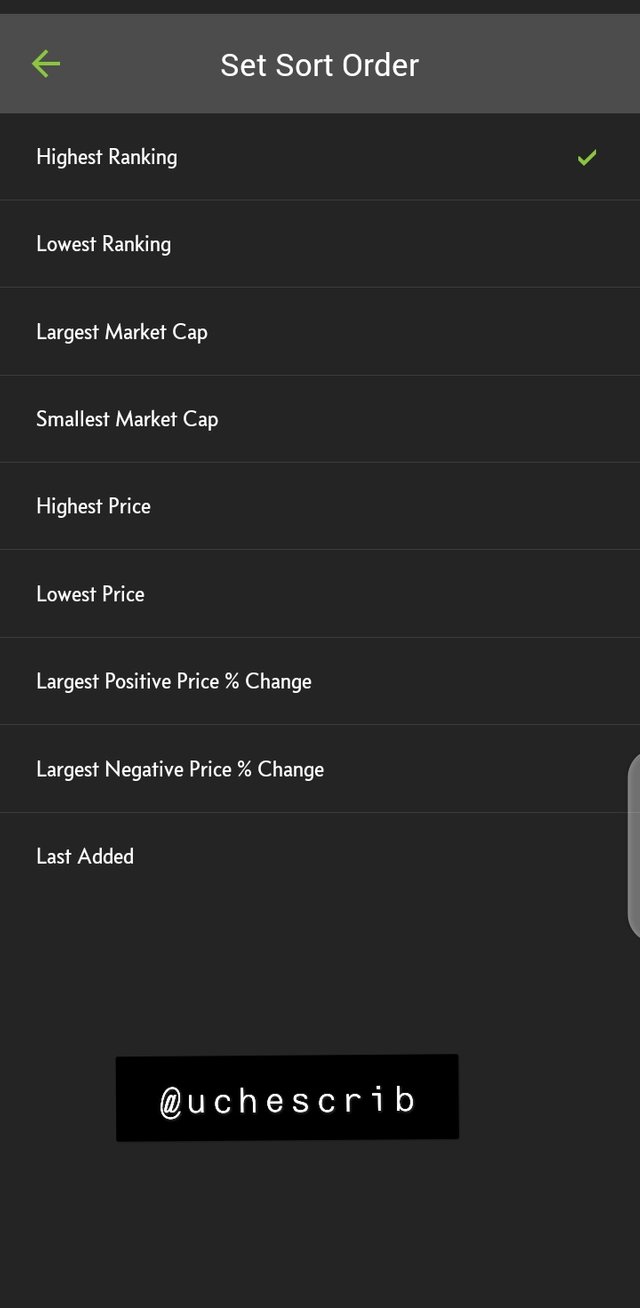
set the ranking system
Market Capitalization
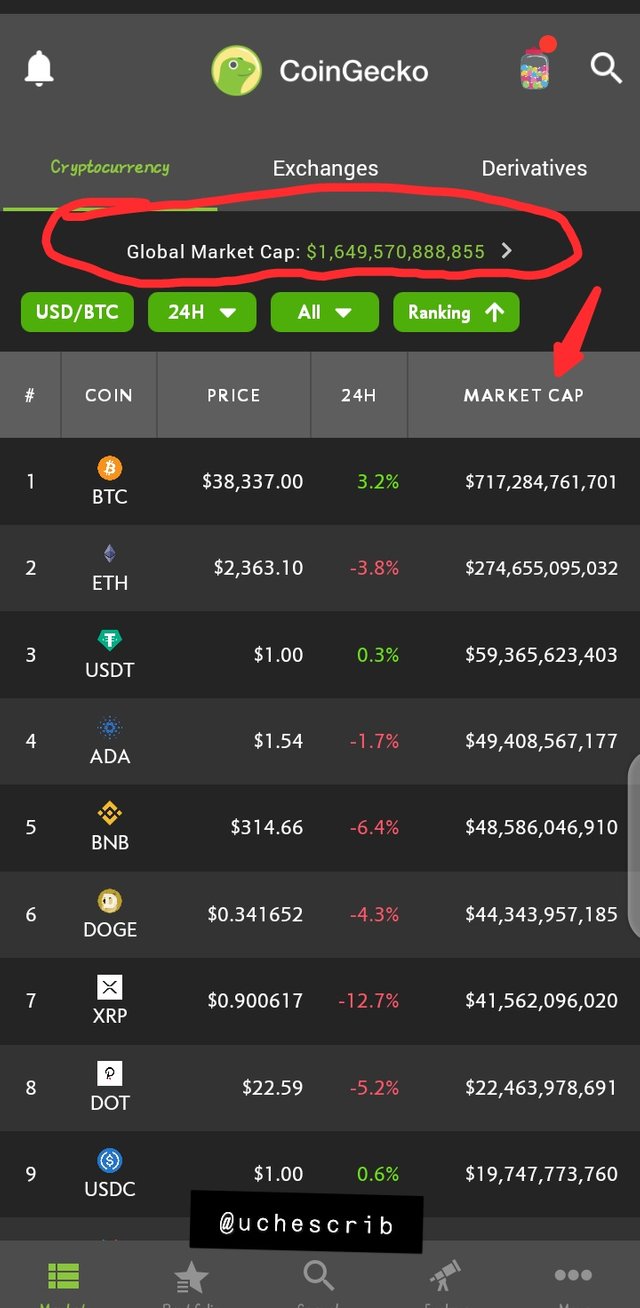
Coingecko displays the market cap of individual cryptocurrencies. It also displays the global market cap (i.e total market capitalization of all digital assets)
Search
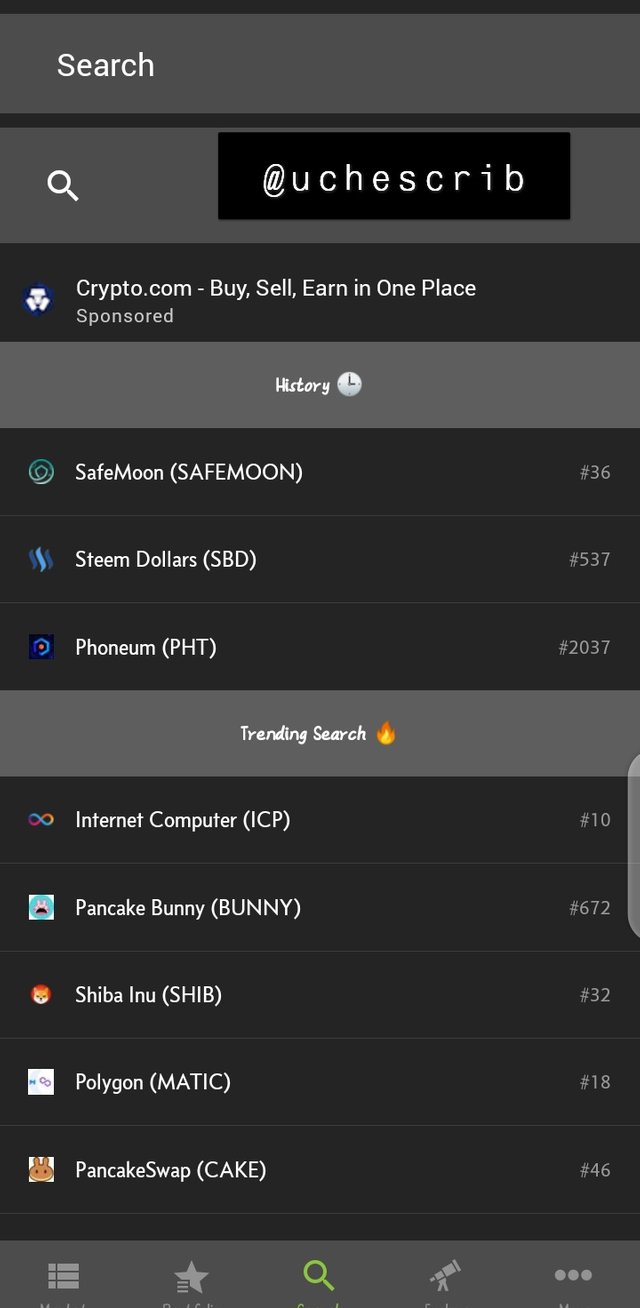
The platform offers a search interface for easy location of digital currency and assets.
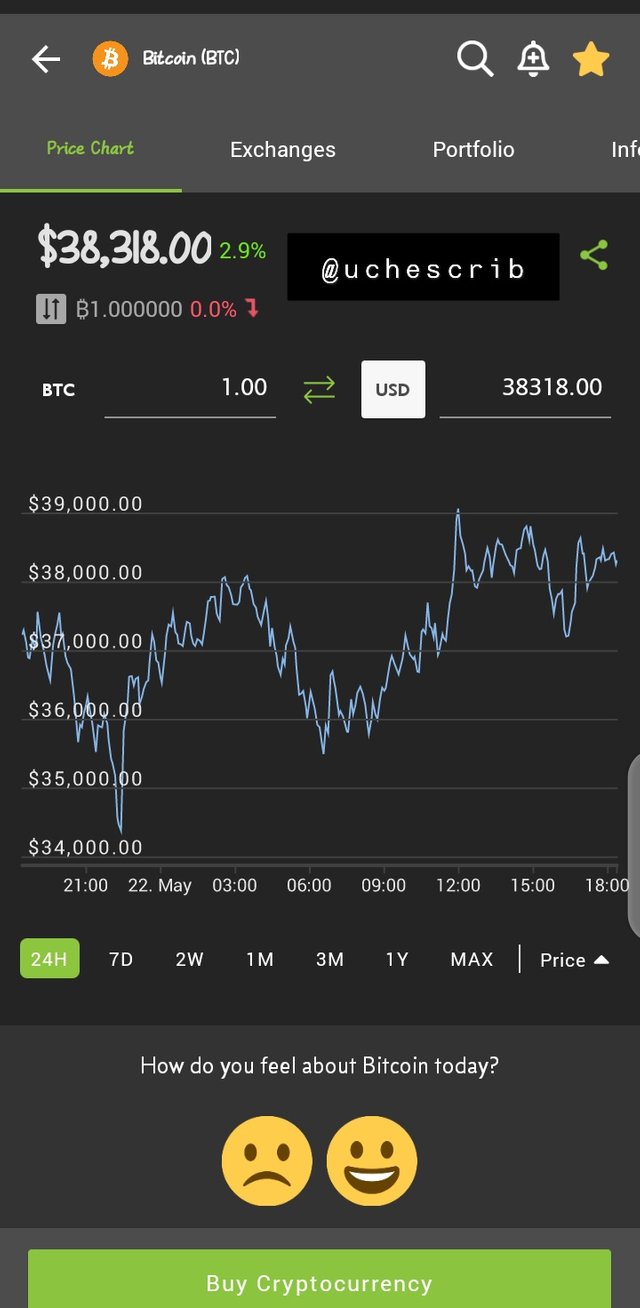
Price Chart
Coingecko displays the price charts of cryptocurrencies so that users can easily track the progress of these digital assets. Below is the price chart for Bitcoin.
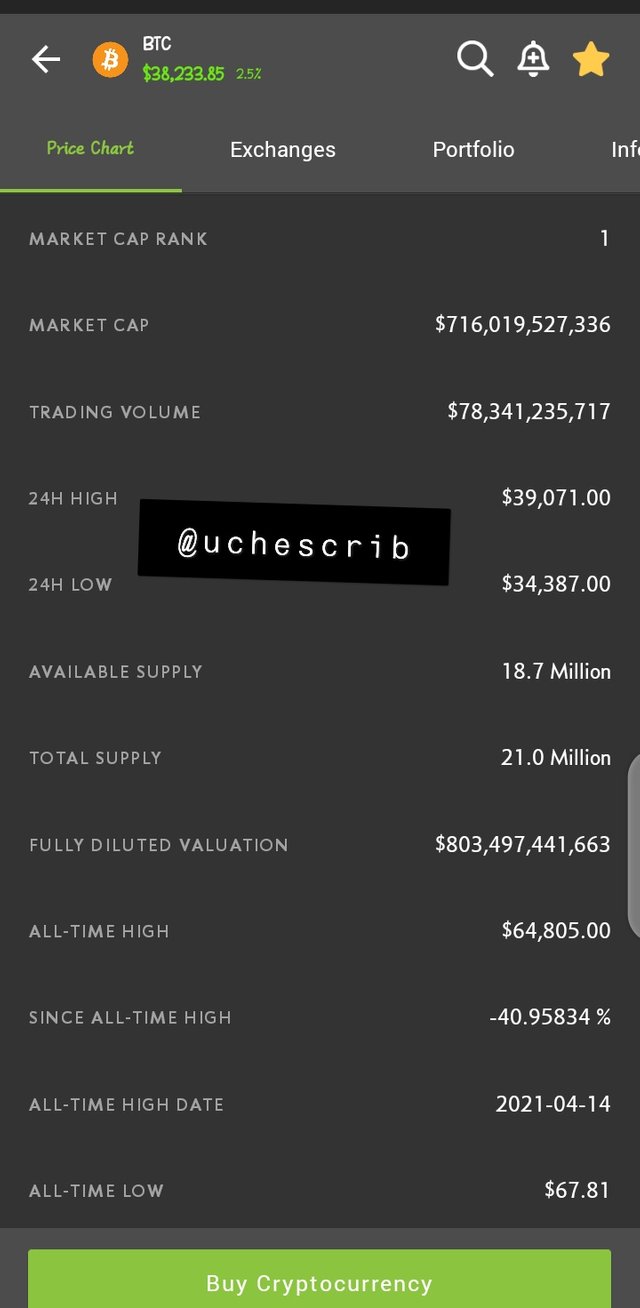
Digital Asset Info
Coingecko shows useful information ranging from market supply to social media handles of digital currencies listed.

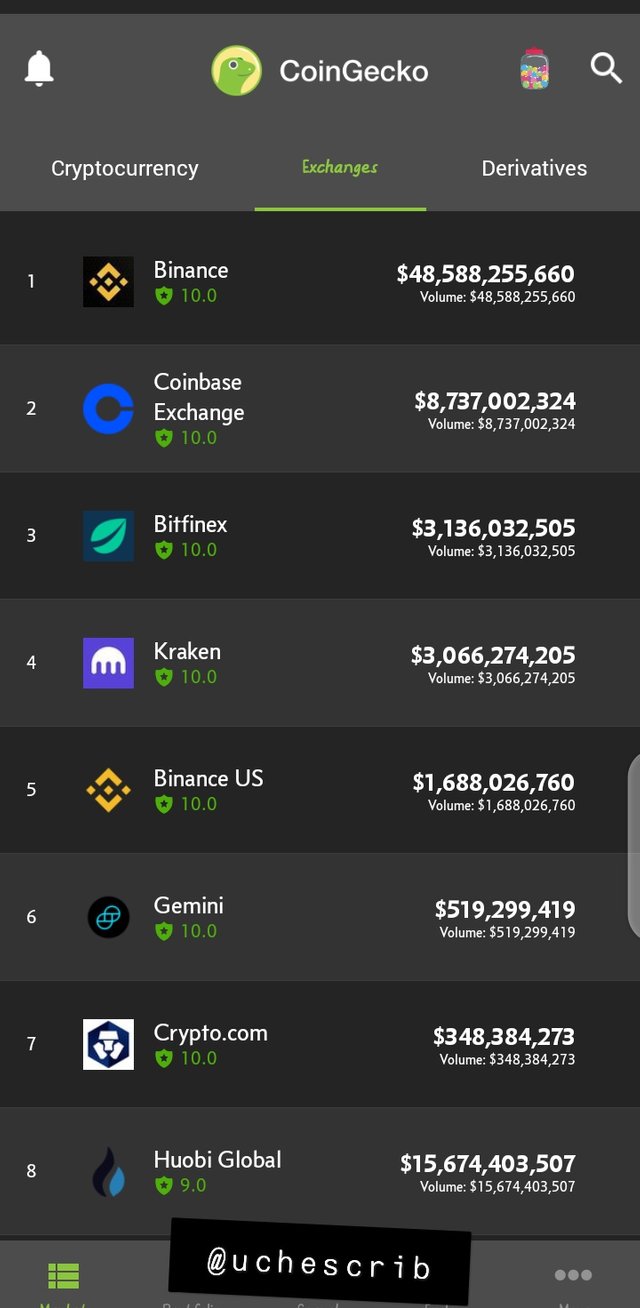
Exchanges
Coingecko shows the lists of exchanges by ranking. It also shows the trust grade of these exchanges so that investors would be able to pick good exchanges from bad ones.
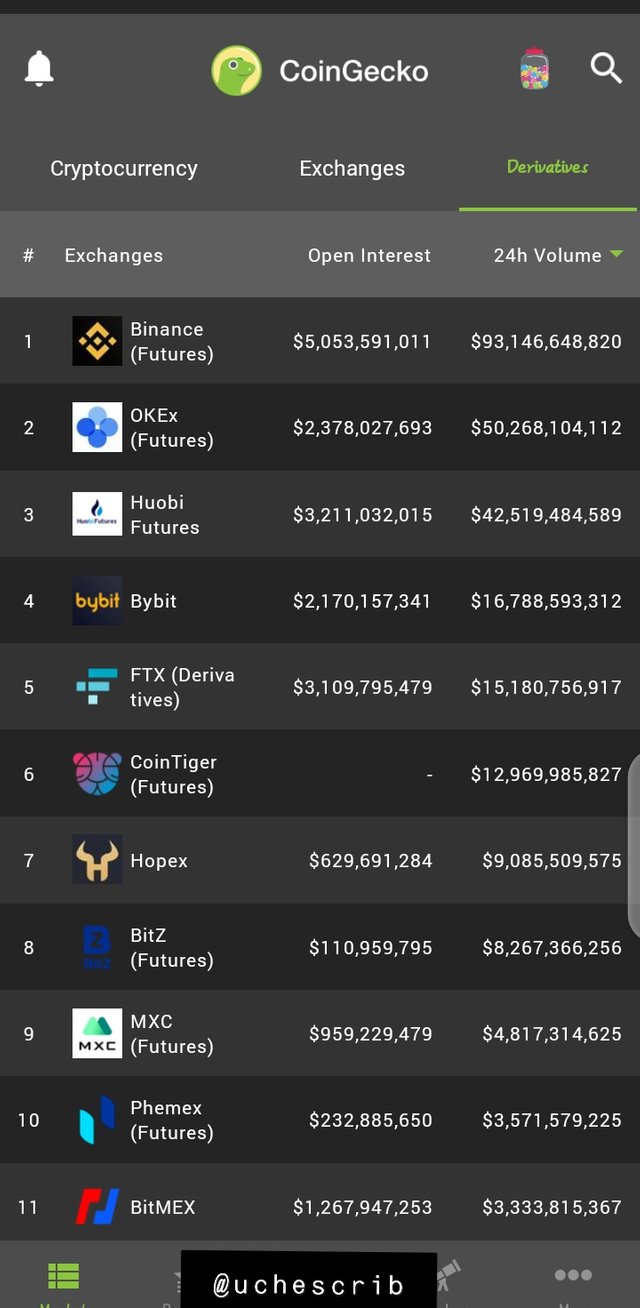
Derivatives
This refers to futures on exchanges. Coingecko ranks exchanges based on open interest under the derivative list.
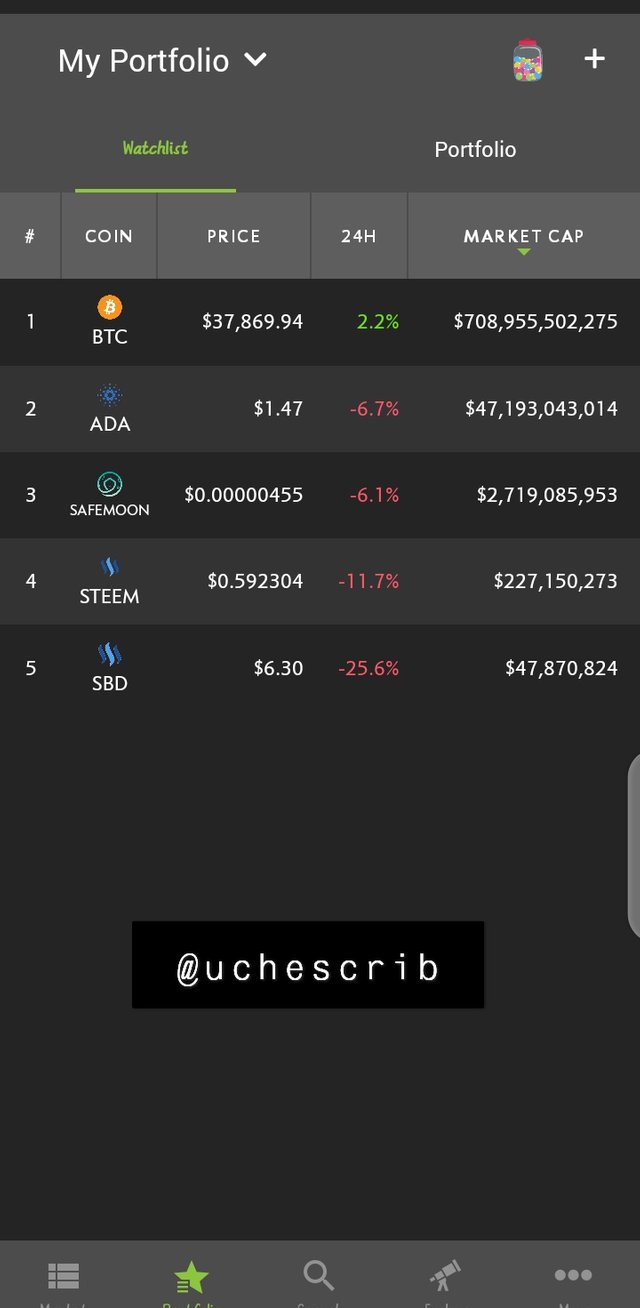
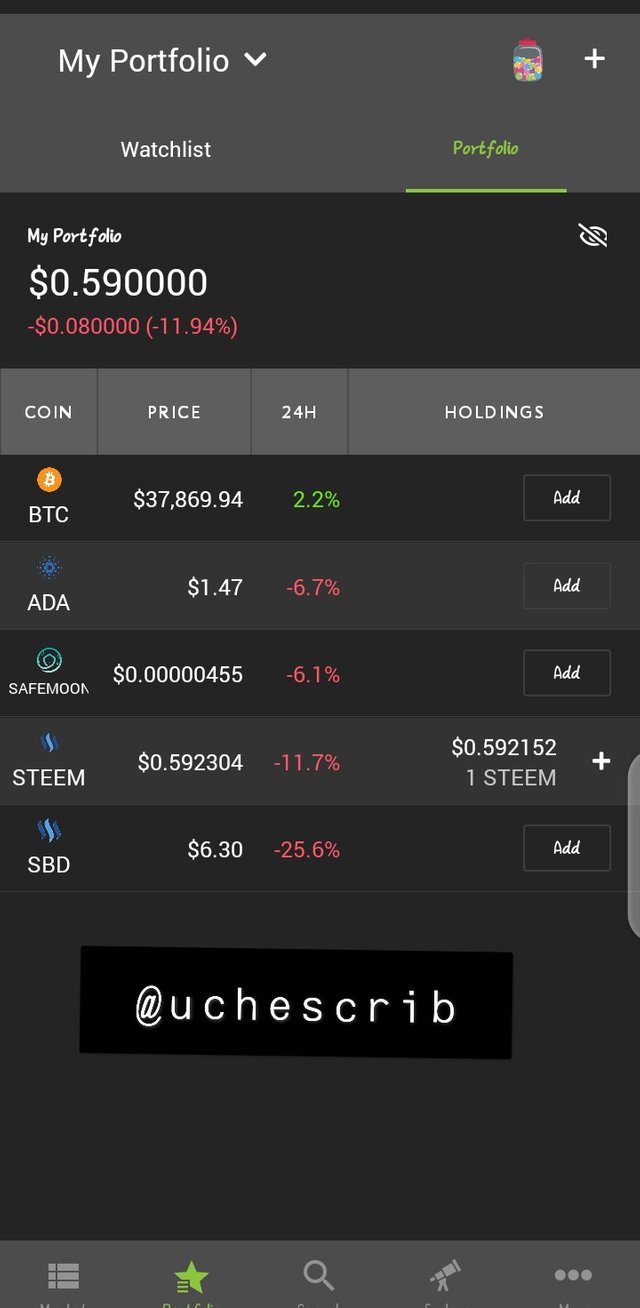
Watchlist and Portfolio
Coingecko offers a watchlist and portfolio where users can easily keep track of specific crypto assets.
News Updates
Coingecko makes news about cryptocurrencies available on the platform. This is more convenient for users because they get access to news concerning digital assets in one platform.

Weekly Price Forcast For Crypto Coin: STEEM
Steem is the cryptocurrency that powers the Steemit blockchain. Steemit is a decentralized platform which rewards its users with Steem. Users receive rewards for their contents and also for voting contents.
Steem was created by Dan Latimer, who is the CEO of BitShares, in 2014. The Steemit platform is one of the successful attempts at a decentralized social media.
Steem is divided into three units in the Steemit blockchain, which are
- Steem
- Steem Powerer
- Steem Dollars
Below are some statistical data for Steem
| Property | Detail |
|---|---|
| Current Price | $0.6005 |
| Rank | 184 |
| Market Capitalization | $227,818,198 |
| Trading Volume | $6,295,042 |
| Available Supply | 383.4million |
| Total Supply | Unknown |
| All-Time High | $8.19 |
| All-Time Low | $0.071990 |
Why Steem?
Why did I choose Steem? It is simply because I love this coin. I began using cryptocurrency in 2020. I bought 0.7eth which I later lost in the whole "forsage" period. Because of this, I took a break from the world of digital currency.
I joined Steemit in January 2021 and it has been a life changing experience. Because of Steem, I began my trading lifestyle again. Although it is advisable not to hold the Steem coin because its value is quick to drop, I actually hold at a small time period just like every other Steemit user.
I have made profits while trading this currency. I was even trying to get employed back in March, but did not show up for the job interview because I made a decision to focus fully on Steemit. I have not regretted that decision up till not because I have earned much more than the pay that the job offered.
Technical Analysis of Steem
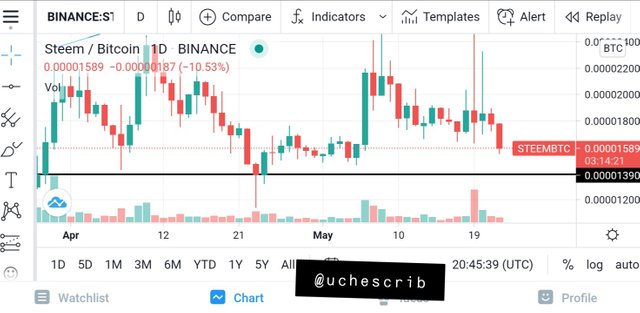
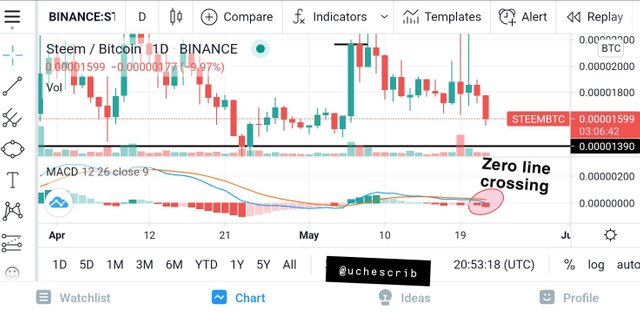
For this illustration, I used the STEEMBTC pair because I find it more convenient. I studied the chart and noticed that Steem formed a support at a point. At this point, the price bounced back upwards.
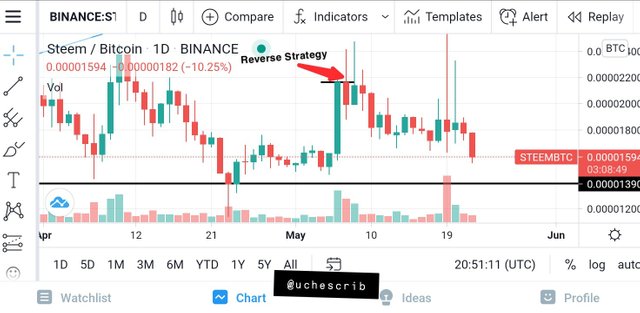
As the price moved upwards, it reached a point where the closing point of a day was the same as the opening point for the next day. I concluded that it signifies a market reversal in the bearish trend.
Because I know that it is unwise to rely on a single indicator during technical analysis, I decided to confirm the bearish trend using the MACD indicator. I found out that the MACD just crossed the zero line. This assured me that there would be a bullish trend.
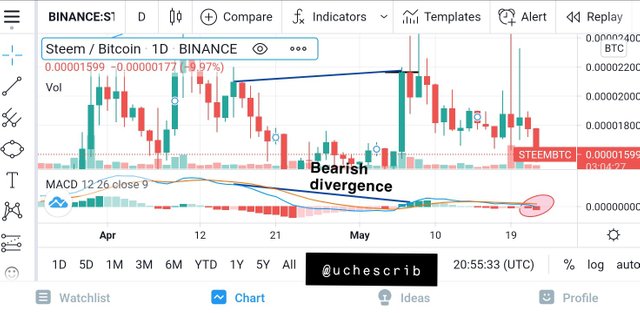
I also noticed a bearish divergence when using the MACD. This totally confirmed the bearish trend.
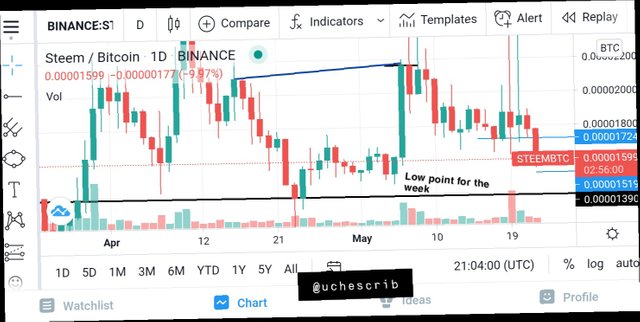
With this development, I concluded that the possible low level would be at the previous support level (about 0.00001390BTC), unless the Bitcoin dump continues. If the Bitcoin dump continues, the price may fall below that support line.
I also believe that Steem would not make any significant rise this week because of the bearish convergence. I am predicting that the possible high would be somewhere between 0.00001724BTC and 0.00001519BTC.

Conclusion
The Reverse Strategy is very useful in technical analysis of a 1-day chart just like the professor mentioned. This is because of the psychology of how a large number of investors close their positions at the end of the day and other investors use the opportunity to jump in.
From my research, I noticed that this strategy can also be used for small time frames too. In my illustration below, I tried it out on a minute chart and it worked like charm. The horizontal line represents the points at which the opportunity to use this strategy presented itself.
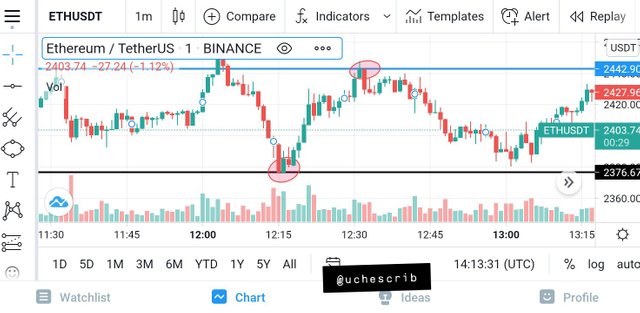
Finally, it is best to use this strategy with other indicators inorder to get the finest results.
Thank you for joining The Steemit Crypto Academy Courses and participated in the Homework Task.
thank you very much for taking participate in this class
Grade : 8
Downvoting a post can decrease pending rewards and make it less visible. Common reasons:
Submit
Thanks for the review sir
Downvoting a post can decrease pending rewards and make it less visible. Common reasons:
Submit