
Now to the assignment proper.

a) Explain the Japanese candlestick chart? (Original screenshot required).
b) In your own words, explain why the Japanese Candlestick chart is the most used in the financial market.
c) Describe a bullish and a bearish candle. Also, explain its anatomy. (Original screenshot required)

Explain the Japanese candlestick chart? (Original screenshot required)
The Japanese candlestick chart was developed by a Japanese rice farmer by name Munehisa Homma. The Japanese candlestick has proven to be very essential in the Technical Analysis of Cryptocurency asset. One of the very important function of this candle stick is that it helps traders identify trends, that is either Uptrend or Downtrend movement.
The candlestick apart from helping identify trends also helps traders properly plan their trade pattern, study the market flow to understand the asset market flow, setting if stop loss and profit taking level is also very possible with this candle stick and also very importantly the candle can be used in combination with other technical analytical tools to reduce trade loss and manage trading risk.
Now the Japanese candlestick on a default has two colours which is either Red or Green although on some trading platforms it can be black or white but is prone to what colour the trader likes to operate with. The Red colour indicates Bearish candle and the Green colour indicates Bullish candle.
The Japanese candlestick has three concept when talking about trend which are the Uptrend or Downtrend or Range. Therefore the candle stick can operate as a Uptrend that is when the asset is experiencing an increase in price towards the resistance region. Then the Downtrend when the asset price is moving down, experiencing a reduction in price moving towards the support level. Then the Range market were the price is continuesly in a straight line, just moving in a straight line here when this is experienced then the market price is experiencing an inactive state of inaction of seller and buyers.
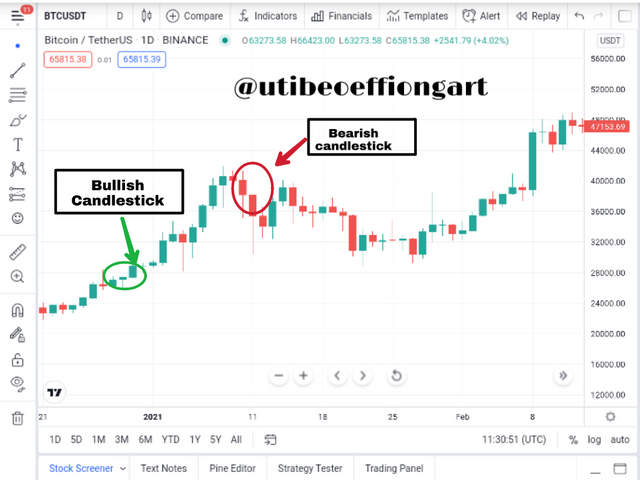
Screenshot from trading view
Now looking at the above picture the candle stick both the bull and bear candles that is the Green and Red candles respectively are segmented into parts from top to bottom each part owning it own meaning. Where we have the High, close, Open and low points of the candles.
Now the High stands for the Highest high of that particular time frame.
Close stands for the daily closing price of the candle at that particular time frame.
Open stands for the opening prices, this when the chart starts forming.
Then finally the low is the lowest low point of the candle stick. Can be called the support level.

In your own words, explain why the Japanese Candlestick chart is the most used in the financial market.
Below are the various reasons why traders use the Japanese candlestick most frequently in the financial market.
Ease of Usage
The Japanese candlestick among other technical analytical too is straight forward and easy to use even by an amateur trader. That the rise of the candles shows bullish movement of the candles, and the fall of the candles shows bearish movement and a continuous flow of the candles in the straight line shows range, this information alone allows old and new users to analyse the market with so much ease.
Compatibility with Indicators
The Japanese candlestick is most used with technical analysis Indicators because of is accuracy and response to the market flow. The Japanese candlestick has proven over the years to be very reliable to use when talking about combining it with other Indicators.
Reliability
Like I made mention of earlier, the Japanese candlestick has proven to be very reliable for Analysis. A trader can enter and exit trade with the use of this candlestick. With this candle stick the part such as the high, low, open and close helps traders to set thier trade entry entry and exit point successfully.
The Psychology of the Market
With the Japanese candlestick a trader just at a glance on the trading chart can determine who is control of the market. Whether it is the buyer or the seller that have the control at the time. This is seen through the position of the candles stick with effect on the support and the resistance levels.

Describe a bullish and a bearish candle. Also, explain its anatomy. (Original screenshot required)
Below are the description of the Bullish and Bearish candles and thier Anatomies.
Bullish Candle
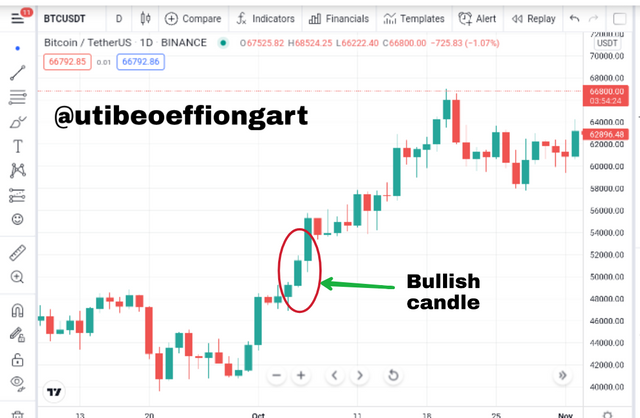
BTCUSDT chart showing bullish candles
The Bullish candle usually represented with the green color in most cases though they are prone to changes depending on the platform and traders preference. The candle showing an Uptrend means that the market price is in a bull run meaning a pull up in price or say an increase price rate at the time. So this bull run is usually shown by a cluster of much of the bull candles moving up as indicated in the above chart.
The Bullish Candle Anatomy
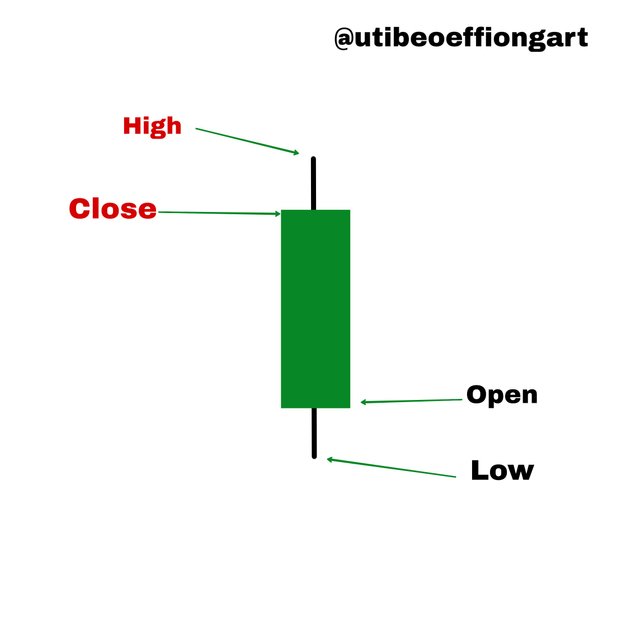
Bullish candle created by me on the PicsArt
In view of the picture above there are four cadinal points such as the High, Close and Close, Low.
High
The high point of the bullish candle is the highest price of the of the asset at that particular time frame. It is shown by the candle stick sticking out from the candle's body
Close
Now the close is indicated by the last point of the candle body usually the top part of the candles body. This is last point of the price for that period of time before there is proceeding into the next candle.
Low
This is the lowest price point usually seen at the buttom most part of the candle stick by a protruding stick from the candles body.
Open
This is were the candle sticks body starts to form showing where the trade entry is opened for the day.
Bearish candle stick
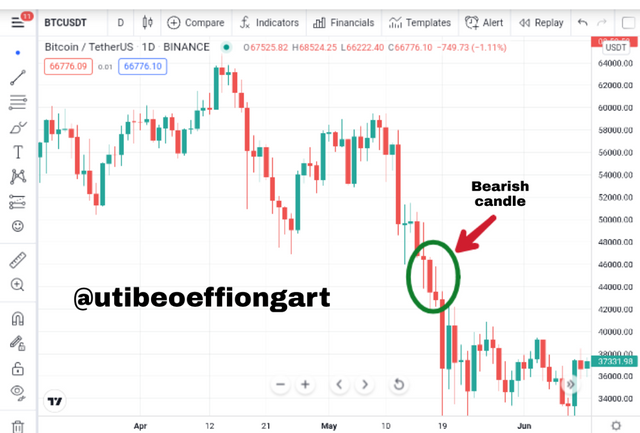
BTCUSDT chart showing Bearish candle
The bearish candle stick usually having the red color in a default settings except that the trader decides to change it to his/her preference. Now the bearish candle shows a Downtrend movement meaning that there is pull down in the market price causing the chart to begin to desend downward. This is usually cause by the activity of the sellers causing too much of the asset to be in the market which in effect causes the candles to begin to pull down till when the buyers begin to take action so a price reversal can be experienced.
The Bearish Candle Anatomy
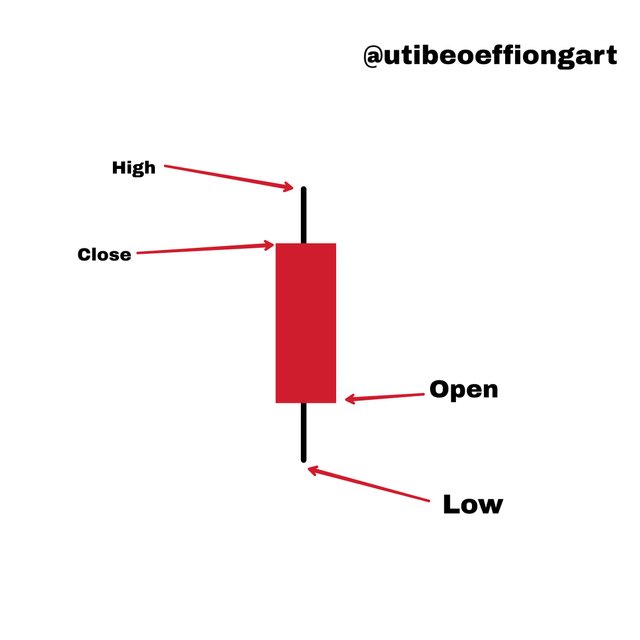
Bearish candle created by me on the PicsArt
In view of the picture above there are four cadinal points such as the High, Close and Close, Low.
High
The high point of the bearish candle is the highest price of the of the asset at that particular point. It is shown by the candle stick sticking out from the candle's body
Close
Now the closing point of the bearish candle is indicated by the last point of the candle body usually the top part of the candles body. This is last point of the price for that period of time before there is proceeding into the next candle.
Low
This is the lowest price point of the bearish candle usually seen at the buttom most part of the candle stick by a protruding stick from the candles body.
Open
This is were the candle sticks body starts to form showing where the trade entry is opened for the day. A time frame bound movement in the bearish candle.

Conclusion
Conclusively, the Japanese candlestick is very essential in the today trading analysis, this is so because of the advancement and development it has gone through and used at it maximum Capacity in most platforms. It compatibility with Indicators and analytical tools makes it even more interesting and vital to usage.
Thank you
Downvoting a post can decrease pending rewards and make it less visible. Common reasons:
Submit