image created by me on picsart
As usual I will express my understanding of this topic through the task questions.

Explain Confluence trading. Explain how a trade setup can be enhanced using confluence trading.
During technical analysis, price pattern signals are not totally trusted when using it signal for trading, In term of signalling when to exit and when to enter a trade in other to avoid losses.
It sometimes(price pattern) produce false signal which tends to mislead traders into entering and existing trade in a wrong time, which may expose them to losses or less profit.
In this case traders where left with no option than to bring a strategy where there combine confirmation tools to conduct trading analysis.
This strategy implies to confluence trading which occur when two or more technical analysis method are use in a chart in other to give confirmation or filter out false trade signal. To further express that, we can say it a process where two or more technical indicators are combine with a price pattern in other to confirm signal or filter out wrong signal.
How a trade setup can be enhanced using confluence trading.
Like I stated on my previous explaination, confluence trading potray's a situation where two or more analysis tools are added to chart in other to give confirmation or filter out wrong signal.
By combining this technical tools or indicator, a trader tends to reduces the risk of relying on one technical tools for trading signal.
Through this confluence trading, traders tends to receive more signals confirmation before proceeding to setup a trade, which will help them make a right decision when setting up this trade through the confirmation of different technical tools.
So it important to require several signal(both buy and sell signal)combined together to affirm a trade decision. Also applying confluence for trade setup reduce risk and make probability of wining in the trade high.
screenshot from tradingview
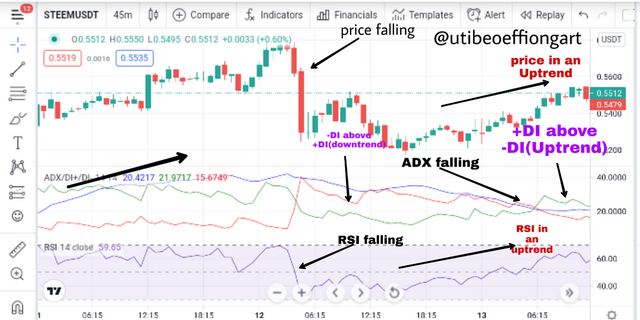
From the STEEMUSDT chart above, I combined the ADX indicator and the RSI indicator, the +DI and -DI is also available which also serve as a corrector or filter.
As seen on the chart, at beginning of the chart the technical tools trend proceeded well with the ADX, RSI and the market price aligning, toward some point the market price fell and the RSI and the ADX follow suit.
But as some point disparity started, the market price and the RSI started moving in an upward direction but the ADX continue in a downtrend, here the false signal showed by the ADX was corrected or filter out by the RSI indicator, where the RSI corresponded with the market price trend.
Looking closely to the chart you will notice the +D and -D, here the corrected the price in a way that, the crossing reflected the market price on the chart and toward the end of the chart the +DI was above the -DI showing an uptrend which filtered out the false signal by the ADX indicator which was showing a downtrend.
Through this illustration, a trader should be able to understand that the confirmation from the RSI indicator gives a go ahead to place a trade as we all know that using one technical tools for technical analysis is not 100% trusted, so there is always need to combined indicators in other to filter out errors and false signal.

Explain the importance of confluence trading in the crypto market?
Below are the importance of confluence trading in crypto market.
When trader use confluence trading strategy there are rest assured of trading signal which are accurate and profitable.
For example, using a single technical analysis tool which is 40% accurate when predicting price movement then combine it with two or more technical analysis tools to filter your decision, you tend to increase the chance of winning in the trade.By using confluence trading, traders tend to reduce the risk of depending on one particular trading techniques which might indicate a false signal then lead traders in to wrong trading decision, so by using the confluence trading traders are confident of their trading decision cause of the confirmation of signal from different technical analysis too.
when using confluence trading, trader can filter out trade setup, when some technical tools on the market doesn't correspond or align with each other, that is to say when providing different trade signal.
Using confluence trading, it provides a way of confirming a valid potential buy or sell signal which helps the trader to know exactly when to buy and sell asset in the market.

Explain 2-level and 3-level confirmation confluence trading using any crypto chart.
2 level confirmation confluence trading simply means using 2 technical tools or indicator to confirm a trade setup in other to confirm or filter out false signal which may occur when using a single technical tools.
This can be done base on the trading tools which can best suit your trading style.
screenshot from tradingview
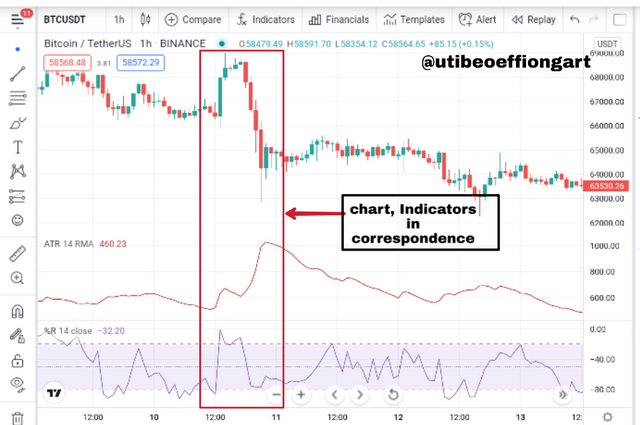
The BTCUSDT chart above portrays a 2 level confirmation confluence trading where I use the %williams indicator in combination with the ATR indicator.
Now applying the %williams indicator in combination with the ATR indicator, looking at the BTCUSDT indicator afore, we can observe an agreement of the two indicator which is showing high volatility with the market price, though the %williams indicator is not a volatility base indicator but it more of a trend related indicator, when it is use with other indicator, it tremendously help.
The above chart portrays a response of the two indicator with respect to the market price, for the fact that it shows the same signal, a trader can be confident to enter a trade without fear of entering with wrong signal.
Unlike 2 level confirmation confluence trading, 3 level confirmation confluence trading simply means using 3 technical tools or indicator to confirm a trade setup in other to filter out false signal which may occur when using a single or two technical tools.
This 3 level confirmation gives more accuracy and are trusted than the 2 level confirmation.
The higher the level of confirmation the higher the accuracy and edge over trade setup.
screenshot from tradingview
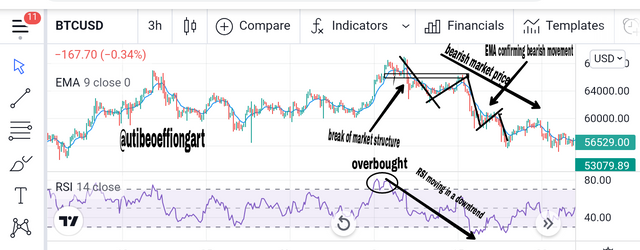
For the BTCUSD chart above, we can see that 3 confirmation tools where use which are the RSI, the moving average exponential and the break of market structure to confirm the sell signal.
From the chart we can observe how the break of market structure confirm the price movement which formed a higher high and high low before it break out at the point I indicated on the image above and also we can see how the RSI move to a point of overbought and then fall to a bearish movement. Finally the EMA indicator also showed the same signal to confirm the bearish movement, by trending above the price in a downward movement.
All this serves as a go ahead to place a sell trade.

Analyze and Open a demo trade on two crypto asset pairs using confluence trading. The following are expected in this question.
a) Identify the trend.
b) Explain the strategies/trading tools for your confluence.
c) What are the different signals observed on the chart?
Buy order
screenshot from tradingview
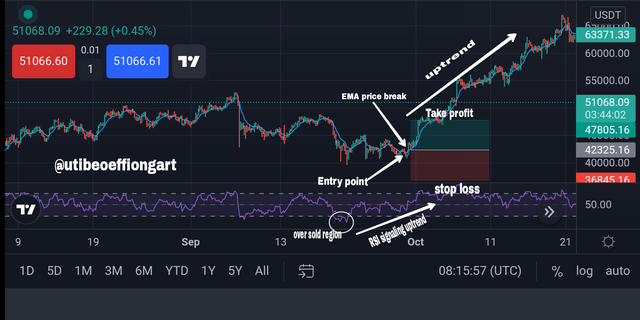
Above is a BTCUSDT chart on a 4hrs time frame, as showed on the chart the price was making a series of higher high and higher low after the break in the market which indicates a bullish market.
From the chart above, I used a 2 level confirmation confluence trading for the bullish set up. I used the RSI indicator and the EMA indicator to confirm the bullish reversal.
From the chart we can see how the RSI indicator was in the oversold region where it was below the 50 threshold. This was a signal that the will be a possible trend reversal to the upward direction as seen above.
To confirm the trend reversal signal from the RSI I added the EMA indicator. Using the EMA I check well if the price has break above the EMA line. Has seen on the image the price successfully breaks above the EMA line signalling a possible bullish reversal.
From the chart, we saw how the price enters the oversold region of RSI which was a signal of a bullish trend and also we can see how price breaks above the EMA line which the EMA line trends below the price, all this signals a bullish trend.
After confirming the corresponding signal from the RSI and EMA indicator, I then took a buy order where I set my take profit at 51077.59 then my stop loss 51066.88.
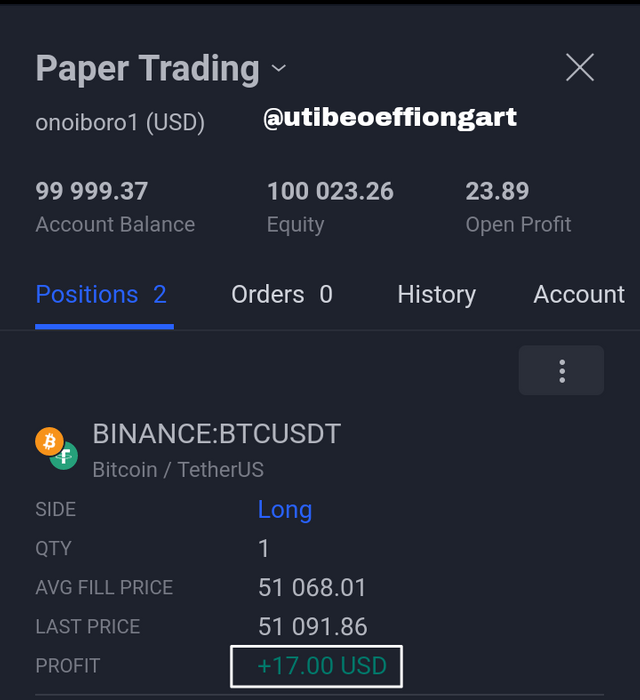
Below is the result of my trade
screenshot from tradingview
Sell order
screenshot from tradingview
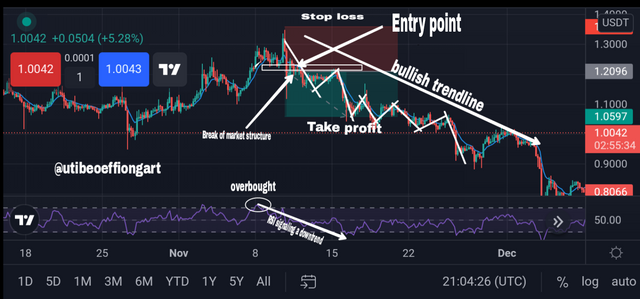
Above is a XRPUSDT chart on a 4hrs time frame, as showed on the chart the price was making a series of lower high and lower low after the break in the market which indicates a bearish market.
From the chart above, I used a 3 level confirmation confluence trading for the bearish set up. Which are the RSI indicator, the EMA indicator and the break of market structure to confirm the bearish reversal.
From the chart we can observe how the break of market structure confirmed the bearish movement by making an high that is higher than the previous high, this cause the break of previous low which breaks to the downside and also we can see how the RSI move to a point of overbought which was above the 60 threshold and then fall to a downward movement. Finally the EMA indicator also showed the same signal to confirm the bearish movement, by trending above the price in a downward movement.
All this signals is a confirmation for a downtrend reversal ( bearish trend reversal ).
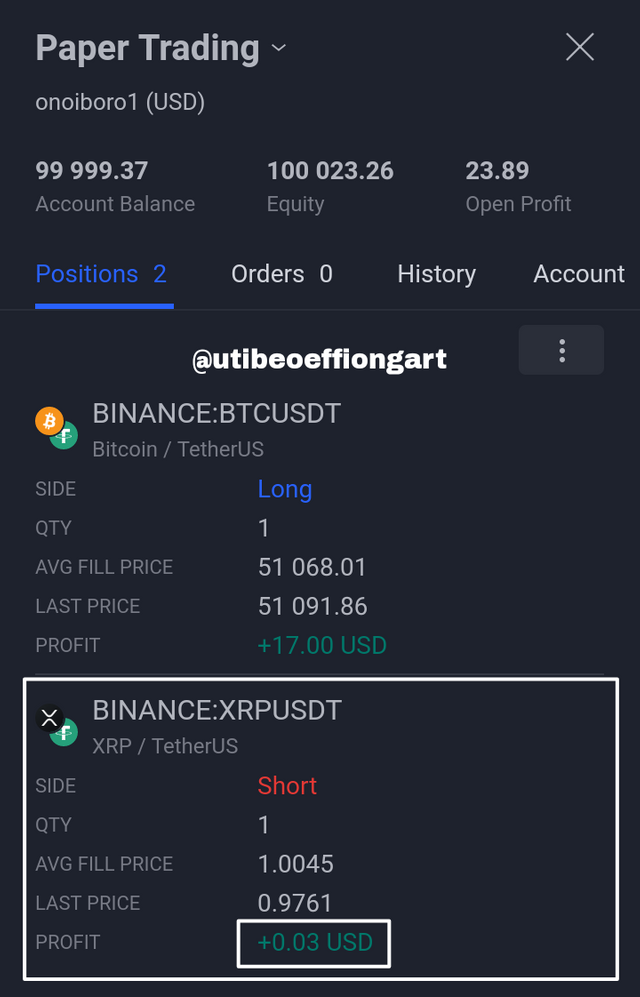
After confirming the corresponding signal from the RSI and EMA indicator and the break of market structure, I then took a sell order where I set my take profit at 0.9759 then my stop loss 0.9742.
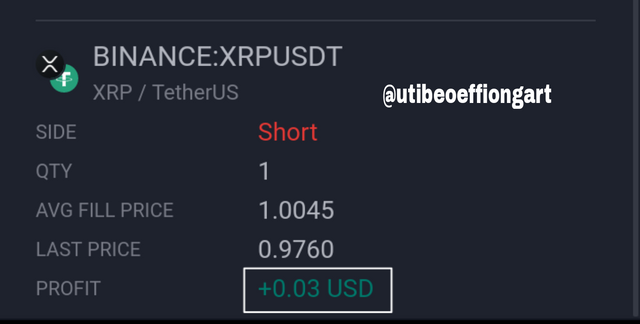
Below is the result of my trade.
screenshot from tradingview
screenshot from tradingview

Confluence trading occur when two or more technical analysis method are use in a chart in other to give confirmation or filter out false trade signal. For example using two or more indicator in a chart in other to confirm or filter out false signal.
Confirming signal is one important strategy every trader should engage in, cause of the high risk of losses in the crypto market.
When a trader confirms a valid potential buy or sell signal it help him/her to know exactly when to buy and sell asset with confidence of not trading with a false signal.
Indeed this topics as been my most interesting topics in the crypto academic this week,has have been able to expand my knowledge and understanding on confluence trading and trading as a whole, thank you prof. @reminiscence01 for the well explanatory lecture.
Downvoting a post can decrease pending rewards and make it less visible. Common reasons:
Submit
Hello @utibeoeffiongart , I’m glad you participated in the 6th week Season 5 of the Beginner’s class at the Steemit Crypto Academy. Your grades in this task are as follows:
Observations:
There's confusion in your chart analysis. Try to make your chart analysis as clean as possible.
Recommendation / Feedback:
Thank you for participating in this homework task.
Downvoting a post can decrease pending rewards and make it less visible. Common reasons:
Submit