
Now to the lectures proper.

What is your understanding of the Liquidity Level. Give Examples (Clear Charts Needed)
Liquidity level
Liquidity refers to the ability of an asset or coin to be easily converted to a real cash without a converse effect on the market price. When there is a converging order for sell or buy positions then such points are tagged as liquidity levels because they fill in the market order.
So traders place buy and sell order expecting the market to trigger the position so they take advantage of the profit or set thier stop loss incase the price goes beyond their profit margin. This buy and sell order in the market is what determine the Liquidity level, were there is a high sell point marked by the pinbars candle stick and also the buy positions marked by this same candle stick.
Below is a clear chat showing the volatility levels.
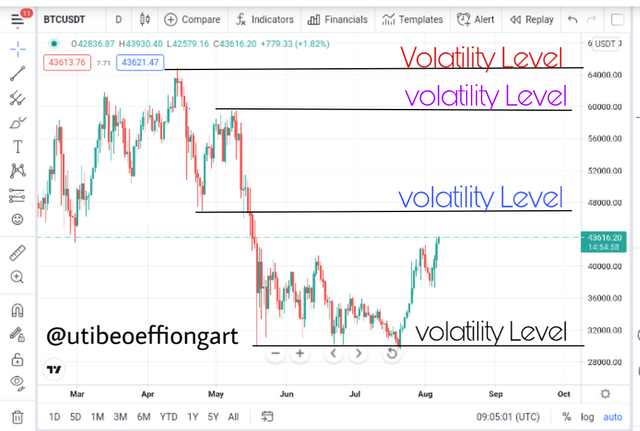
Clear BTCUSDT Chart showing Volatility levels
Looking at the chart above at the middle of the month between April and May 2021 there was price bull hitting a resistance level showing that the traders placed some sell orders and then reversal at the month of May were buy orders were placed by traders. So at those two points of buy and sell there are cash flows resulting in market volatility.

Explain the reasons why traders got trapped in Fakeouts. Provide at least 2 charts showing clear fakeout.
Fakeout
This is a condition experienced when bigger financial institutions or whales in the crypto market take advantage of liquidity levels thereby causing retail traders to loss out while they make massive Profit.
Now a trader(retailer) Sees an Uptrend or Downtrend in the market and wishes to take advantage of the trend and also send his stop loss, but then there is a back lash boom the market reverses hitting the retailers stop loss causing some massive Fakeout.
Now this is caused by the big financial institutions reinvesting in the market and causing an abrupt reversal from the normal trends causing a hit on an already set stop loss of a retailer and thereby causing losses.
In this cases the retailer is being traped and looses while the whales trader moves free and gains.
I might want to deviate a bit and say that the whales traders can also use some fundamental news to cause Fakeout trapping, in that they make a news of a proxy investment and the retail traders invest their tokens setting thier stop losses and take profit just for the reverse to happen an the whales gain while they loose.
Below are two chats to show fake out for buyers and sellers cases..
When buyers are trapped.
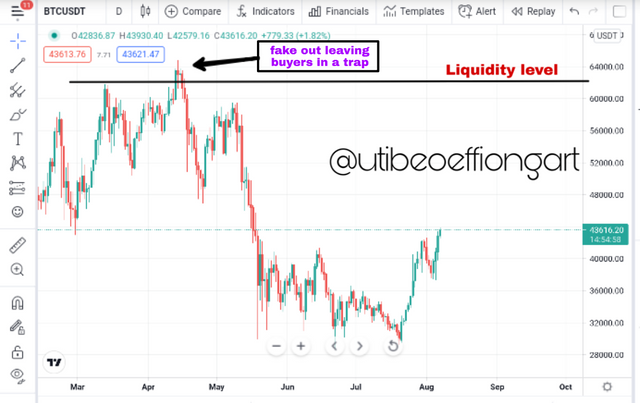
In view of the chat above at the point between April and May 2021, there is an increased activities of selling of the BTCUSDT causing liquidity at the time. So at this point the trader sets his stop loss above the Liquidity point but then just for the market to hit the set stop loss and the market takes a downturn trapping the traders and conversely causing a loss to the retail traders.
When sellers are trapped
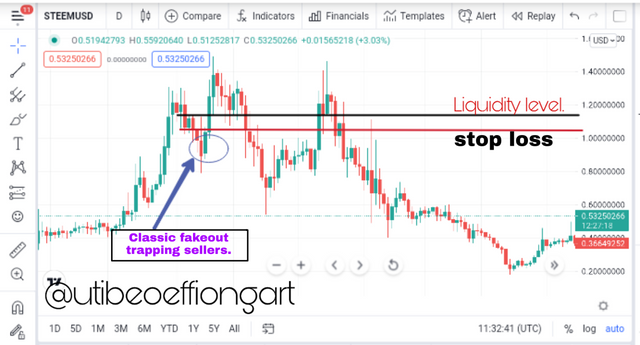
Looking at the chart shit of the STEEMUSD pair the price takes a downtrend showing a large Investment of the whales on the trend making it go that direction. A trader seeing the Liquidity approach is decieve so he/she sets the stop loss as seen the above. But then there is a converse reaction triggering the stop loss because of a reinvestment made by whales so the market takes a u turn and then proceeds to hit the set stop loss, trapping the trader in between and causing losses.

How you can trade the Liquidity Levels the right way? Write the trade criteria for Liquidity Levels Trading (Clear Charts Needed)
Trading liquidity level the right way
There are two strategies that can help us trade the Liquidity levels well without falling into the trape of the fake out set up by the whales traders, this strategies include the market structure break and Break retest break. So Below we are going to be seeing the buy and sell positions after the two strategies.
So we will be considering the following to achieve this right trading.
Locate a good liquidity level.
Check for the point were the chart meets any I the two strategies.
When we get the MSB or BRB we set out the sell or buy positions.
Market Structure Break
For Buy position.
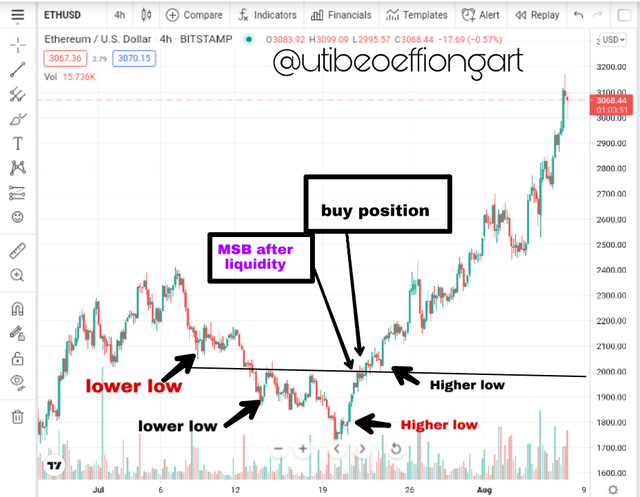
The above is a 4 hour ETHUSD chat showing MSB after liquidity level.
The following conditions are to be met for the sell position to be gotten.
Check the liquidity level in the market price and indicate it. After that wait for the market to show Market structure break strategy.
Market should be in Downtrend. Either long term or short term
the market price should make a higher low after a series of lower lows.
After that mark the neckline after the higher low.
After that, Watch out for the condition were a bullish candle will breakout the neckline. This is called Market Structure Break.
Now, you can take the Buy Trade where your entry price is just above the market structure break point
For Sell position.
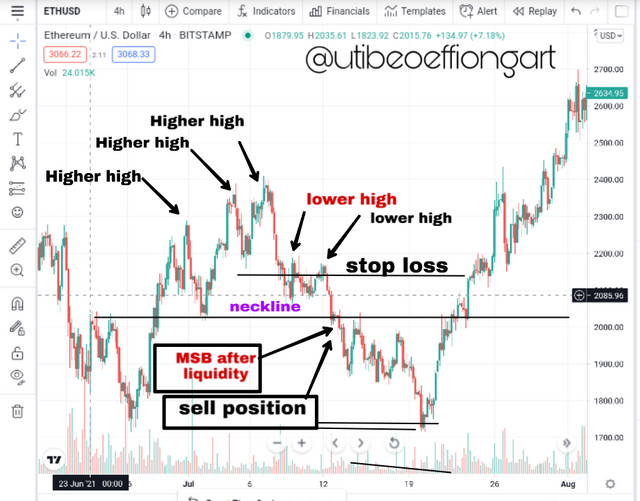
The above is a 4 hour ETHUSD chat showing MSB after liquidity level.
The following conditions are to be met for the buy position to be gotten.
Check the liquidity level in the market price and indicate it. After that wait for the market to show Market structure break strategy.
Market should be in uptrend. Either long term or short term depending on your time frame.
the market price should make a lower high after a series of higher highs.
After that mark the neckline after the lower high
After that, Watch out for the condition were a bearish candle will breakout the neckline. This is called Market Structure Break.
Now, you can take the sell Trade where your entry price is just below the market structure break point
Break Retest Break
For buy position
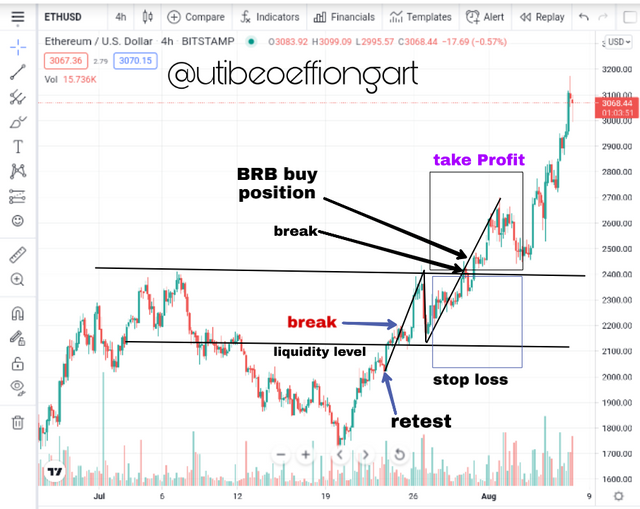
The above is a 4hr ETHUSD chart showing the BRB.
Below are the conditions to be met for the buy positions to be valid.
Lookout for the liquidity level in the market price and mark it. After that wait for the market to show break retest break strategy.
Mark a resistance line were your Liquidity level is working as your resistance line for BRB trading strategy.
After that, wait for the price to breaks the resistance level and create a good swing high point above the resistance break.
after the swing high point check for retest of resistance level that means price move towards resistance level and bounce back to an uptrend.
after that, look out for the price to make another swing high point higher than the former high
Now to take your buy entry, check the point just above the swing high point break line. That will be your buy entry position.
For sell position
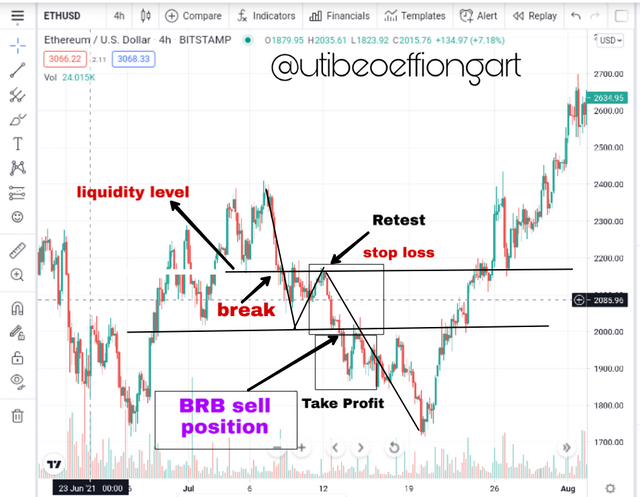
The above is a 4hr ETHUSD chart showing the BRB.
Below are the conditions to be met for the sell
positions to be valid.
Lookout for the liquidity level in the market price and mark it. After that wait for the market to show break retest break strategy.
Mark a support line were your Liquidity level is working as your support line for BRB trading strategy.
After that, wait for the price to break the support level and create a good swing low point below the support break.
after the swing low point check for retest of support level that means price move towards support level and bounce back to an uptrend.
after that, look out for the price to make another swing low point lower than the former low
Now to take your sell entry, check the point just below the swing low point break line. That will be your sell entry position.

Draw Liquidity levels trade setups on 4 Crypto Assets (Clear Charts Needed)
Liquidity level trade setup
Now I'll be creating a liquidity trade set up for 4 Cryptocurency assets using the MSB strategy
Note all are for the sell position

ETHUSD chart
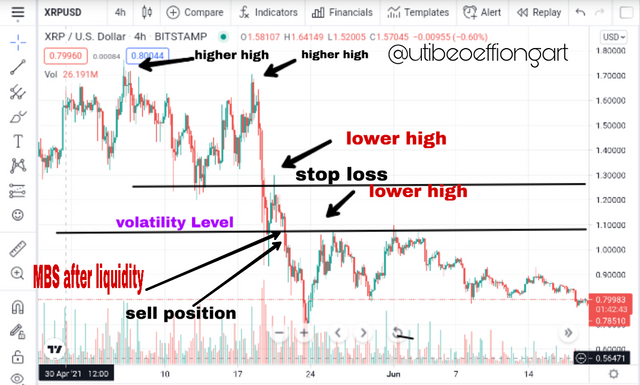
XRPUSD chart
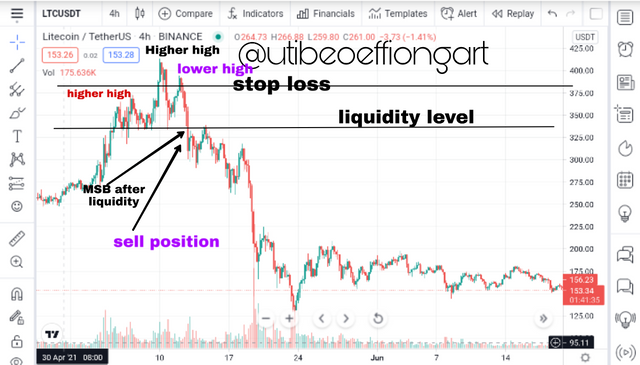
LTCUSDT Chart
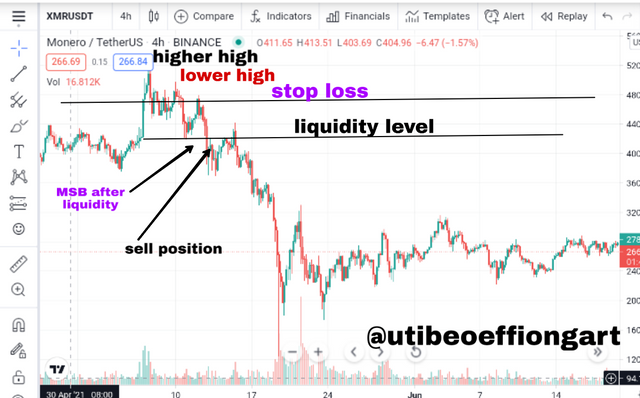
XMRUSDT chart
Conclusion
This is yet another great strategy which gives traders more confidence on trends. This trend level like the Liquidity level is always manipulated by the whales trader. But a good understanding of the trading of the Liquidity level the right way entells more profit making and loss aversion.
Thank you
Downvoting a post can decrease pending rewards and make it less visible. Common reasons:
Submit
Dear @utibeoeffiongart
Thank you for participating in Steemit Crypto Academy Season 03 and making efforts to complete the homework task. You got 6/10 Grade Points according to the following Scale;
Key Notes:
We appreciate your efforts in Crypto academy and look forward for your next homework tasks.
Regards
@cryptokraze
Downvoting a post can decrease pending rewards and make it less visible. Common reasons:
Submit
Thank you professor @cryptokraze.. what an oversight on my first chat, thank you for the correction.
Downvoting a post can decrease pending rewards and make it less visible. Common reasons:
Submit