It's good to be back again for this weeks lectures.. Plus attending to this great lecturers assignment Prof. @kouba01.
I want to specially thank the Prof @kouba01 for this apt and great lectures, it was very Educating. More Grace sir.
Now to the assignment proper.

QUESTION 1
WHAT IS RELATIVE STRENGTH INDEX AND HOW IS IT CALCULATED.
MY ANSWER
WHAT IS RELATIVE STRENGTH INDEX
This is basically a tool, technical indicator, or an oscillating indicator used as an additional tool to analyze the market price fluctuations of an asset or currency.
The RSI basically moves in an oscillating manner, that is downwards and upwards movement as the price fluctuates and this helps the trader to take advantage of this market fluctuation if properly understood.
RSI usually oscillate between a crest and a deep, and this oscillation is what forms the price determiner and traders price taking.. Now by default it is set at 70 and 30. In that if it exceed 70 then it is said to have experience an over bought and oversold if it goes as low as the 30 graph point.
HOW IT IS CALCULATED.
RSI is calculated using the formula below.
RSI = 100 - 100 / (1+RS)
Where RSI is the Relative Strength Index.
And RS = is the average profit made over a high period of a certain period divided by the average loss incured over a high period over that same period..
So our main focus now is the RS(Relative strength) since the other values are numeric.
So looking at the RSI over a period of say 14days. Now all the crest point (70 and above) of that period, the average of the earnings made will be determined and then divided by the average losses made over that same crest point over that same period of say 14days..
When the RS is now determined, it is inputted back into the RSI formula as stated above and calculated..
QUESTION 2
CAN WE TRUST THE RSI ON CRYPTO CURRENCY TRADING AND WHY?
MY ANSWER.
Yes we can.
Though it has it flaws, as the false indication it might portray during some period Market price fluctuation (though it can be corrected) but it importance cannot be underestimated.
RSI has been in use over a long period of time and most trading platforms have put it in use... In order to ease trading.
Like the overbought and oversold periods this analytical characteristics of RSI cannot be joked with..
Also the bullish divergences and bearish divergences has alot to add to the importance of RSI, thereby increasing it trust.
Though every parameters in crypto trading has to be deligently studied so to get the best out of it.. RSI is one of them..
Therefore, you don't rush in or out on an opened trade because of a slight shift of signals, no, you closely observe it before concluding..
QUESTION 3
HOW DO YOU CONFIGURE THE RSI INDICATOR ON THE CHART AND WHAT DOES THE LENGTH PARAMETER MEAN? WHY IS IT EQUAL TO 14 BY DEFAULT? CAN WE CHANGE IT?
MY ANSWER
Steps before getting to the configuration page:
-first of all log unto
Then the page below will open
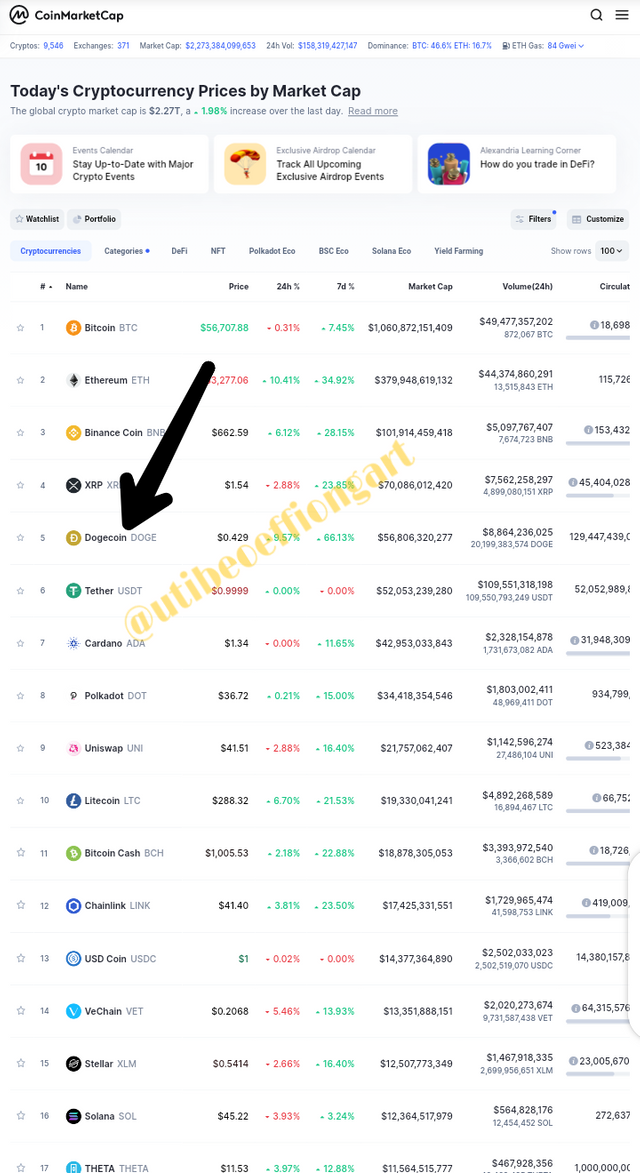
-Then choose the coin of your choice to obtain your pairing. Here I choosed dogecoin.
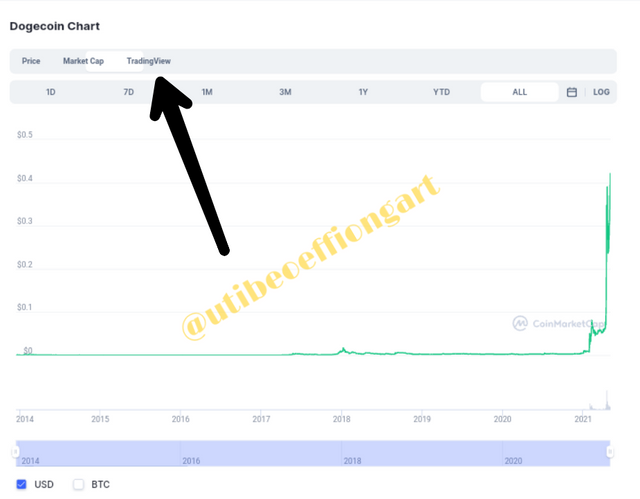
-This page opens and then you scroll down to where you have the Trade view, click and wait for it to load.
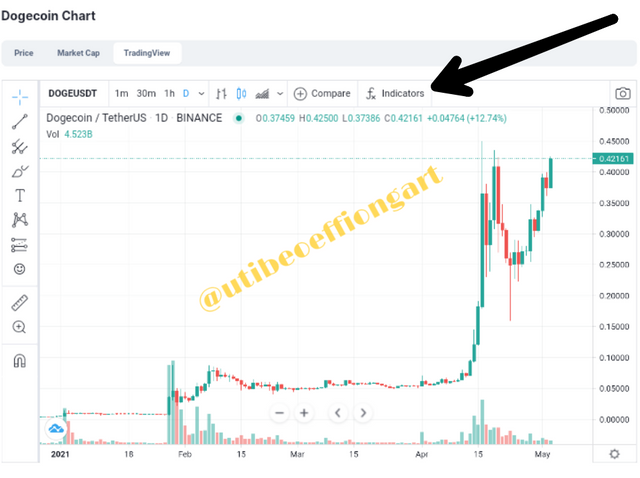
-Then click on fx on the trade view page. Then a call-out button opens as seen below..
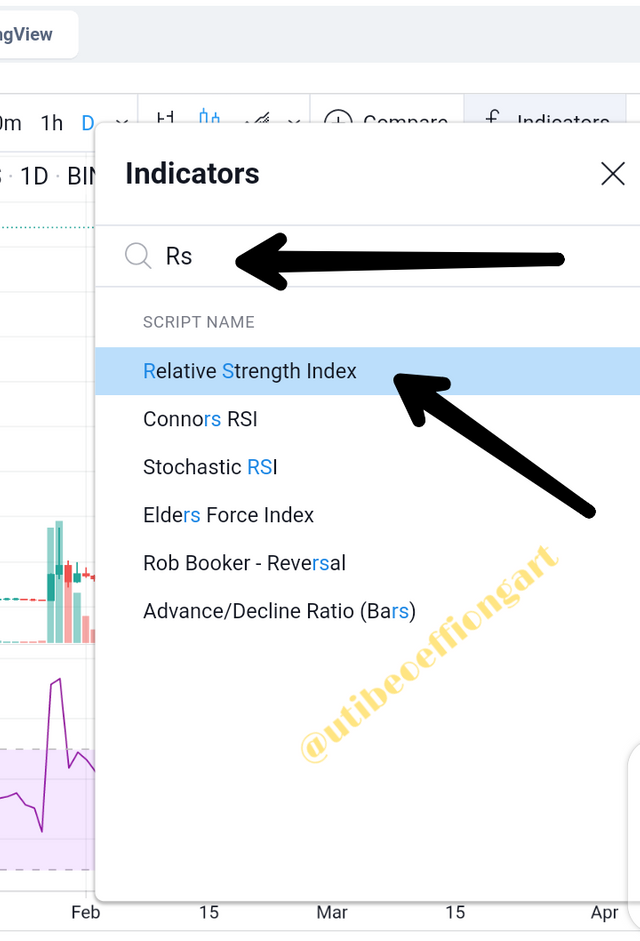
-when that opens you type in RSI and proceed to clicking the RELATIVE STRENGTH INDEX. After that the RSI page comes up. were you have the dogecoin trade chart and your RSI below.
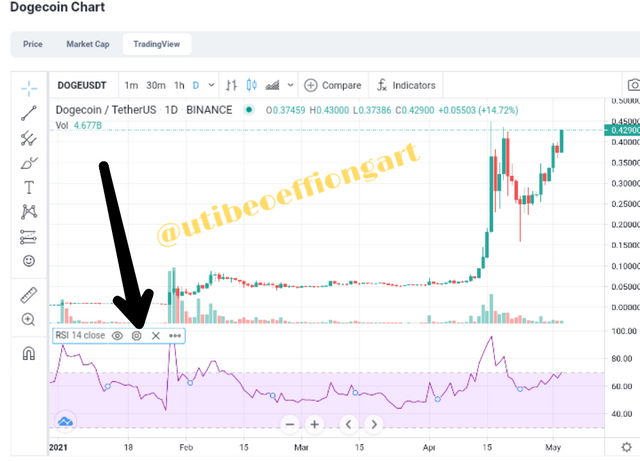
-So to configure, you click on the setting node which will be displayed on the screen as shown by the arrow above.
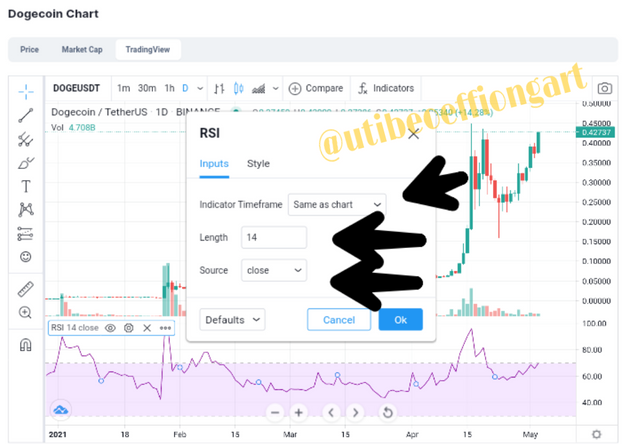
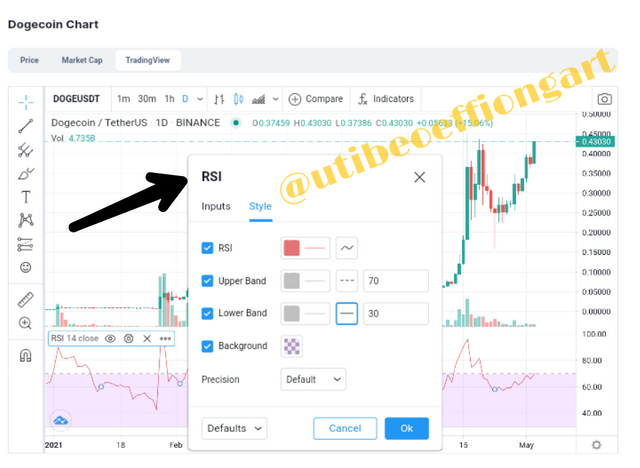
So from the two pictures above, you make your settings of the INPUT and STYLE depending on what you want. Though it is always set to a default but a trader can always decide to adjust it to his/her test based on your understanding and preference of RSI.
WHAT DOES THE LENGTH PARAMETER MEAN.
So the length parameter means the total number of oscillations the indicator analysis so to come up with the average value over a period of time, days or months.. It's always set at default to 14 as seen above. Which might be 14days or 14hours or 14months..
WHY IS IT EQUAL TO 14 BY DEFAULT CAN WE CHANGE IT.
It is equal to 14 by default because the programmers presumes this range as the range that will give a smoother flow. There is an RSI rule that says " a shorter period will always give you a volatile flow, that is to say the bars will hit on 0 to 100 at almost the same timing but an average period like 14 or higher period like 40 will give less volatile flow..
So therefore to avoid a very volatile flow or a very less volatile flow were the bars Centralizes at the middle point (35) alone.. an average period is always preferred. Which is the default setting 14.
CAN WE CHANGE IT?
Yes it can be changed based on what the trader wants, likes, or prefers.
QUESTION 4
HOW DO YOU INTERPRET THE OVERBOUGHT AND OVERSOLD SIGNALS WHEN TRADING CRYPTOCURRENCIES?
MY ANSWER
Now with the help of the RSI this is made easy. And it's one of the very important uses of the RSI.
OVERBOUGHT INTERPRETATION.
Now at the style section of the RSI setting there is the upper band and the lower band. Were the upper band is in a default setting of 70, though you can adjust it to what you want.
This is more like the crest point.
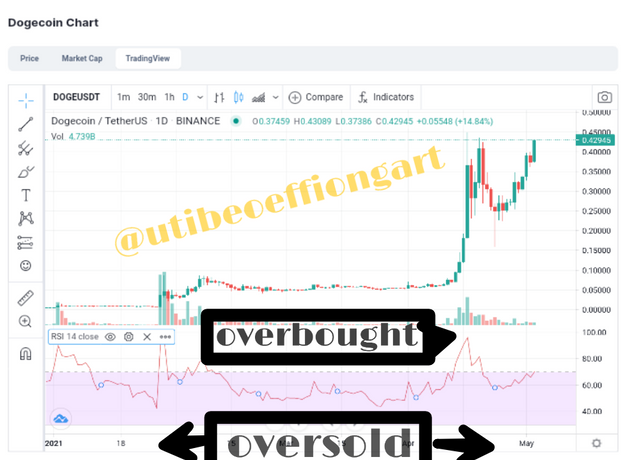
From the picture above the point were the bar peaks above the 70 graph point, it is said to hit the over bought point.
So at this point the demand of dogecoin is higher than the supply of it.. traders have over bought it so that the market starts experiencing scarcity therefore the price goes up. At that point dogecoin is experiencing an OVERBOUGHT situation.
OVERSOLD INTERPRETATION
Still at the style section of the RSI setting, lower band is taken into consideration, were it is set at a default of 30 though can be adjusted according to what is needed by the trader.
Still from the picture above though the dogecoin did not experience any Period of oversold since the bar did not deep below the 30 graph point over that period of time.
But I have carefully identified the period of oversold, were the dogecoin would have been in so much supply that it supply is far more than the demand, at this point the market price fluctuates downwards and this is always the best time to buy the coin. At this point we say the dogecoin is experiencing an OVERSOLD condition.
QUESTION 5
HOW DO WE FILTER RSI SIGNALS TO DISTINGUISH AND RECOGNIZE TRUE SIGNALS FROM FALSE SIGNALS.
MY ANSWER
Now the RSI signals if used as a single tool to determine market price fluctuations can give false signals at one point or the other. So it is pertinent to incur parameters on how to prevent ourselves from Falling for the false signals i.e it corrections.
By false signals we mean, the deceptive bullish or bearish uprise or down turn of an indicator, but does not appear same on the real chart. That's there is no synchronisation between the
RSI and the real chart.
So there are different methods of filtration of this signals so to avoid the false signal. Which I'll base on only two method: the STOP LOSS AND THE MACD.
STOP LOSS
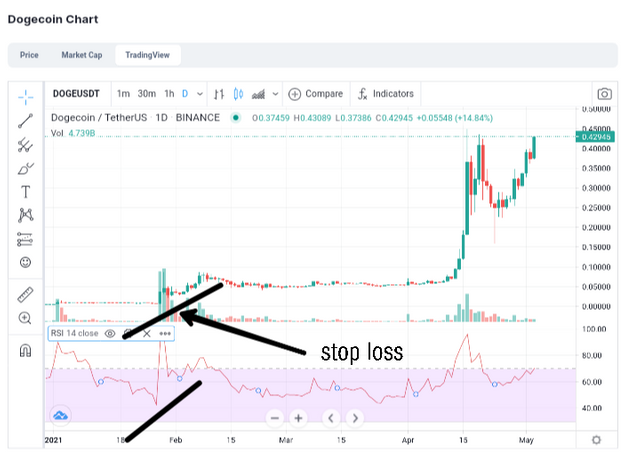
The stop loss indication is very important so to avoid false indication.. As you can see from the graph above the stop loss point indicated in the graph collocate at both sides of the graph and this is a true rise and that was our last low to the most recent high in the bar which is the best stop loss point.
MACD
This is one of the analytical too that can be combined with RSI to help correct false signal.
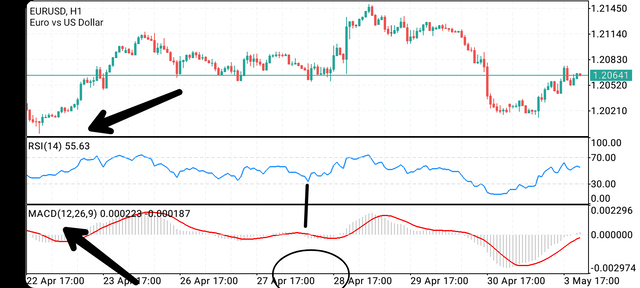
As seen above incorporating RSI with MACD will really help in correcting some of the false signal of RSI.
As seen above, when RSI sloped down, MACD still stayed up.. this should ring a bell that the price is not actually depreciating, because immediately it went up again.
Therefore MACD helped with the correction.
QUESTION 6
REVIEW THE CHART OF ANY PAIR (eg TRX / USD) AND PRESENT THE VARIOUS SIGNALS FROM THE RSI.
MY ANSWER
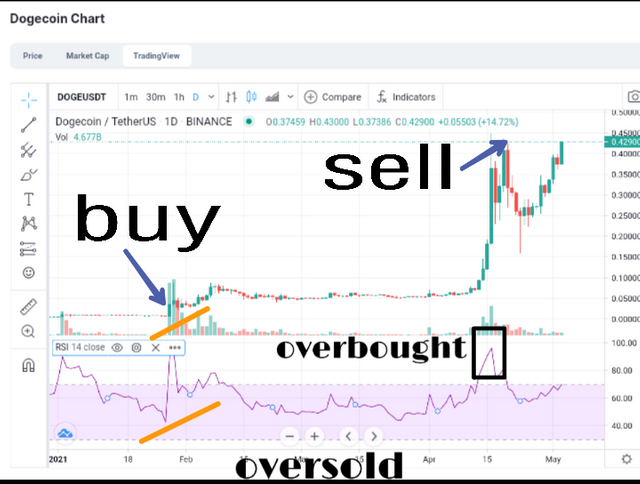
Considering this pair, DOGEUSDT I will analyse a crypto currency trade using the RSI.
From the beginning of January till February, the market price continued on a resistant constant level but our RSI had a lot of fluctuations which pushed for a false signal. But then this should stand as a sign to the trader that very soon there will be a bullish or bearish divergence. So to be on the alert.
And very soon there was an RSI divergence which corresponded with the market price chart. At that point it is good to wait a little before buying(setting ur stop loss indicator). Looking at the constant upward movement of the price, then the stop loss was right, at that point of market fall you can buy your dogecoin.
While still leaving your trade open and still watching the market out play. Now the RSI breaks out of the OVERSOLD region and suddenly gets to the overbought but that does not apply same to the market price, so you leave the trade still open and don't be tempted to close because that would be a false indication.
Now from Feb. Up till April 15, the market experiences a constant flow.. but our RSI fluctuates upwards and downwards, again a trader needs to be careful not to close.
Now like I said before the constant divergence in the RSI should ring a bell that very soon there will be a significant outplay of either a bullish or bearish run. And true to the course at April 15 the market peaks significantly upwards and that collocate with the RSI which moves beyond the 70 graph point at this point it is advisable to close and sell which I have indicated above.
CONCLUSION
In as much as RSI has much importance on trading it is adviceable not to use it in isolation. A combination with other analytical tool will really help to avoid errors during trading, so to avoid closing and opening on a trade which does not really makes sense.
Thank you.
Hi @utibeoeffiongart
Thanks for your participation in the Steemit Crypto Academy
Feedback
This is good work. Well done with your research study on the RSI indicator.
Homework task
7
Downvoting a post can decrease pending rewards and make it less visible. Common reasons:
Submit
This post has been rewarded by @bright-obias from @steemcurator04 Account with support from the Steem Community Curation Project."
Keep posting good content and follow @steemitblog for more updates. Thank you, Steemit Team!
Downvoting a post can decrease pending rewards and make it less visible. Common reasons:
Submit
Thanks alot for the support 🙌🙌🙌🙌
Downvoting a post can decrease pending rewards and make it less visible. Common reasons:
Submit