
Now to the assignment proper.

Show your understanding of the SuperTrend as a trading indicator and how it is calculated?
SuperTrend as a Trading Indicator
A trailing market price on it own can be utilized for a trading expedition but then that is to a greater risk of loosing and also missing out on very important trades that is why it is important to get support and this support is in the use of an analytical tool and this too is summed up under the fundamental and technical analytical methods. In respect to this assignment we base on the technical analytical method to carry out a trade. It is this technical analytical tools that keeps the trader ahead of any failing to be encountered during a trading expedition.
This trading analytical tool is an indicator and in this case the supertrend indicator is our case study. The supertrend indicator was designed by Olivier Seban and it is a trend following indicator helping traders identify trend. This trend following is a possibility by the settings of two parameters within the indicator which are the period of ATR(Average True Range) and the multiplyer set at a default of 10 and 3 respectively. Now this parameters in the supertrend helps determine the it value and then also identifies the volatility rate of the market price.
It is good to note that the supertrend indicator works like the moving average but it distinct characteristics. The supertrend indicator has two progressive lines which changes based on the current trend invoked. So when the market price is in an uptrend the indicator has a green coloration and the it is in a downtrend then the indicator line changes to red.
Also very importantly the principle of resistance and support applies here were the the indicator serves as a resistance when the chart is in a downtrend and serves likewise as a support when the market prices is in an uptrend.
How to Calculated the SuperTrend Indicator
Now to calculate the Supertrend then we have to do that in two different ways that is for the upper line and also for the lower lines since both significantly help trail the trend. So the formulas below are used;
Supertrend Upper line = (HIGH + LOW) / 2 + Multiplier × ATR
Supertrend Down Line = (HIGH + LOW) / 2 – Multiplier × ATR
Where;
High = is the highest price value of the used candle.
Low = is the lowest price value of the used candle.
Multiplier = is the multiple of the indicator period.
ATR = Average True Range
It is important to note that for the up line calculation then the red colored line is used and for the down line then the green colored line is used.
For the Upper Line Calculation
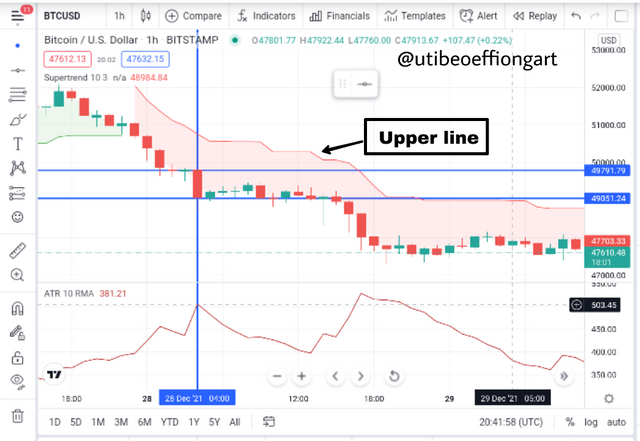
Screenshot from tradingview showing supertrend upper line
Now to proceed to solve this it is important for us to understand that the supertrend indicator is configured to a period of 10 so the ATR which is a very vital calculating or determining factor of the supertrend has to align with the period of the of the supertrend. So if you notice I have set the period of the supertrend and that of the ATR to 10 for a correspondence in market price and indicator value.
So looking at the BTCUSD chart above the following derivatives were obtain for the calculation of the upper line of the supertrend indicator.
Formula is;
Supertrend Upper line = (HIGH + LOW) / 2 + Multiplier × ATR
Where;
HIGH = $49791.79
LOW = $49051.24
Multiplier = 3
ATR = 503.45
Upper line = (49791.79 + 49051.24) / 2 + 3 × 503.45
Note: The principle of BODMAS must be adopted here for perfect or correct calculation.
Upper line = 98,843.03 / 2 + 3 × 503.45
Upper line = 49,421.515 + 1,510.35
Upper line = 50,931.86.
For the Down Line Calculation
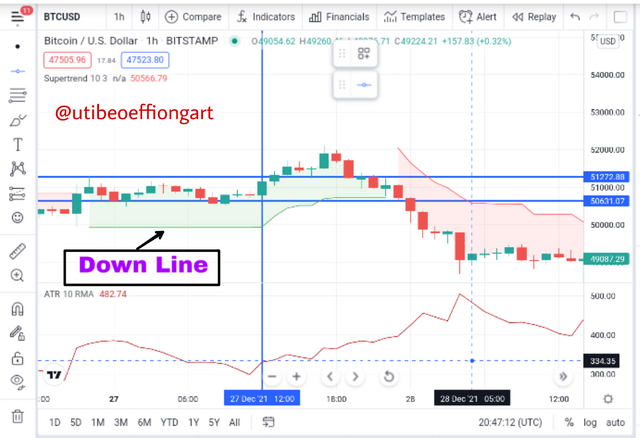
Screenshot from tradingview showing supertrend down line
Also to calculate this we also carry out the same period setting as we had done for the upper line making both period 10. We will also spell out the variables for the calculation with the formula below.
Supertrend Down Line = (HIGH + LOW) / 2 – Multiplier × ATR
Where;
HIGH = 51272.88
LOW = 50631.07
Multiplier = 3
ATR = 334.35
Down line = (51272.88 + 50631.07) / 2 - 3 × 334.35
Now we also involve the BODMAS principle here for a correct calculation.
Downline = 101,903.95 / 2 - 3 × 334.35
Downline = 50,951.975 - 3 × 334.35
Downline = 50,951.975 - 1,003.05
Downline = 49,948.93
The values obtained are confirmed on the chart as a value available on the supertrend indicator.
What are the main parameters of the Supertrend indicator and How to configure them and is it advisable to change its default settings? (Screenshot required)
Main Parameters of the Supertrend
There are two basic parameters that are poised to make the supertrend indicator effective. This two parameters are the ATR(Average True Range) and the multiplier. I'll discuss a bit about it as I proceed.
Average True Range (ATR)
The average true range is inclined in the supertrend indicator to help calculate the volatility rate of the supertrend indicator. Now to figure out the average true range it is important to calculate the true range first of all before the average of the maximum value derived from the difference individual periods of the true range are obtained.
Formula for calculating the average true range goes thus;
Current ATR = [(Previous ATR x 13) + Current TR] / 14.
As said above, to obtain the ATR value the true range must first be obtained, so let's proceed to seeing how the true range is calculated.
True Range - like I said before the true range is a derivative of the average true range, it aids in the calculation of the Average True Range it self. So the formulas below are used for this calculation;
TR = Current high less the current low(CH - CL)
TR = Current high less the previous close(CH - PC)
TR = Current low less the previous close(CL - PC)
After obtaining the value of the formulas above, the maximum value is used and we can then proceed to obtaining the ATR over the value of the period chosen by trader. So assuming we are to use a 14days period length. Therefore we will have to calculate using the above formula over the number of periods chosen and then the average of the maximum value of the true range is obtained giving rise to Average True Range.
Multiplier
The multiplier is a multiple of the ATR that determines the effect of the lines of supertrend indicator on market price. Now ty multiplier is used in two ways for the upper and lower lines of the supertrend indicator. Now for the upper line which is identified by a red color, the multiplier which is at a default of 3 is multiplied with the ATR and then added to the mean of the sum of the High and the Low of the candle and also for the down line of the supertrend indicator it is multiplied with ATR and subtracted also from the mean of the sum of the addition of the High and the Low of the candle in use.
Configuration of the Parameters
Now configuring the two parameters of the supertrend is dependent on the trader and the trading style of the trader. Longer period of the ATR and the Multiplier will aid a swing trader more because of more smoother and long indicator line suitable for the style and vis versa for the shorter periods. Let's explain further below.
For Swing Trading
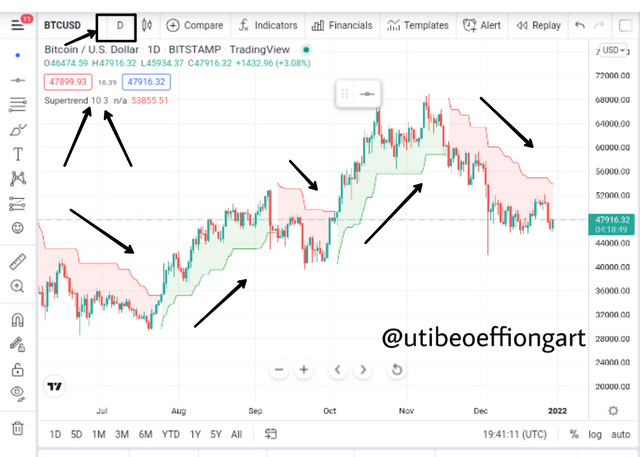
Screenshot from tradingview showing period and ratio configuration
Now looking at the BTCUSD chart above the time frame is set on a day interval and this is associated with a swing trader who is a longer timeframe trader. With that I also used a bit of a longer period here which is 10 and 3 for the ATR and the Multiplier respectively. And as you can see the chart is less busy and slow at response which is also comfortable for a swing trader.
For Scalp Trading
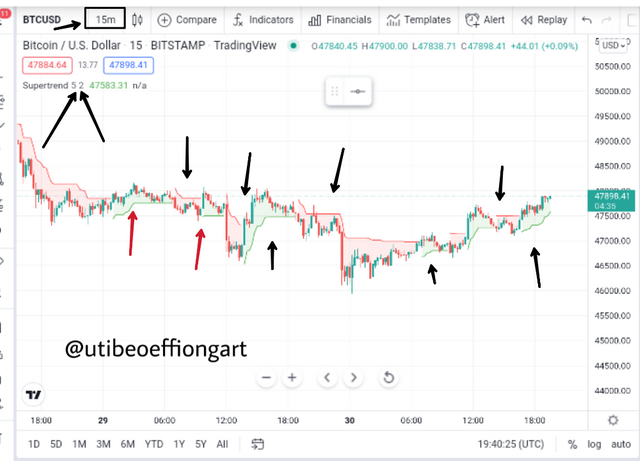
Screenshot from tradingview showing period and ratio configuration
Now looking at the BTCUSD chart above, you can observe the change in the time frame of the chart. Now Changing the time frame to something smaller then the configuration of the period and the ratio has to also change to something smaller so as to enable traders to take profit at intervals since it is an intra-day trading.
Is it advisable to change its default settings?
Like the configuration illustration I have shown above, it is solely based on individual trading needs and understanding. So a trader who is a swing trader has to configure the chart to something suitable for a longer trading pattern as seen above and also for a scalp trader he/she needs to do that so as to take an interval profit.
Though on a general note it is not always advisable for traders to adjust the settings of an indicator since the creator of the indicator has his specifications during the creation. But then based on the understanding of the trader he/she can always manipulate the indicator setting to his/her advantage.
Therefore the configuration of the chart is based on the individual traders strategy and understanding.
Based on the use of the SuperTend indicator, how can one predict whether the trend will be bullish or bearish (screenshot required)
Trend Prediction
The beauty of any indicator is that there is an ability of traders to predict the trend of an asset before it actually makes the actual moves really. So below we will see how to predict uptrend and the downtrend using the supertrend indicator.
Bull Trend Prediction Using the SuperTrend Indicator
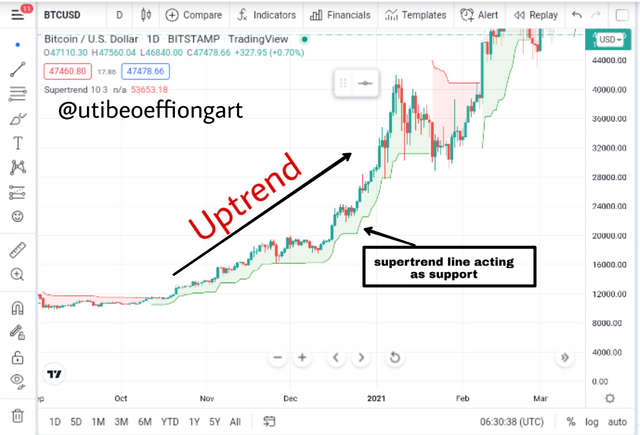
Screenshot from tradingview
Now the supertrend has a very major function of identifying trends and this is done in two ways of either identifying an Uptrend or Downtrend and above is a chart showing an uptrend movement along with the supertrend indicator. Now the supertrend is a great aider in that it during an upright like this the indicator line turns to be a support to the market price as seen above. Now for the trader to identify that the trend is going to be an uptrend, the supertrend line jumps from the upper part of the market price telling us that there is a reversal then proceeds to the lower part giving an uptrend progression.
It is worthy of note to know that the bull is identified by the the green color of the supertrend indicator as one of the identification Mechanism using the indicator.
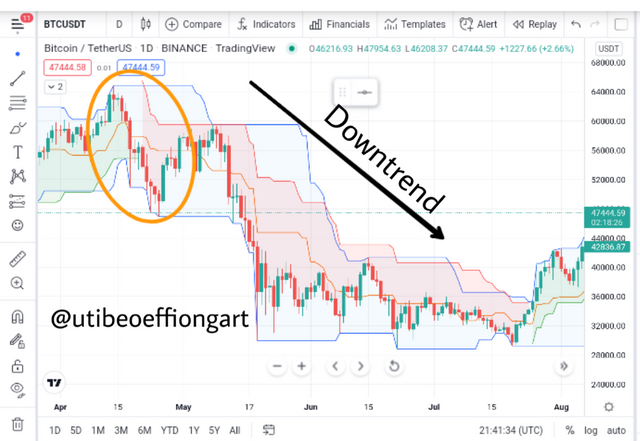
Bear Trend Prediction Using the SuperTrend Indicator
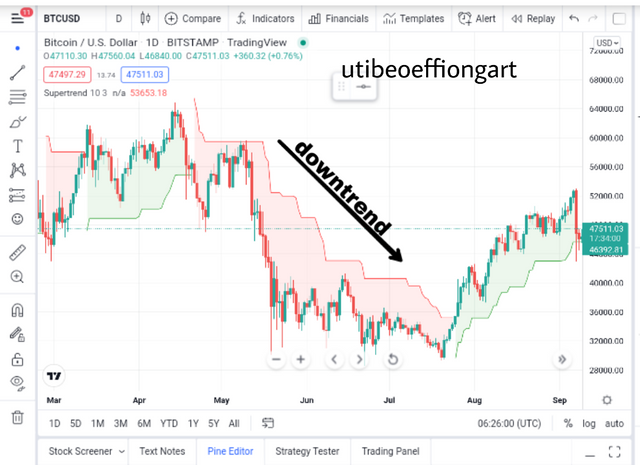
Screenshot from tradingview
The downtrend identification is not far from the bullish trend identification as afore explained. After a trend there must be a reverse movement of trend either the opposite or to a ranging market but for a certainty the market cannot be in a particular trend for ever. So as seen above, to identify the downtrend using the supertrend indicator, the indicator line jumps from the lower level were it was serving as a support and moves to the upper level serving as a resistance. When it jumps to the upper level it start trending downwards with the line changing to red from the green color it had before.
Explain how the Supertrend indicator is also used to understand sell / buy signals, by analyzing its different movements.(screenshot required)
Buy and Sell Signal.
One of the vitals of an indiacator is to helps traders identify this buy and sell signals. A good knowledge of this buy and sell will actually help traders know the entry and exit of a trade.
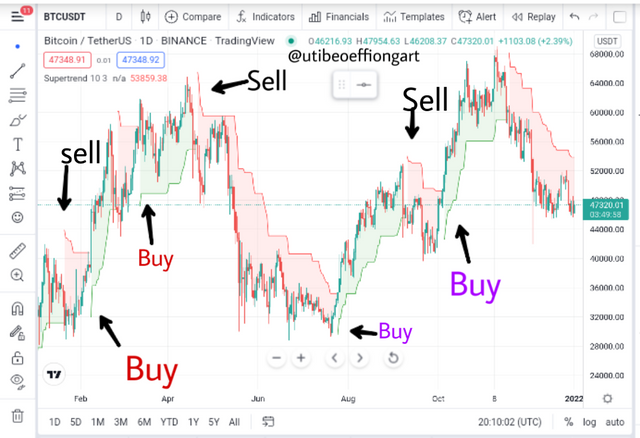
Screenshot from tradingview
Now at the chart above it is important to take notice that at the beginning of every indicator is a particular signal. So if the indicator line starts with a red coloration then the chart will be capturing a sell signal and then when the indicator line is green then that immediately turns to a buy signal.
It is worthy of note that the crossing over of this indicator line is what helps in it identification.
How can we determine breakout points using Supertrend and Donchian Channel indicators? Explain this based on a clear examples. (Screenshot required))
Breakout Point determination using supertrend and the Donchain indicator
Now the Donchain indicator works with some beautiful strategy having three lines that serve as a channel were the price chart does not go outside the confinement of that people. But then using them in consonant is more of a reassurance to trader before entering a trade in that it confirms a trend.
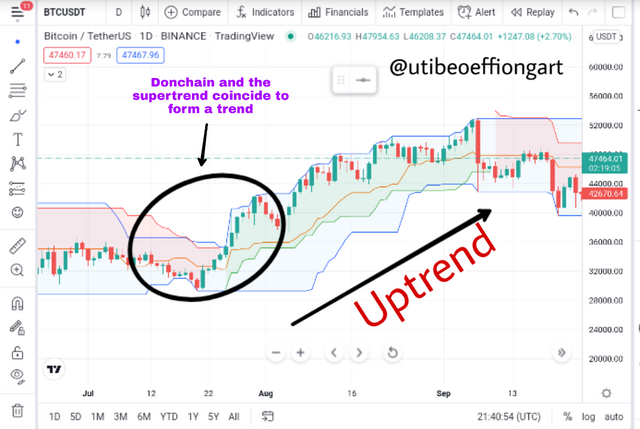
Screenshot from tradingview
Now looking at the BTCUSDT chart above, there is a point were the trend always begin from and a trader needs to catch it as far as possible. So in this is an Uptrend were the two indicators collocate in actions. But then looking at the beginning of the trend there was a break out from the normal at the time and at that point the market price begin to show a consistent formation of the green candles and this was first sign.
And when the market price began to move to the upper part of the Donchain indicator this further signified an Uptrend and then with the formation of the green line or the supertrend indicator then the breakout is a sure confirmation.
Screenshot from tradingview
The explanation goes same for the downtrend breakout confirmation though the difference that can be noticed with this one is that the market price begin to form red coloration and then when the candles are making progress it proceeds to the lower part of the channel further confirming the downtrend breakout. And then on the part of the supertrend indicator, it gives a resistance red coloration for this.
Do you see the effectiveness of combining two SuperTrend indicators (fast and slow) in crypto trading? Explain this based on a clear example. (Screenshot required))
Two supertrend indicator combination
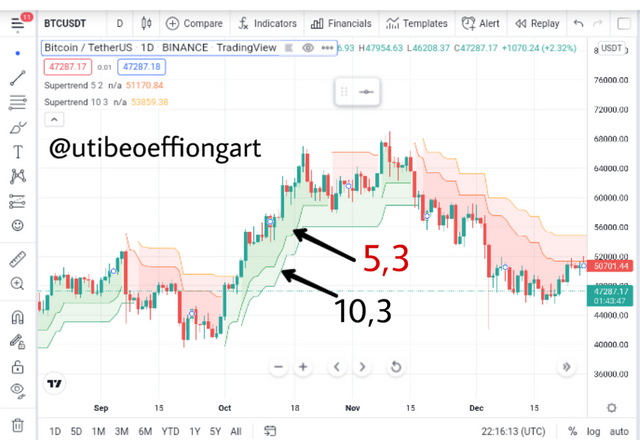
Screenshot from tradingview
For me I don't really fancy the combination of the same Indicator even if they is a change in the periods and Multiplier involved but then another different indicator could be used for more appreciative trading experience.
But then there are still some notable and useable facts that can be of help to the trader. In that the longer periods representing the slow response period tend to be far from the market price and also it starts late after the market has long taken it course and this could be of great disadvantage to the trader.
Also to the shorter periods representing the fast moving indicator line has a quick response level for trading and if you should notice that indicator starts from when the market price has started it movement and this is of great advantage because of response of it level.
Is there a need to pair another indicator to make this indicator work better as a filter and help get rid of false signals? Use a graphic to support your answer. (screenshot required)
Filtering False Signal
Now for every indicator there is always every need for a combination with other indicators for a confirmation for either a false or late signal filtering so to avoid some loses during a trading expedition. This is so because there is no indicator that is 100 percent, therefore there is need for a supporting indicator. So in this case I'll be using the RSI indicator as the supporting or filtering indicator for the false signal.
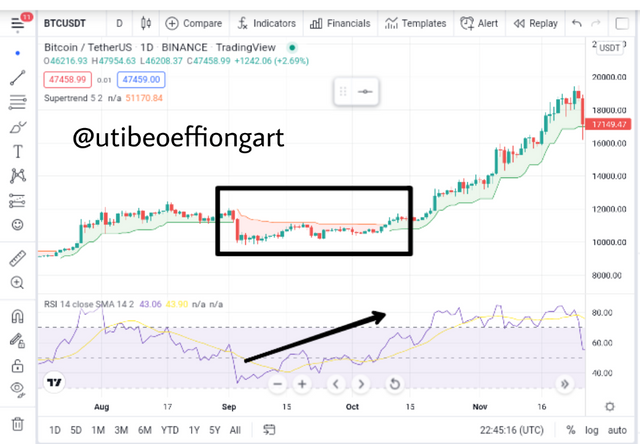
Screenshot from tradingview
The RSI indicator having two sections, which are the upper and lower section which signify bull and bear. When the indicator line falls below 40 then it entells a bear run and when it is above 60 then it is a bull run. For the chart above the market price showed candles that tend to be in a range and also looking to be proceeding upwards, but then the supertrend indicator showed a red coloration which entells a bear run. But then this false signal is corrected by the RSI indicator which correctly shows that it is a progressive bull trend.
List the advantages and disadvantages of the Supertrend indicator
Advantages of the Supertrend Indicator
Trend following and identification is very much possible using the supertrend indicator.
It is very easy to understand for amateur traders starting to use the indicators fur the first time.
It is compatible with any time frame and possiblity of adjustment of the Indicator's period to suit any time frame is invoked.
It is compatible to be used with other Indicators to filter false and late signals.
Disadvantages of the supertrend indicator
When it comes to ranging or sideways movement market the supertrend is not very useful, vis a vis the need for a supporting indicator.
It gives false and late signals during trading vi a vis the need for a supporting indicator.
Conclusion
In conclusion, the supertrend indicator is another very special indicator that can improve the trading expedition of a trader towards making profit. One of the ways this is possible is the fact that trends can be followed tracked and used for entering and exiting trades.
The supertrend indicator does not work in isolation but uses the combining power of the ATR and the Multiplier to function in order to measure volatility rates of the market price.
Thank you.
Downvoting a post can decrease pending rewards and make it less visible. Common reasons:
Submit