
Now to the lectures proper.

What is Aroon Indicator in your own words? What are Aroon-Up and Aroon-Down? (Show them on Chart).
Aroon Indicator
Very important to a trader are Indicators during a trading expedition, but more importantly is the knowledge of the usage of the Indicator. Indicators are vital part of trade because it ability to filter out false signal, identify trends, show price momentum and strength etc, to this end we will be discussing the Aroon Indicator.
Now the Aroon Indicator has a major work of identifying trends and the trend strength. This Indicator was Created in 1995 by Tushar Chande. Now he decided to call the Indicator Aroon because of the meaning that the word Aroon which is Dawn's light. This entells the start of something, therefore he applied that to the Indicator were the Aroon Indicator shows or points to the trade the start of a trend.
The Aroon Indicator has two lines each having it's own function functions of trend identification. This two lines are called Aroon up and Aroon down. The Aroon up showing the momentum of the Uptrend and the Aroon down identifying the momentum of the downtrend. As we proceed we will see the application on chart.
Aroon Up
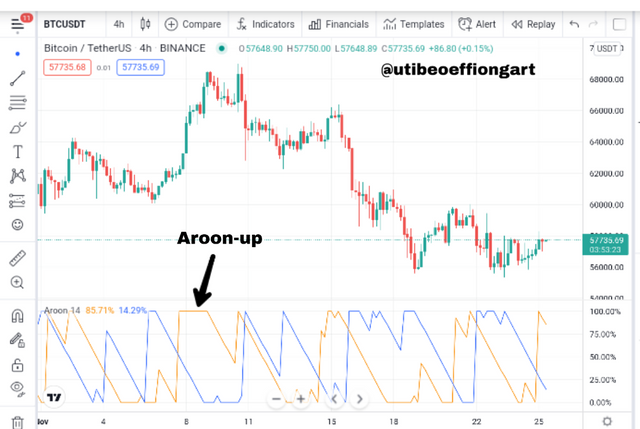
Screenshot from trading view
Aroon up which is indicated by the yellow line shown in the graph above. Is a line of the indicator that indicates uptrend. Usually when it moves above the Aroon down indicated by the blue Indicator line. It runs on a scale of 0 to 100 strength scale. So ideally, the higher or lower the scale number at the time the trend that will be reflected on the price asset chat.
Aroon Down
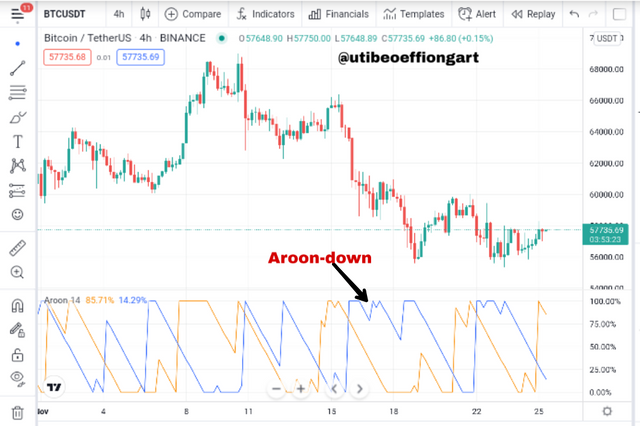
Screenshot from trading view
Aroon down which is identified by the blue Indicator line shows the asset downtrend of a chart. Usually when the Aroon down line moves on top of the Aroon down line. The Aroon down line moves still on a scale of 0 to 100 showing the strength of the asset trend.

How is Aroon-Up/Aroon-Down calculated? (Give an illustrative example).
Aroon Calculation
To calculate the Aroon-up and Aroon down then the follow below is applicable;
Aroon-Up = [(nPeriod – Periods of the most recent High within nPeriod ) / nPeriod] x 100
Aroon-Down = [(nPeriod – Periods of the most recent Low for nPeriod ) / nPeriod] x 100
Where nPeriod = Is the period chosen by the trader or the default Indicator period. So let us set our Aroon to the Indicator's default of 25 periods.
Therefore nPeriod = 25 periods. And let's take the 14 as the most recent High within the 25 period. So let's input this into the formula for Aroon up.
Aroon-Up = [(25– 14) / 25] x 100
Aroon-up = 11/25 × 100
Aroon-up = 0.44 × 100
Aroon-up = 44
Like wise let's use the same for our Aroon down calculation. Were our nPeriod will still be 25 and the most recent Low within the 25 period will be 7. Therefore applying that.
Aroon-down = [(25-7)/25] × 100
Aroon-down = [(18/25] × 100
Aroon-down = 0.72 × 100
Aroon-down = 72
From the above calculation the Aroon-down's value is higher than the Aroon-up value and this entells that the asset market price is in a Bearish run looking at the fact that the Aroon down in the last 25 period has a trend strength higher than that of the Aroon-up.

Show the Steps involved in the Setting Up Aroon indicator on the chart and show different settings. (Screenshots required).
Setting Up the Aroon Indicator
To set the Aroon Indicator we visit the https://www.tradingview.com/ platform and choose the asset pair of our choice. Here I choosed the BTCUSDT.
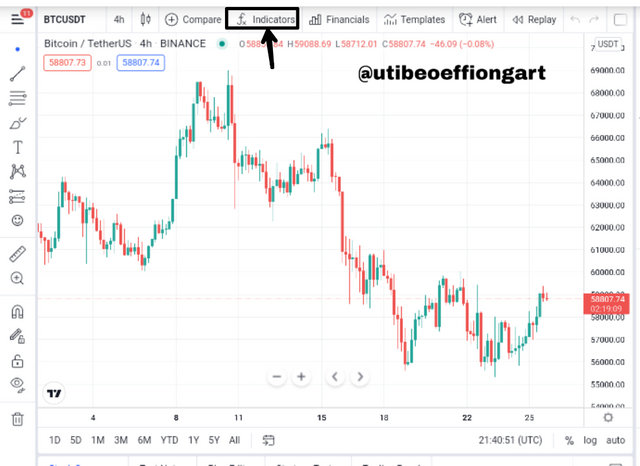
Screenshot from trading view
After choosing the asset pair I then proceed to choose the fx Indicator on the top of trading view platform and then a call out page will come up as seen below.
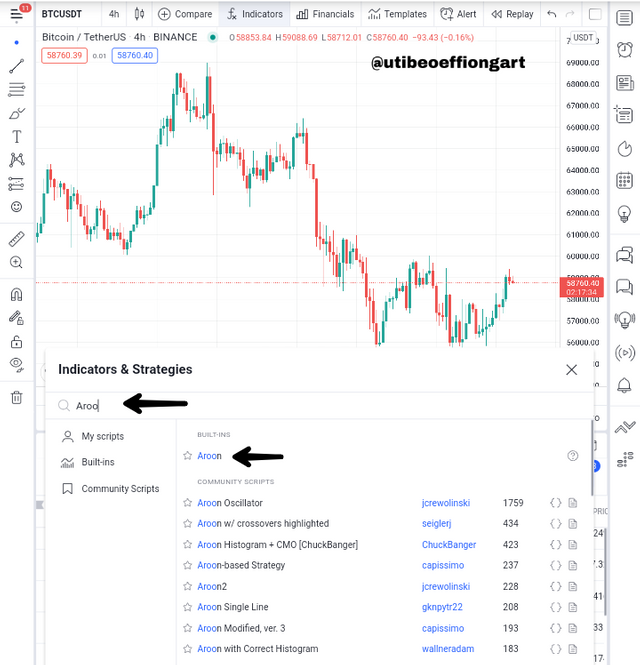
Screenshot from trading view
I then proceeded to search for the Aroon Indicator on the search portal and further choosed the Indicator. And immediately the Indicator is applied to the chart.
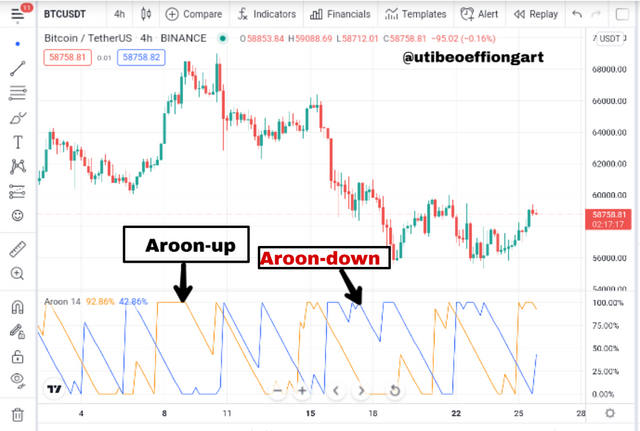
Screenshot from trading view
Looking at the chart I have showed the two Aroon lines which are the Aroon up line and the Aroon down lines by the yellow and blue colours respectively.
But then we can set this Indicator to our desired Input and Style.
Input
Now for the Input, we first choose the setting on the Indicator line which will then bring up the Indicator setting panel. As seen below
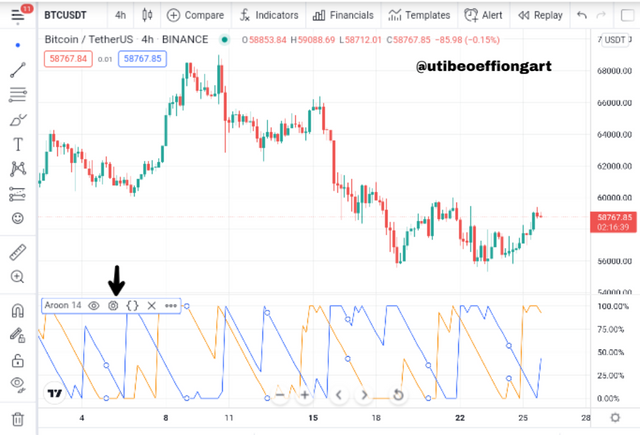
Screenshot from trading view
After choosing the setting button, then the setting portal opens up and then the first button at the top is the input as seen below. Under the input we see the length or period of the Indicator which can be adjusted to whatever the trader wishes to use.
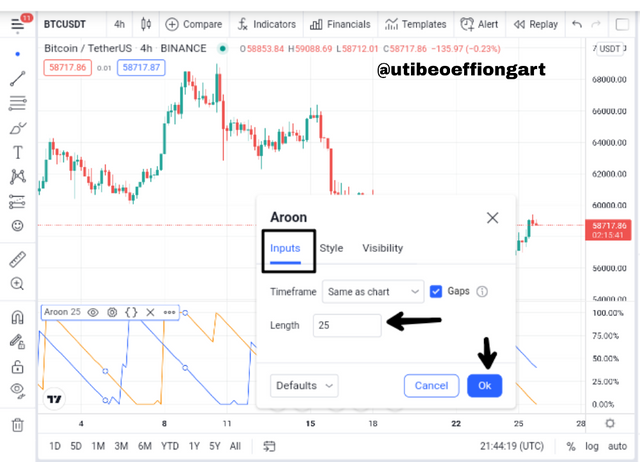
Screenshot from trading view
Style
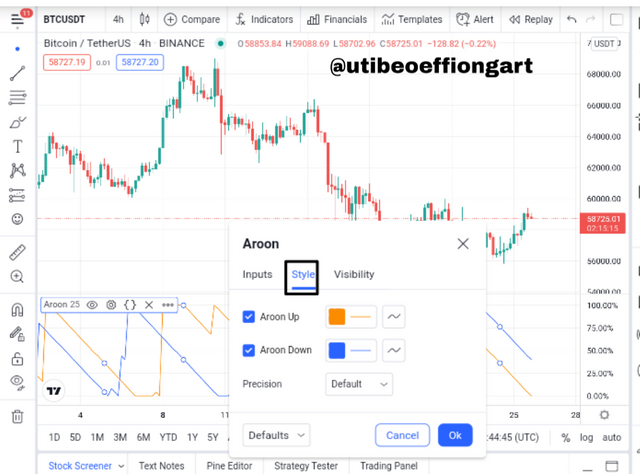
Screenshot from trading view
Now the style basically has to do with the color of the Indicator. This too can be manipulated by the trader to what ever he or she wants or she will be comfortable. Here I choosed the blue for the Aroon down and yellow in Aroon down. And the chart below shows application of the Indicator setting.
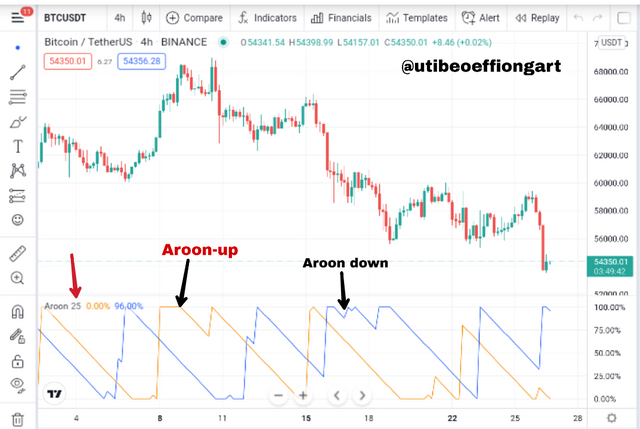
Screenshot from trading view
Visibility
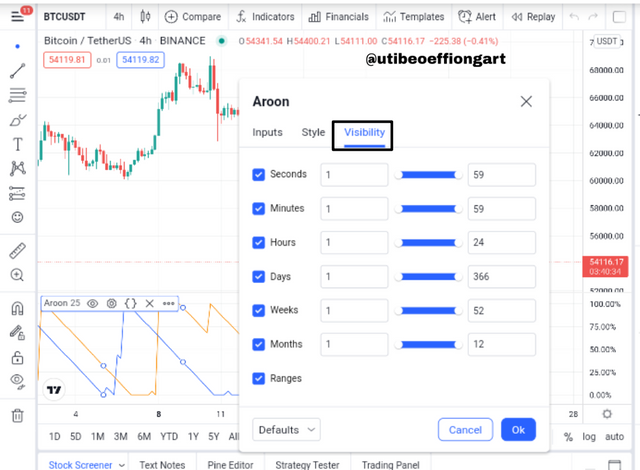
Screenshot from trading view
The visibility on the setting portal is used to set the Indicator so the Indicator has a reduced distraction or noisy. That is based on what the trader wants, this visibility setting helps beauty the Indicator display phase.

What is your understanding of the Aroon Oscillator? How does it work? (Show it on the chart, kindly skip the steps involved in adding it).
Aroon Oscillator
The Aroon Oscillator has alot of bearing with the Aroon Indicator, with some Differences. Like the Aroon Indicator it was also created by Tushar Chande in the year 1995. It has the work of identifying the start of a trend and the trend strength of an asset.
How it works
The major difference the Aroon Oscillator has from the Aroon Indicator is the chart reading range and the Indicator lines, while the Aroon Indicator has double reading lines to show Aroon up and Aroon down, the Aroon Oscillator has just a single line. Also the Aroon Indicator reads the Indicator line from 0 to 100, the Aroon Oscillator reads from -100 to 100 with 0 as the center of the reading.
Therefore with this range when the Aroon Oscillator moves below 0 to the negative range point it shows a Bearish trend, and when the oscillator line moves above the 0 point to the positive wing it shows a Bullish trend on the chart. Below is a chart to show this.
Bullish trend with the Aroon Oscillator
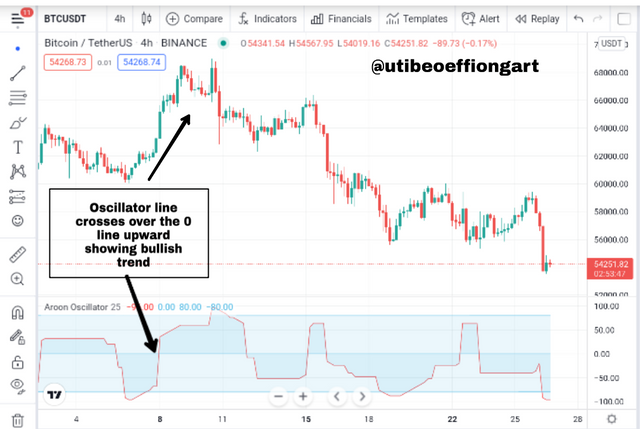
Screenshot from trading view
Looking at the BTCUSDT chart above I have pointed out a point were the oscillator line crosses the O line level upwards and this shows a Bullish trend as pointed out on the chart.
Bearish trend with the Aroon Oscillator.
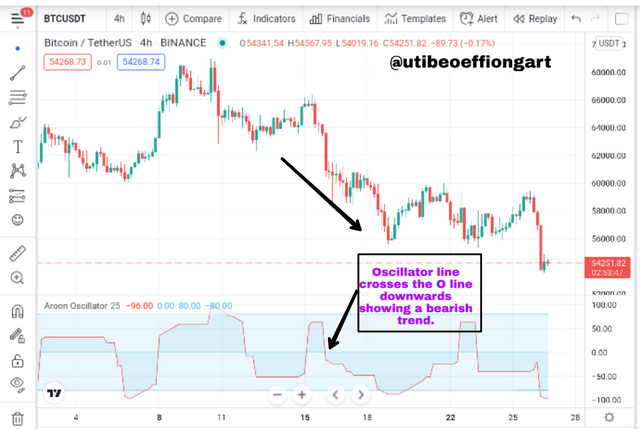
Screenshot from trading view
Now here the chart above shows a point were the oscillator line crosses the 0 line downwards, to the negative range level, showing a bearish trend which is reflected on the asset Chart as seen above.
How to calculate the Aroon Oscillator.
Here to Calculate the Aroon Oscillator, the formula used is just to subtract the Aroon-up value from the Aroon down value.
Now using the values we calculated on the Question 2 were we worked with 25 period Indicator setting.
We had;
Aroon-up being 44 and
Aroon-down being 72
Now applying that to the Aroon oscillator.
Were Aroon Oscillator = Aroon-up - Aroon-down
= 44 - 72
= -28
The value is a negative one after the Calculation and this shows a Bearish trend pull. Were the line will be crossing the 0 line level downwards to the negative range level.

Consider an Aroon Indicator with a single oscillating line, what does the measurement of the trend at +50 and -50 signify?
Aroon Indicator line measurements
Now considering an indicator with a single oscillating line as stated on the question. As I had earlier explained using the Aroon Oscillator. Were it has a -100 to 100 reading value range with 0 as the central demacating point.
Now considering the question, were a trend is measured at a +50 and -50 Indicator value level. Here at the +50 level this shows that the Indicator line will cross the 0 level and proceed upwards and when this happens with all things being equal without any false signal then the market price will be signifying a Bullish trend.
Now also considering the -50 level. Here the Indicator line crosses the 0 central Indicator level and proceeds downwards this will on the asset chart show a downwards movement entelling a Downtrend.

Explain Aroon Indicator movement in Range Markets. (Screenshot required).
Aroon Indicator movement in Range market
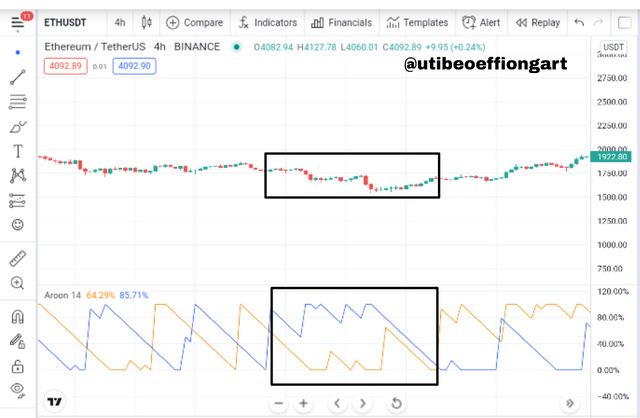
Screenshot from trading view
The range market is a market were the asset chart move in a sideways direction continuesly without a significant upwards or downwards movement to produce or result in trend.
Now looking at the ETHUSDT chat above, we see a range market. But then the Aroon Indicator has a way of helping traders identify such, and this occurs when the Aroon-up and the Aroon-down keep making zigzag movement but non of them crosses themselves unlike when Aroon-up or Aroon down make thier mark. As seen above, the chart asset is on a continuous straight movement as reflected on the Indicator Aroon up and down not being able to cross each other.

Does Aroon Indicator give False and Late signals? Explain. Show false and late signals of the Aroon Indicator on the chart. Combine an indicator (other than RSI) with the Aroon indicator to filter late and false signals. (Screenshots required).
Does Aroon Indicator give False Signal.
Yes!! Aroon Indicator gives false signals. Aroon Indicator like every other Indicators are not 100 percent, so at some point during a trade a trader should watch out for this. False Signal occurs when a the Indicator is showing an opposite of what is shown on the asset chart.
So assuming the asset chart is showing an Uptrend and then the Indicator is then showing a Downtrend. This is termed false signal because the work of an Indicator was to help traders confirm or point out trends. Let's see it on this BTCUSDT chart as shown below.
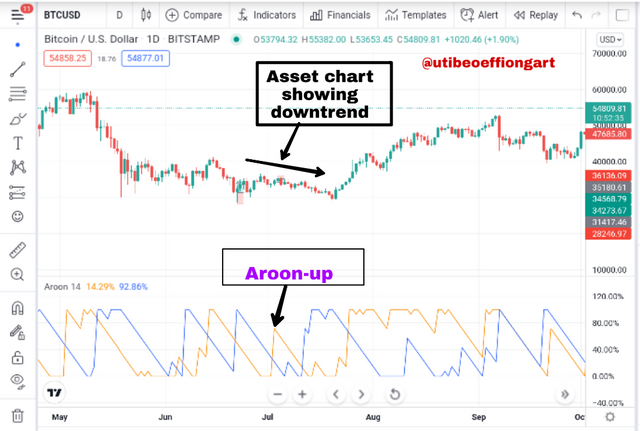
Screenshot from trading view
So looking at the BTCUSDT chart above the asset chart candles are moving downwards but then the Aroon Indicator shows Aroon-up which tells an Uptrend and this automatically is a false signal.
Does Aroon Indicator give late Signal.
Yes the Aroon Indicator gives late signal as all other Indicators does too and this is why a trader is adviced importantly to use more than an indicator for false and late signal filtering which we will see as we proceed.
Late signal occurs on an indicator when the asset chart candle have already proceeded on a trend either upward or downwards trend but then the Indicator line has not proceeded on that same trend this shows a late Signal because the Indicator will then have to show the trend move later which might delay a trade from taking an important trading entry. The chart below shows it.
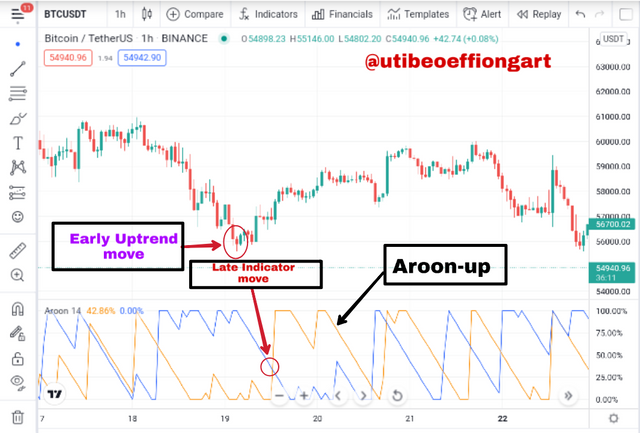
Screenshot from trading view
So the chart above shows that the BTCUSDT chart candles has proceeded on an Uptrend and the Indicator is still lagging just to start it's Uptrend movement after sometime revealing late signal.
Filtering out False Signal
Like I made mention before, traders are usually adviced to use more than one Indicator during a trading expedition so false signal could be filtered out. Like in this case I'll be combining the MacD Indicator with the Aroon Indicator to filter out false signal as seen below.
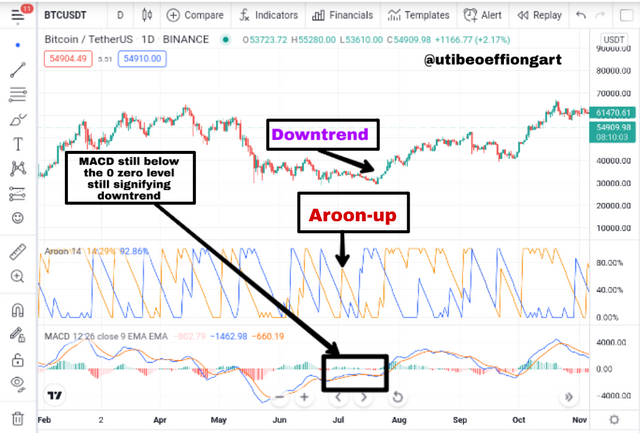
Screenshot from trading view
Looking at the BTCUSDT chart above it is combined with the Aroon and MACD indicators, with the MacD Indicator helping to filter out the false Signal. As seen above the Aroon Indicator shows uptrend but then the asset chart shows a downwards movement but looking at the MacD Indicator it corresponds to the asset chart showing a downtrend since it is still below it zero mark. This filters out the false signal showed by the Aroon Indicator.
Filtering out Late Signal
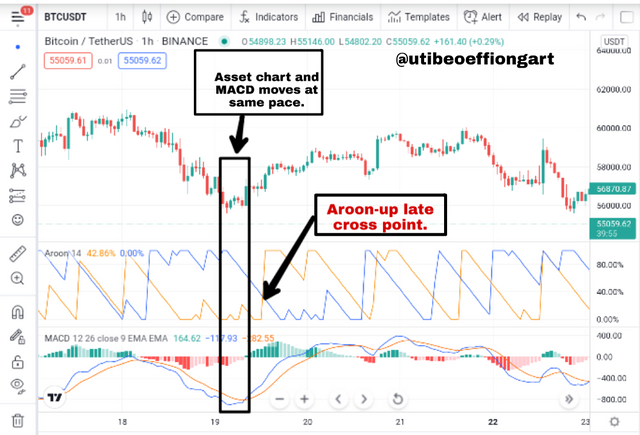
The same way an indicator is prone to false signal it is also prone to late signals but with the help of the combination of such Indicator with another Indicator then such could be filtered out. Let's see the chart below.
Screenshot from trading view
Looking at the chart above the Aroon Indicator shows a late signal because it responded late to the Uptrend. But then with the introduction of the MacD Indicator the MacD Indicator shows an early Uptrend move as the asset chart Candles make the same bullish move which is eligible to give a trader reassurance of an Uptrend.

Place at least one buy and sell trade using the Aroon Indicator with the help of the indicator combined in (7) above. Use a demo account with proper trade management. (Screenshots required).
Buy Trade.
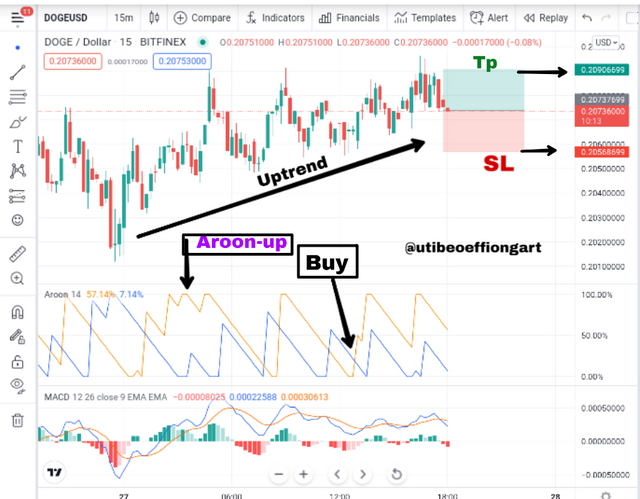
To carry out the trade I'll be using two Indicators which are, the Aroon Indicator and the MacD Indicator.
Screenshot from trading view
Here using the DOGEUSD asset pair at a 15 minutes time frame I observed the market for sometime, and then at a point I noticed that the Aroon-up crossed the Aroon-down Indicator line which was also confirmed by the MacD Indicator by staying above the 0 line level Indicating an Uptrend. This movement of the Aroon up above the Aroon down signaled a buy trade I observed amtye market for a few more bull candles when I was convinced enough, I Opened the trade.
Here at a 1:1 risk level I entered my buy trade setting my Take Profit level at $0.2090 and Stop loss at $0.2058.
Sell Trade
Screenshot from trading view
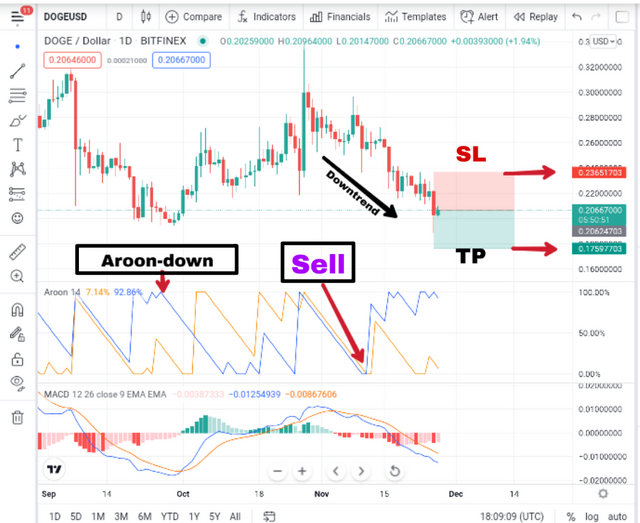
Still setting my chart with the Aroon and the MacD Indicators so I can have a filtered and more reliable trade expedition. Here I used the DOGEUSD asset pair at a 1 day timeframe. I then observed my chart for a while and saw the Aroon down crossing over the Aroon up signaling a sell trade entry. For further confirmation I observed the MacD and saw that it gave a confirmation of a downward movement.
With this I proceeded to open the trade at 1:1 risk level setting my Take Profit at $0.1759 and the Stop loss at $0.2365.

State the Merits and Demerits of Aroon Indicator.
Merits of Aroon Indicator
The Aroon Indicator is very easy to read. So to novice or beginners trader this Indicator could be it great help.
Helps trader determine when to enter or exit a trade by simply understanding the trend flow of the Indicator.
The crossing of the Aroon line on each other helps traders identify trends early.
The strength of a trend is also detected by the Aroon Indicator.
The Aroon Indicator works perfectly well in combination with other Indicators like the Bollinger Band, RSI, MacD etc.
Demerits of the Aroon Indicator
At highly volatile market the Aroon Indicator usually give false signal because of it's reaction to every little details of the asset price movement.
The Aroon Indicator being a lagging Indicator at some point gives late signal vis a vis the importance ot combining it with other Indicators for filtration.
The Aroon Indicator might still be intercepting each other during ranging market which is also a false signal and disadvantage to the trade involved. She combined with other Indicators it could be filtered out.

Conclusion
In conclusion, it is important for traders using this Indicator to understand the crossing of this Indicator lines. And very importantly, also understand thier setting style(Indicator line colour) so they don't mistake Aroon-up line for Aroon down line.
Aroon up crosses the Aroon down upwards to signal a Bullish trend and the Aroon down crosses the Aroon-up line to produce a bearish trend. This could be faulty at some point therefore it is important to combine this Indicator with other Indicators for a perfect trading experience.
Thank you.
Downvoting a post can decrease pending rewards and make it less visible. Common reasons:
Submit