
Now to the lectures proper

Creatively discuss Keltner Channels in your own words.
Keltner Channel
The Keltner channel indicator is a three line indicator that measures the volatility of a proceeding asset price. It extends equally from the middle line by a multiple of 2. The middle line is called an EMA(Exponential Moving Average) set at default to period of 20 written as EMA-20. Like I said before the upper band and the lower band expresses it self at an equal distance from the middle. This is an opposite of an alligator indicator which can meet each other any time in a presumption that the mouth of a real alligator is closing.
The Keltner channel indicator was first designed and created by Chester W. Keltner in middle 1960 but then it was improved by Linda Raschke in 1980.
The Keltner channel indicator is another special indicator I have learnt this season and it is easy to understand, so let me break it down. The Keltner channel indicator like the Bollinger Band has three lines running through the asset price candles, were the upper line makes for up trend determination and then the lower line makes for downtrend identification and all this happens with the support of the middle line which is the Exponential Moving Average. This I'll explain more when showing us how to identify trend or relative question as I proceed.
Some very beautiful features the keltner channel indicator can help us identify during a trending market include; the trend (either upwards or downwards), dynamic support and resistance, break out etc.

Setup Keltner Channels on a Crypto chart using any preferred charting platform. Explain its settings. (Screenshots required).
Addition of the Keltner Channel Indicator to a Chart
- First of all you log into the https://www.tradingview.com/ platform and choose an asset of your choice as seen below.
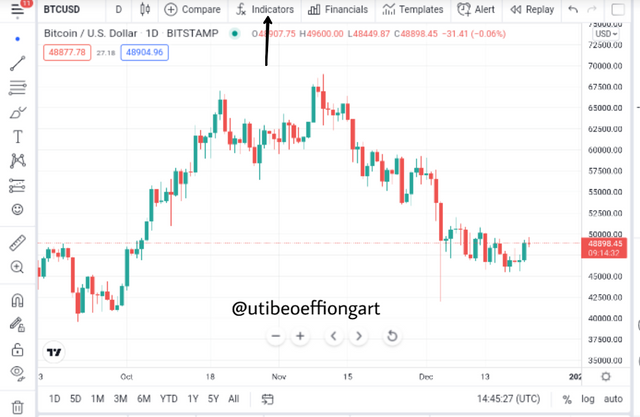
Screenshot from tradingview
- After the above page appears, you choose the fx indicator sign as seen above and the page below will come up.
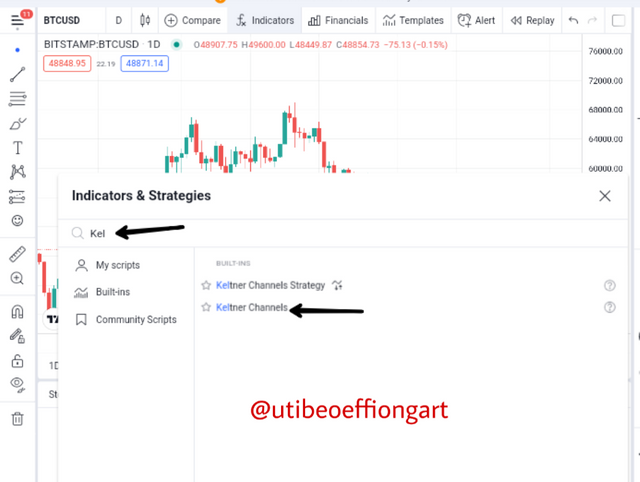
Screenshot from tradingview
- Then the indicator is applied on the chart immediately it is clicked on as seen below, we proceed to Configuration of the indicator.
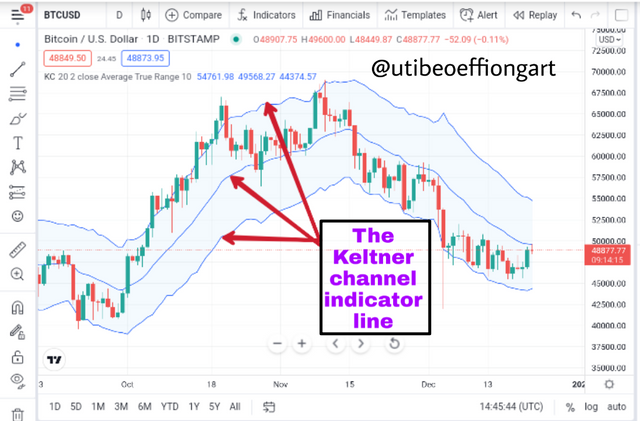
Screenshot from tradingview
Configuration/setting of the Keltner Channel Indicator
So after the application of the Keltner channel indicator on the chart, let's proceed to configuring the chart. The configuration portal has 3 features which is the Input, Style and Visibility.
Input
- So first of all I click on the setting button of the indicator and the setting portal will appear.
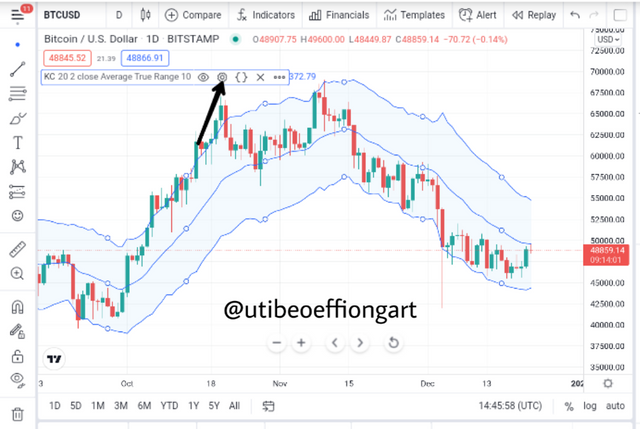
Screenshot from tradingview
- After the setting button is clicked the first setting feature is the Input so we will work on that first. Now the input part has to do with the setting of the period and other relative features as seen below.
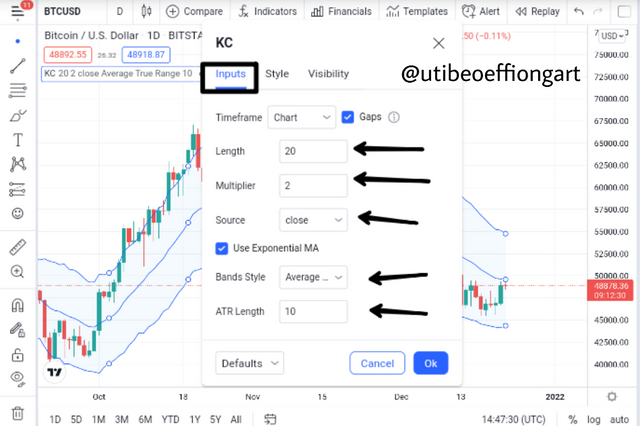
Screenshot from tradingview
- Now the screenshot above is an unedited input setting. But then I'll proceed to make some editing in order to observe the effect that it will have on the indicator in the main chart.
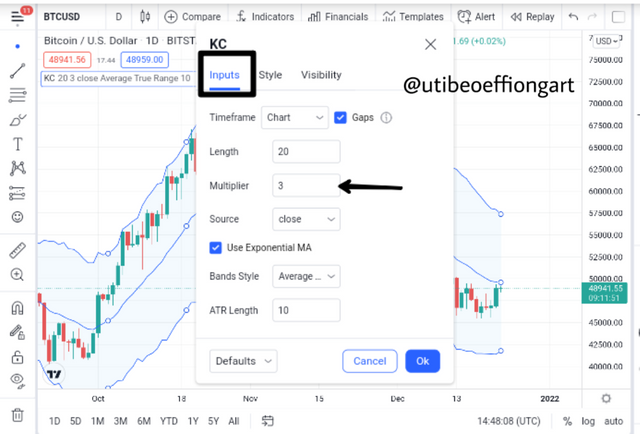
Screenshot from tradingview
- Now I effected some changes on the input portal and that was on the multiplier that I earlier spoke about in question one being the distance between the indicator lines from the middle line. By default it is by 2 but then am making it 3 here so we will see the effect later on.
Style
Now the style feature of the indicator setting has to do with the color of the indicator line and also the thickness level of the indicator line. Below I changed the color of the Upper and the Lowers and also the thickness. I changed the color from all blue to the upper line being red and the lower being green as seen below.
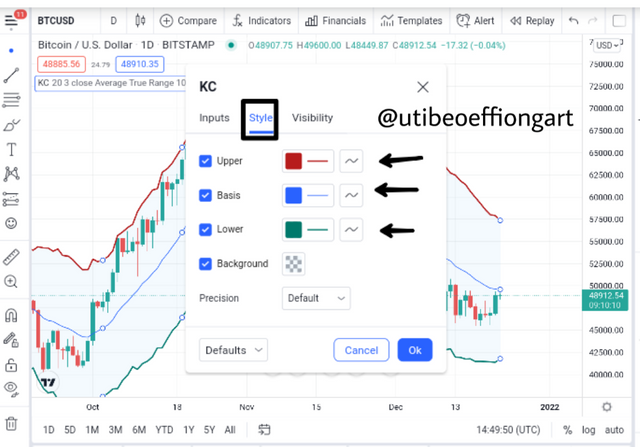
Screenshot from tradingview
Visibility
Now the visibility is more like the display pattern the indicator is displayed in. So the trader using the indicator can choose to set the display or visibility to what ever he/she like. Now setting the visibility will cause two things to happen and that will be either increasing the noisiness or reducing the noisiness of the indicator.
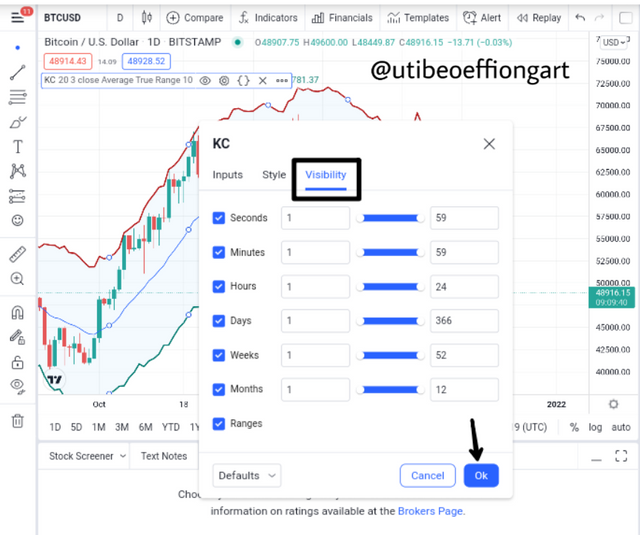
Screenshot from tradingview
- After the settings the screenshot below shows the effect of the setting on the indicator.
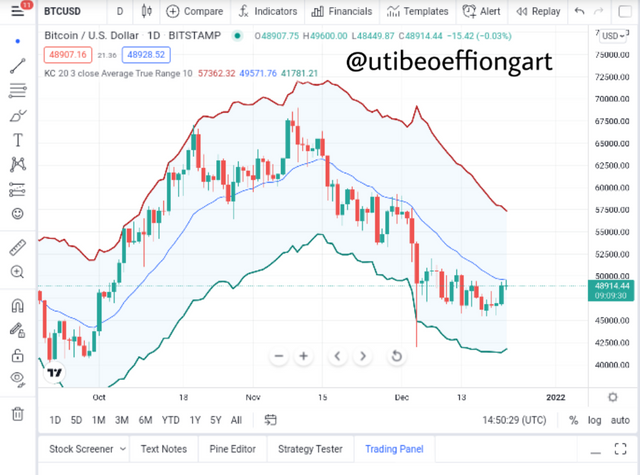
Screenshot from tradingview

How are Keltner Channels calculated? Give an illustrative example.
Keltner Channel Indicator Calculation
In Calculating the Keltner indicator then the Upper band, Middle band and the lower band must be taken into consideration for the calculation to be possible. The formula for calculating the Keltner Channel goes thus;
The upper band = EMA + 2 × ATR
The lower band = EMA - 2 × ATR
Now the middle line is always set by the trader to what he/she wants or decide to leave it at the default setting.
Where;
EMA = Exponential Moving Average
ATR = Average True Range
Now the values of the afore mentioned variables can be seen on the chart below.
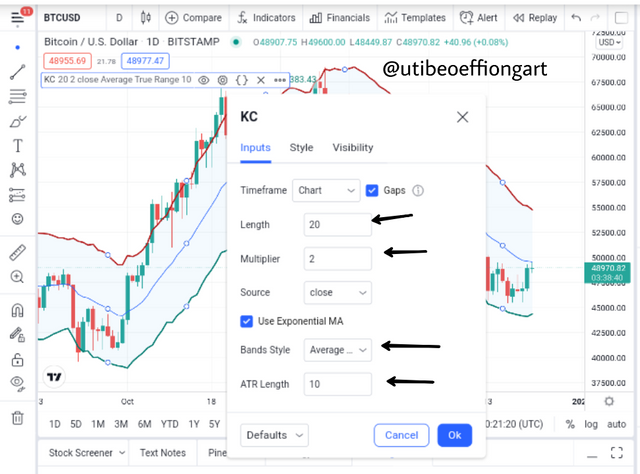
Screenshot from tradingview
From the chart above the below are the derivatives.
EMA period =20
ATR length = 10
Multiplier = 2
Therefore inputting this into the formula as we proceed below;
The upper band = EMA + 2 × ATR
The upper band = 20 + 2 × 10
Note that to solve this you have to engage the BODMAS principle so you don't miscalculate this formula and this means Bracket of Division, Multiplication, Addition and Subtraction (BODMAS).
Therefore;
The upper band = 20 + 20
The upper band = 40
After we have calculated the upper band let's proceed to calculating the lower band.
The lower band = EMA - 2 × ATR
The lower band = 20 - 2 × 10
The lower band = 20 - 20
The lower band = 0
So from the above calculation the upper band value is far more tangible than the lower band meaning that the angle of the indicator will tilt upwards predicting an uptrend.

What's your understanding of Trend confirmation with Keltner Channels in either trend? What does sideways market movement looks like on the Keltner Channels? What should one look out for when combining 200MA with Keltner Channel? Combine a 200MA or any other indicator of choice to validate the trend. (Separate screenshots required)
Trend Confirmation with Keltner Channel
Now a trending market as we know can either be an uptrending market or a downtrending market. So below is an exposition on the the two trends.
Uptrend with Keltner Channel
Now as it is usually taught, an uptrending market usually known as a bullish market is a market that is proceeding upwards. Here the Keltner sets it's angle upwards, in that the price moves between the upper line and the middle line. Let's see in the chart below.
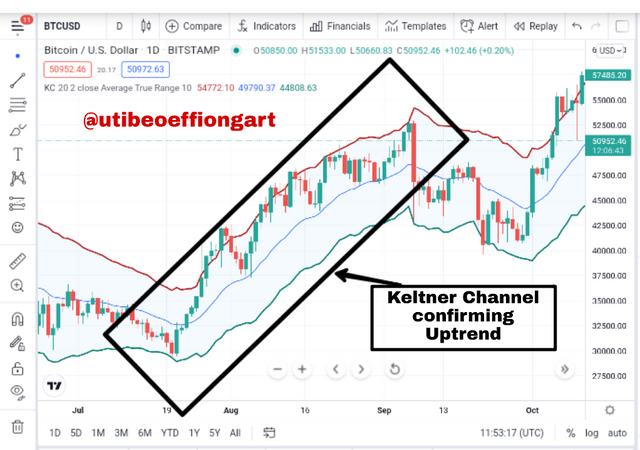
Screenshot from tradingview
Looking at the BTCUSD asset pair above after a downtrend market the market experienced a reversal proceeding upwards. The keltner channel indicator helped confirm the trend and that is seen were the candles proceeded upwards within the channel and not just proceeding upwards it did that in a systematic way wee the candles moved in-between the upper line and the middle line called the EMA.
Downtrend with Keltner Channel
As explained above, the proceedings of the upwards trend that is the same experience with the uptrend but in an opposite direction. So here the Keltner Channel sets it angle towards the downtrend and the candles proceeds in-between and it proceeds within the lower line and the middle line. Let's confirm that in the chart below.
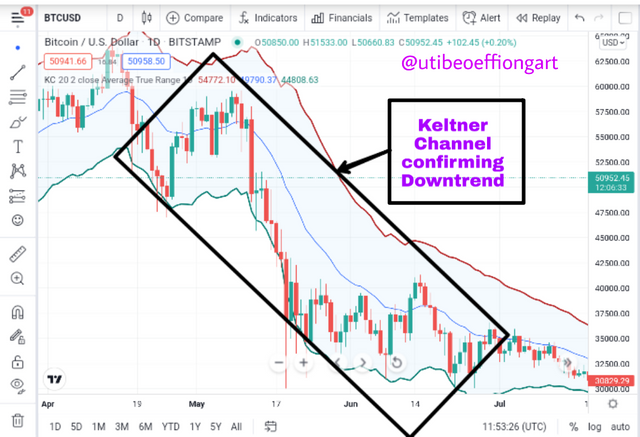
Screenshot from tradingview
In view of the BTCUSD asset chart above, it confirms my explanation of the downtrend confirmation using the Keltner channel indicator. As seen above the candle sticks move between the EMA line which is the middle line and the lower line, when this happens then a downtrend is confirmed.
Sideways Market Movement with the Keltner Channel
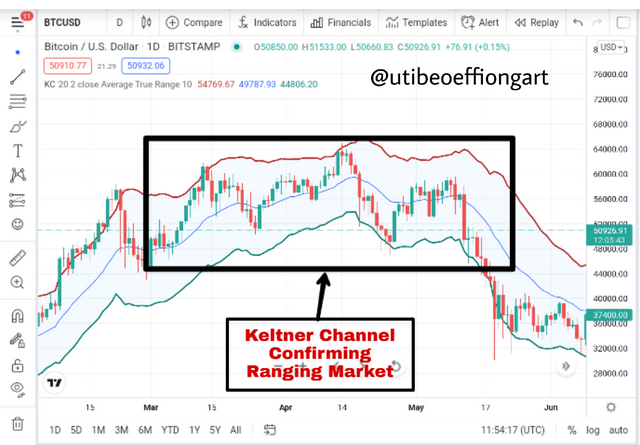
Now a sideways market movement is a ranging kind market were the candle stick of that asset moves in a kind of straight proceedings without a significant upwards or downwards movement to shoe that the market is trending one.
Screenshot from tradingview
Now to confirm that with the Keltner channel as seen above you will notice that Keltner does not maintain a regular pattern of movement unlike the up and down trending market. Here the market price will periodically be in the upward part and at another time moves below the EMA to the lower part. When this is noticed then the market is in a sideways movement also known as a ranging market.
Combining the Keltner channel and 200MA.
Combining the Keltner channel with another indicator such as the 200MA we should be looking out for trend confirmations. That means to use the extra indicator in this chart it will help confirm the trend the Keltner channel will show.
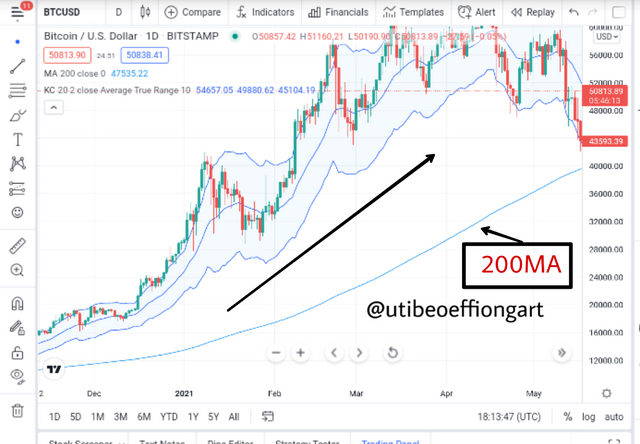
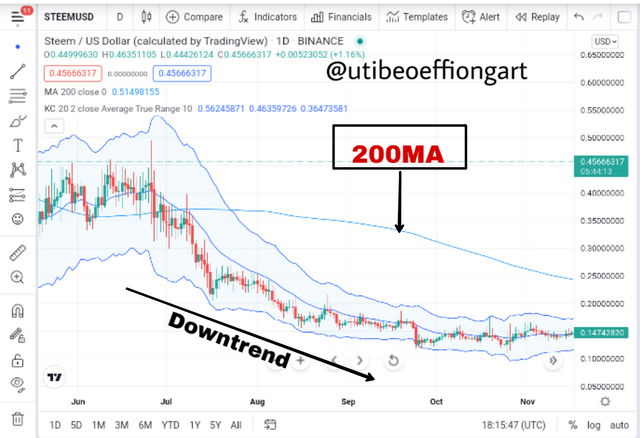
Now when the 200MA is below the market price and the Keltner channel, it show's a confirmation of a uptrend and then when the 200MA is above the price candles and the indicator, it shows a downtrend movement confirmation.
Combining 200MA with Keltner Channel to validate trends
Now when the Keltner Channel is combined with the 200MA the above outcomes is gotten as stated in the above statement. So I'll be validating that with some chart below. That is trend validation with the two stated indicators above.
For Uptrend
Screenshot from tradingview
The above chart which indicates uptrend shows the 200MA below the chart and the Keltner channel. Looking at the above chart the Keltner indicator confirms the uptrend were the candles are seen between the Upper Band Line and the Exponential Moving Average showing uptrend.
For Downtrend
Screenshot from tradingview
Looking at the above chart the 200MA indicator is seen above the candles of the chart and this signifies a downtrend. To further confirm that the Keltner channel has the candles gather between the EMA and the lower channel line.
For Range
Screenshot from tradingview
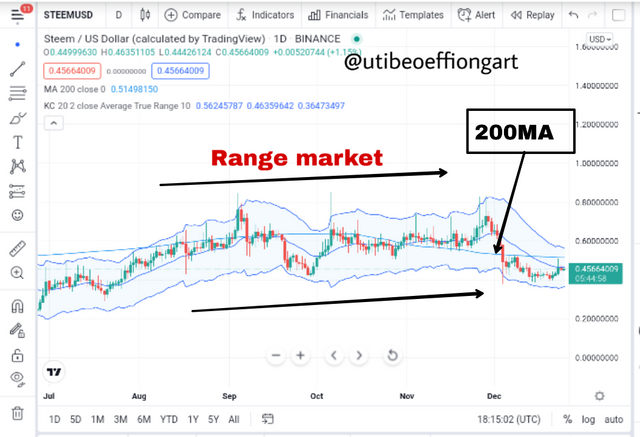
Now to identify the range market with the Keltner channel and the 200MA it is very easy in that sense that the two indicators are all within the candle sticks but then the candles are move from the upper and the lower band irregularly but progressing sideways.

What is Dynamic support and resistance? Show clear dynamic support and resistance with Keltner Channels on separate charts. (Screenshots required).
Dynamic Support and Resistance
Now we know that chart proceed with in swinging motion and this is the basis at which any asset progress in a trading expedition. Now this swinging progression moves makes some crest point both upwards and downwards and this upwards and downwards hits makes resistance and support respectively each time this moves is made.
Now a resistance level is a level were an upward progression hits and gets a resistance and proceed to the opposite direction and for the support level it's when they is a downwards movement in that it gets to a point were it reverses to reverse it needs a support for that to be possible.
Now the concept of a dynamic support and the resistance is not any different from the above explained concept though it occurs between a channel in this case. And that channel is the upper, middle and lower bands. Were the upper bands make the resistance and the lower bands make the support points.
Chart Confirming the Above Explanations
Now the first scenario will be the Dynamic resistance level were the candles fall between the upper band line and the middle line of the Keltner channel so the crest form the dynamic Resistance or say the non fix resistance.
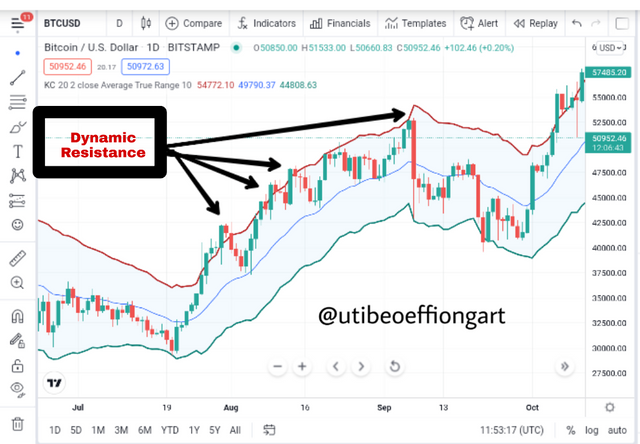
Screenshot from tradingview
Now also the second scenario is the dynamic support case were the candles form a swing between the EMA and the lower band line of the Keltner channel as seen below.
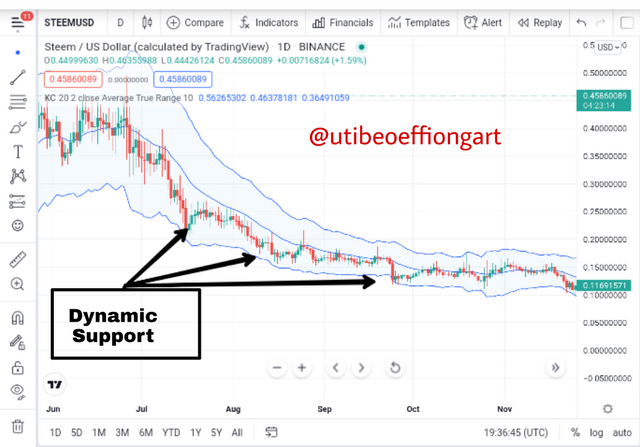
Screenshot from tradingview

What's your understanding of price breakouts in the Crypto ecosystem? Discuss breakouts with Keltner Channels towards different directions. (Screenshots required).
Price Breakout
In the cryptocurency ecosystem when the word breakout is made mention of it is as the name implies, that is for something to breakout or move out from the regular pattern it was following from the onset. Now relating that to the cryptocurency ecosystem breakout occurs when a price which was in range market breaks out of that sideways proceeding to the opposite direction either upwards or downwards.
In that case say a market price was in a range movement, it will breakout towards the resistance region to make an upwards progression after the break. Also for the same to occur for the downwards progression then the market price will breakout at the support level of the price.
Breakout with the Keltner Channel for an Uptrend
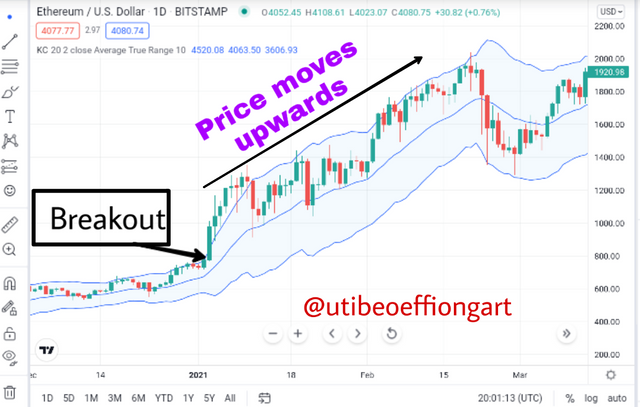
Screenshot from tradingview
Now for the ETHUSD asset chart above showing an Uptrend, it can be seen that the at a point after a series of range movement the price broke out towards the upper band line of the Keltner channel and proceeded upwards. Note that it is always important for the trader to wait for the candles to build up fit some periods before confirming it as a breakout so as not to fall into a fakeout.
Breakout with the Keltner Channel for a Downtrend
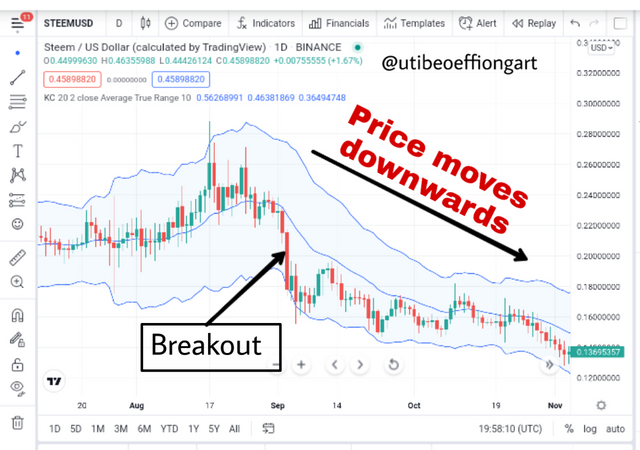
Screenshot from tradingview
Also looking at the downtrend breakout showing afore in the STEEMUSD chart above it is important in combination with the Keltner channel indicator it is important to take note of the place of break out and the proceeding after the break out. As against the break out for the uptrend, here the breakout occurs at the lower part of the Keltner channel that is around the support region and after this the built up candles proceeds towards the downwards region forming series of lower lows between the lower channel line and the EMA.

What are the rules for trading breakouts with Keltner Channels? And show valid charts that work in line with the rules. (Screenshot required).
Rules for Trading Breakout with the Keltner Channel
Now trading a breakout with any indicator though in this case we will be using the Keltner channel indicator, there are set of rules that should be followed which I'll outline below and this rules will be separately set out for the bullish moves and the bearish moves.
Bullish Progression Rules
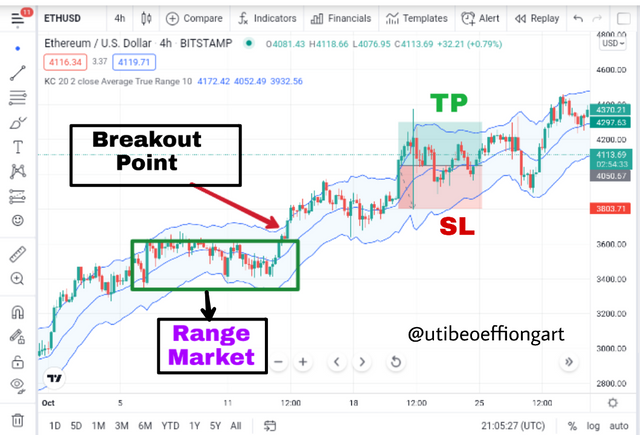
Screenshot from tradingview
The first step is to take notice of a range or say sideways progression observing a price break out point and this point must be at the upper band line were dynamic resistance are formed.
Secondly, as I earlier stated, wait a bit for a retest of the price on the resistance level and the middle line which is the EMA so to give a confirmation of the already formed pattern.
After observing the step two above and you notice that there are up to 2 to 3 complete moves of the same pattern between the upper band and middle then a buy position can be open.
Then a stop loss and a take profit should be placed for risk management to avoid unnecessary losses which in this case I will be doing that in a 1:1 basis.
Bearish Progression Rules
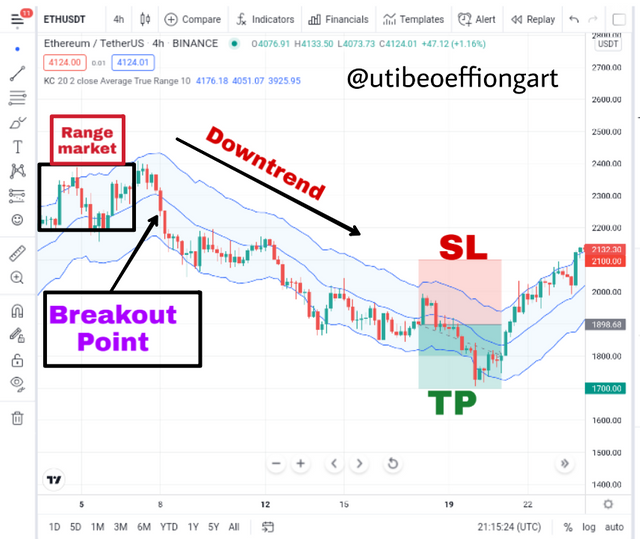
Screenshot from tradingview
The first step is to take notice of a range or say sideways progression observing a price break out point and this point must be at the lower band line were dynamic support are formed.
Secondly, as I earlier stated, wait a bit for a retest of the price on the support level and the middle line which is the EMA so to give a confirmation of the already formed pattern.
After observing the step two above and you notice that there are up to 2 to 3 complete moves of the same pattern between the upper band and middle then a sell position can be open.
Then a stop loss and a take profit should be placed for risk management to avoid losses which in this case I will be doing that in a 1:1 basis.

Compare and Contrast Keltner Channels with Bollinger Bands. State distinctive differences.
Keltner Channel and the Bollinger Band compared
Now comparing the Keltner channel and the Bollinger Band the two indicators are very much similar in that the two;
Have channels as their controls with both indicator having also three lines upper, middle and lower lines correspondingly.
Both indicators are used to identify trends.
Both indicators use price breakout for trade confirmation.
Both use the dynamic resistance and support levels for trend identification.
Distinctive Differences Between the Two Indicators
| Keltner Channel | Bollinger Band |
|---|---|
| Here the upper and the lower bands are formed or sized by the degree to increase or decrease of the ATR i.e the Average True Range. So if the ATR is 2 then the distance between the upper and lower bands from the EMA will be to degree of 2 | While over here the distance between the bands from each other or middle moving like is dependent on the size of the price candles so it the candles formed are large then the channel at that point will be large then if it is small then the channel will be correspondingly small. |
| Over here there is a quicker response to the market price since the size of indicator is not dependent on the size of the candles | while using the bollinger band the reverse is the case because because the bands of the indicator is sized according to the size of the price candles formed during a trading expedition. |

Place at least 4 trades (2 for sell position and 2 for buy position) using breakouts with Keltner Channels with proper trade management. Note: Use a Demo account for the purpose and it must be recent trade. (Screenshots required).
Trade placed for Buy Signals with Keltner Channel
Trade 1
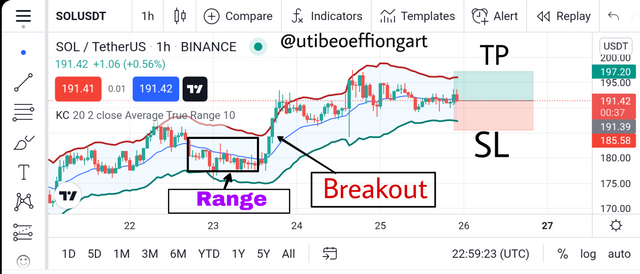
Screenshot from tradingview
In view of the placed trade above taking cognizant of the rules of placing trade with the breakout method. I placed the trade at a stop loss of $191.39 abd a take profit of $197.20. The Trade was placed with SOLUSDT asset pair at a 1hr time frame and risk level of 1:1.
Trade 2
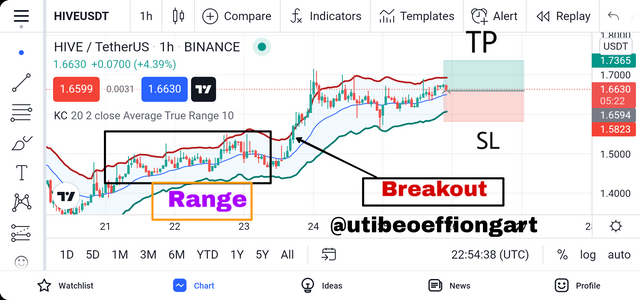
Screenshot from tradingview
This buy trade was also placed with HIVEUSDT asset pair at 1hr timeframe Aksu at a risk management level of 1:1. I set my take profit and stop loss levels at $1.7375 and $1.6594 respectively.
Trade Placed for Sell Signals with Keltner Channel
Trade 1
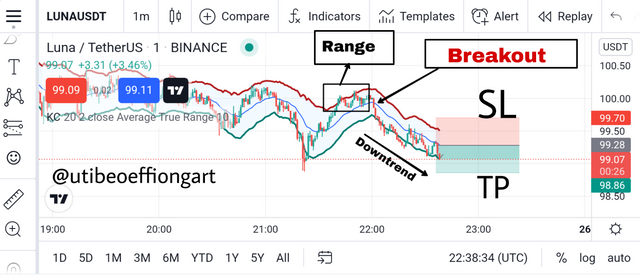
Screenshot from tradingview
Further more the above sell trade is set with LUNAUSDT at a 1 minute time frame with a 1:1 risk management level. The trade was set at a stop loss and take profit levels of $99.70 and $98.86 respectively.
Trade 2
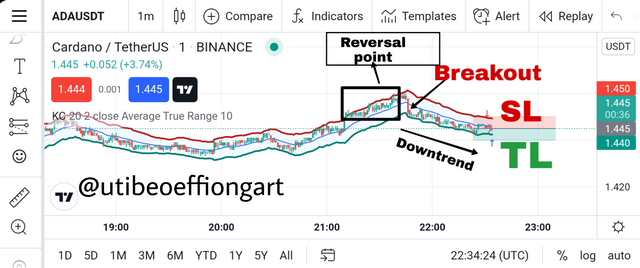
Screenshot from tradingview
Also the above sell trade is set with ADAUSDT at a 1 minute time frame with a 1:1 risk management level. The trade was set at a stop loss and take profit levels of $1.445 and $1.440 respectively.
The proofs of the afore placed trades are showed below.
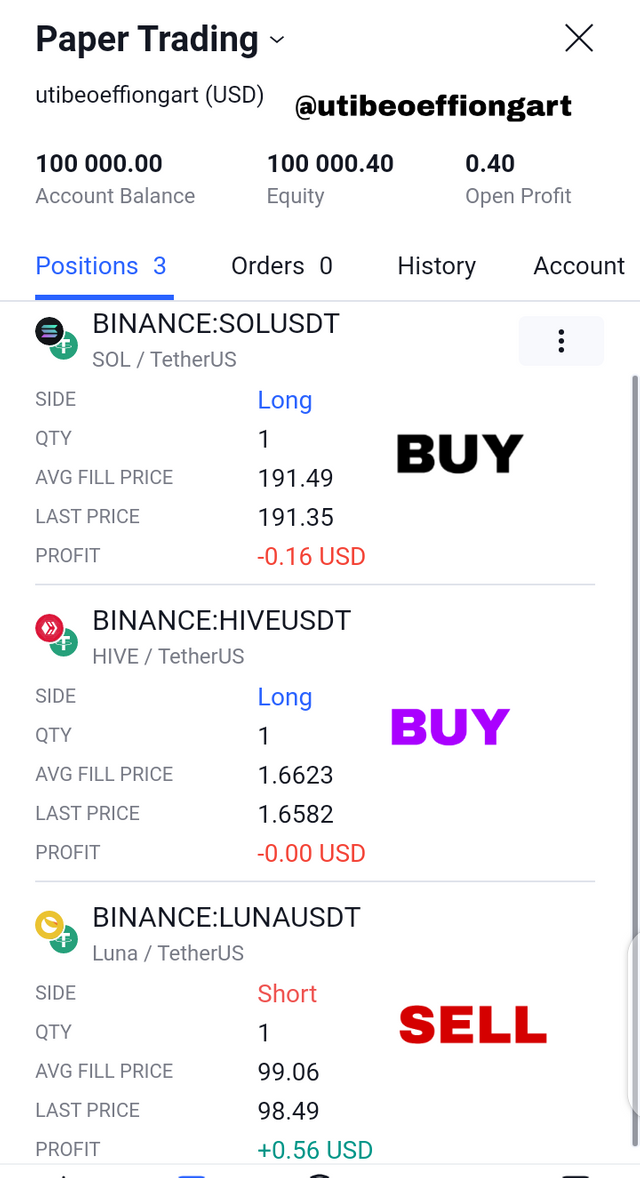
Screenshot from tradingview
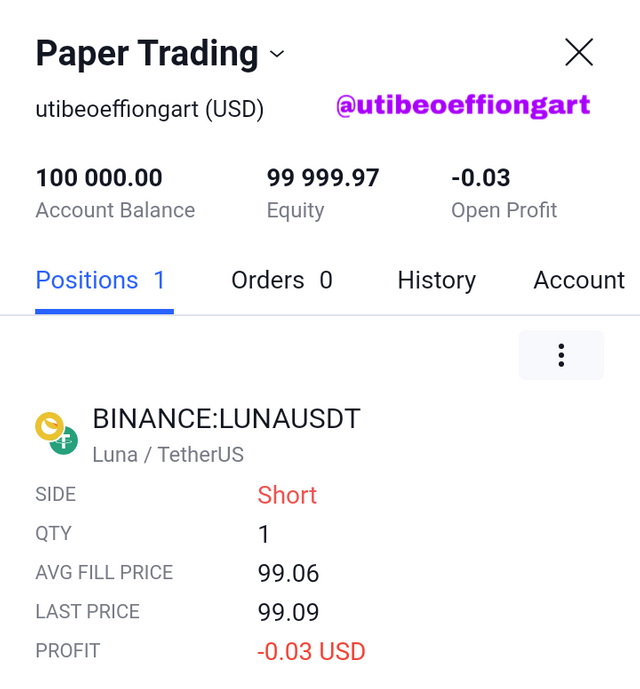
Screenshot from tradingview

What are the advantages and disadvantages of Keltner Channels?
Advantages of Keltner Channel
Aids in trend identification and confirmation with the use of the upper and lower bands this made very easy looking at thier relations with the middle line as explained previously in.other questions answered above.
It is very easy to understand. In this case even the amateur traders can use this indicator easily with very minimal errors experienced.
Works well.eotg other indicators. Example of such indicator is the moving average MA set to a 200 period length.
Trade entry positions can easily be detected with the breakout principles.
Disadvantages of the Keltner channel indicator
There is so much possibility of false signals therefore traders always adviced to not use any indicator in isolation so to be able to filter out this false signals to avoid losses.
Late signal is another major problem associated with this indicator, were the market price will successfully make proceedings while the indicator channel trail behind. Again it is always important that this indicator is not used in isolation but in combination with orhe indicators to filter out this lagging nature.

Conclusion
Conclusively, the Keltner channel indicator is another very interesting indicator with so much similarities with the bollinger band indicator though it has some or distinct differences but then both can be used to identify trends, enter trade also identify dynamic resistance and support levels.
It is important to note that the Keltner channel has three lines as I have earlier stated and this three lines work together to form a channel, called the upper, middle and the lower band lines.
That when the candles exist between the upper line and the middle line it is identified as an Uptrend and when the chart candles ones again exist between the lower lines and the middle it is identified as a downtrend.
It is important to note also that the distance between the two lines or the Keltner channel indicator from the middle line known as the EMA (Exponential Moving Average) is designed in a multiple of 2 at default though it is subject to change based in what the trader wants.
Finally, this indicator should not be used in isolation so as to avoid late and false signals, incorporating it with other indicators while trading will be of oughtmost importance to the trader.
Thank you.
Downvoting a post can decrease pending rewards and make it less visible. Common reasons:
Submit