
image created by me on picsart
Now let's move to the assignment proper.

In your own words, explain your understanding of On-Balance Volume (OBV) Indicator.
On-balance volume indicator is a momentum indicator that uses volume to predict price of asset movement, it came into existence far back 1963 by Joseph Granville, where he introduced the technique of OBV in his book titled "Granville's new keys to stock market profit". Which he assume that major moves on the crypto market will occurs based on volume change.
Granville's, in his concept,believed that volume was a major force behind the crypto market in a way that if volume increase or decreases rapidly in the market(market volume) with no significant change in the asset price then the price will go upward or fall downward,that is to say when a volume of an asset decrease without a significant decrease in price, then they price is set to undergo a downward movement while the volume of an asset, if increases without any significant increase in price then the price is set to undergo an upward movement.
In addition, if the volume of buy is high which means the buyer are in control of the market, then the will be a rise in the price causing an uptrend while if the volume of selling is huge then it means that the sellers are in control of the market,then the will be a fall in the price causing an downtrend in the market, all this constitute to the concept of which volume is involve in the price movement.
By such, traders tends to look at the volume to predict where the price action will be going next
feature of on-balance indicator
The OBV is best known for testing around high and low to measure the possibility of breakout and breakdown.
The OBV is used by traders to identify possible breakout in the market and it confirms the market price movement with consecutive higherhigh in uptrend and lower low in downtrend.
The OBV can be use by traders to make major prediction, like bullish divergence predicting that price will break resistance or bullish divergence predicting that price will reverse.
Lastly, the OBV tally around the volume, which create an indicator line where traders used in predicting market price movement based on change in relative trading volume..

Using any charting platform of choice, add On-Balance Volume on the crypto chart. (Screenshots required).
To perform this tasks, I log into a charting platform tradingview then proceed to choosing a crypto pair, here I choosed the BTCUSD asset pair.
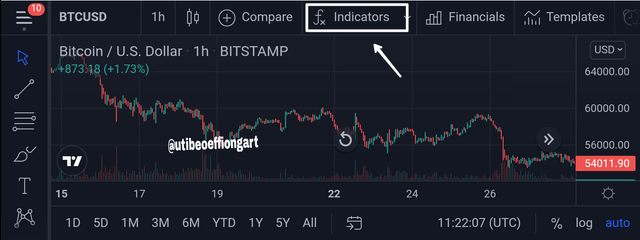
Screenshot from tradingview showing how to add the obv indicator
I then click on the fx indicator at the top of the chart where I indicate above, after which a call out pops up
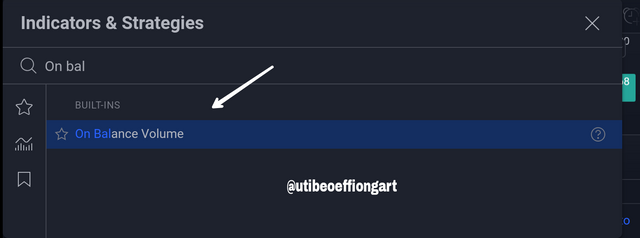
Screenshot from tradingview showing how to add the obv indicator
I then type in the indicator name and click on it immediately it was added to my chart as seen below.
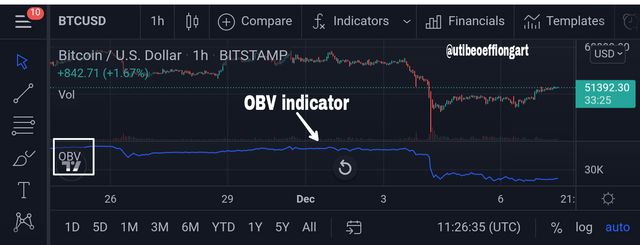
Screenshot from tradingview showing OBV indicator on BTCUSD chart

What are the Formulas and Rules for calculating On-Balance Indicator? Give an illustrative example.
Below is the formula and rules for calculating an on-balance indicator
OBV= current on-balance volume level
OBVprev= previous on-balance volume level
Volume= today trading volume amount
1). If the closing price of today is higher than the one of yesterday(closing price of yesterday) then it is calculated using the formula below.
Current OBV = previous OBV + Today volume
2). If the closing price of today is lower than yesterday's closing price, then it is calculated using the formula below.
current OBV = previous OBV - Today volume
3). Lastly, if the closing price of today is equal to that of yesterday, then it is calculated using the formula below.
current OBV = previous OBV + 0
Illustrative example of on-balance indicator, here I will be using 5 days worth closing and volume.
| Day | closing price | volume |
|---|---|---|
| 1 | $30 | 35,200 |
| 2 | $30.15 | 40,000 |
| 3 | $30.17 | 35,600 |
| 4 | $30.17 | 42,000 |
| 5 | $30.11 | 33,000 |
Using the formula I stated above to calculate,
Here are the current OBV for each of the 5days.
1). Day1 on OBV = 0
( there was no previous OBV and volume)
2). Day 2 on OBV =0 + 40,000 =40,000
3). Day 3 on OBV = 40,000 + 35,000 = 75,600
4). Day 4 on OBV = 75,600 + 0 = 75,600
(The current price is equal to the previous price)
5). Day 5 on OBV = 75,600 - 33,000 = 42,600
Summary:- Day 2 and 3 were up days so this trading volume are added to the OBV indicator, Day 5 was down so the trading volume was substracted from the OBV indicator. lastly, on day 4 there was no changes made in the OBV since the closing price was equal to the previous price.

What is Trend Confirmation using On-Balance Volume Indicator? Show it on the crypto charts in both bullish and bearish directions. (Screenshots required).
As we said earlier, on-balance volume is an indicator which uses volume in combination with price to measure buying force and selling force, where buying force shows that, buying volume surpass selling volume which cause the obv line to go through an uptrend, and also, selling force portrays a scenario were selling volume surpass buying volume, then the OBV line is tend to fall.
Hence, the obv is used to confirm the price trend and both upward breakout and downward breakout, it makes higher high and higher low in the case of uptrend and lower high and lower low in the case of downtrend.
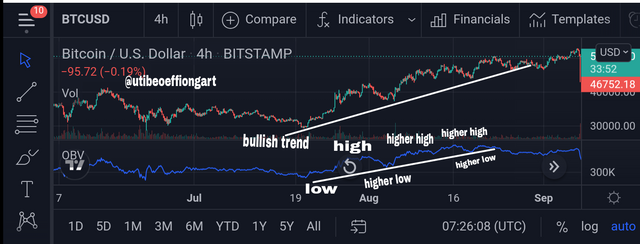
Screenshot from tradingview showing obv bullish trend comfirmation
The BTCUSD chart above, shows how OBV confirms the price trend movement by moving in the same direction, we can see how the trend moved in a series of higher high and high low where it confirms the bullish trend( uptrend).
This save as an opportunity for traders to place a buy entry as the price trend as been confirmed by the OBV indicator.
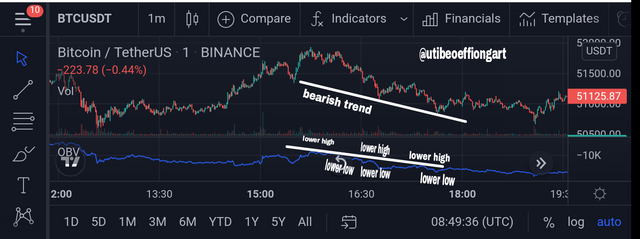
Screenshot from tradingview showing obv bearish trend comfirmation
The BTCUSDT chart above shows how the OBV confirmed the downward price trend as you can see the OBV and the price trend are moving in the same direction creating a series of lower high and lower low..
This save as an opportunity for traders to place a sell entry as the price trend as been confirmed by the OBV indicator.

What's your understanding of Breakout Confirmation with On-Balance Volume Indicator? Show it on crypto charts, both bullish and bearish breakouts (Screenshots required).
Breakout trading as not been really easy for traders as some of them are always been catch on bull/bullish trap cause of fake breakout, but using OBV indicator as a confirmation tool, it can easily differentiate between fake breakout and real breakout in ranging market.
In OBV the volume must go higher if the price is going to break the resistance level and if the volume is reduced then the price is going to break the support level.
The confirmation give traders the opportunity to position for a buy/sell entry.
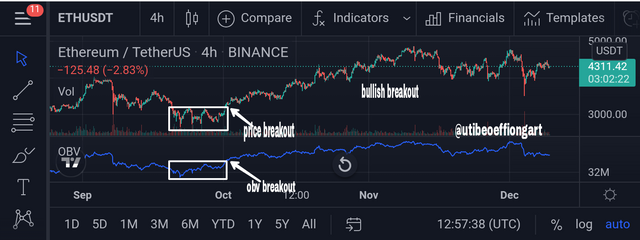
screenshot from tradingview showing bullish OBV breakout confirmation
Above is a ETHUSDT chart, looking closely at the chart, you will see how the OBV corresponded with the price , in otherwords, confirming the breakout to the upside.
The chart shows a high buying pressure were bull took over control of the market from the bear.
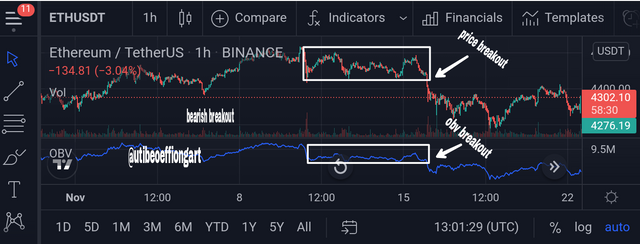
screenshot from tradingview showing bearish OBV breakout confirmation
The chart above is an ETHUSDT chart, the chart portrays a scenario where the a breakout occur to the downside. Above you can see how the price corresponded with the OBV indicator which confirm the breakout that shows the decrease in volume.
The chart generally interpret a huge selling presure where the bear are taking over control from the bulls.

Explain Advanced Breakout with On-Balance Volume Indicator. Show it on crypto charts for both bullish and bearish. (Screenshots required).
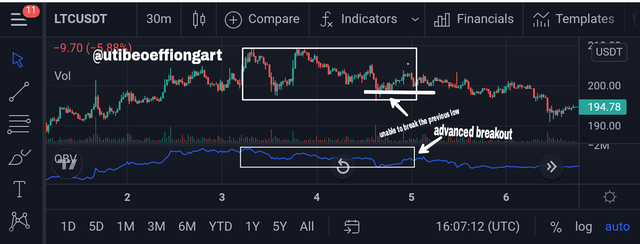
When an obv indicator is creating an higherhigh/higherlow while the price doesn't follow suit, that is to say when a breakout act on obv indicator before the price movement then we consider it an advanced breakout, this enable the traders to predict the next price movement in the advanced breakout direction.
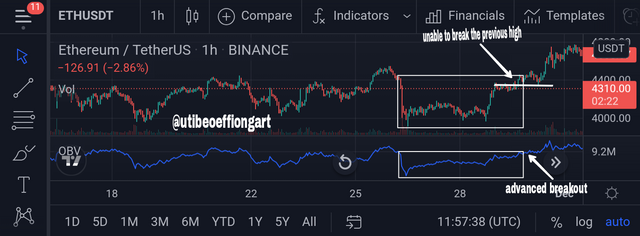
screenshot from tradingview showing bullish OBV advance breakout confirmation
Above is the ETHUSDT chart, here the price couldn't break the previous high while the OBV indicator broke the previous high, this signifys a bullish advance breakout telling us that the will be a possible trend reversal, which is an uptrend as seen above.
screenshot from tradingview showing bearish OBV breakout confirmation
On the LTCUSDT chart above the price was unable to break the previous low while the OBV indicator was able to break the previous low, this signals a bearish advance breakout, telling us that the will be a possible trendreversal to a downtrend as seen above.

Explain Bullish Divergence and Bearish Divergence with On-Balance Volume Indicator. Show both on charts. (Screenshots required).
Bullish divergence
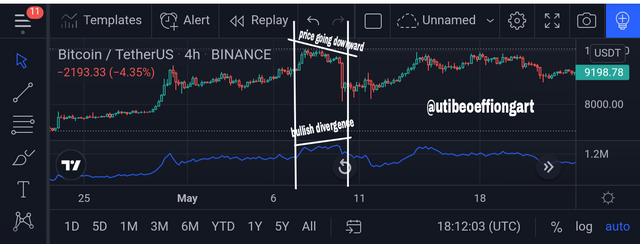
Bullish divergence signal are usually use by traders to anticipate a trend reversal, it is form when a price create or forms a series of lower low and lower high while the OBV create a series of higher high and higher low, which means the price and the OBV indicator line are going contrary or opposite to each other at that point.
This scenerio signifys that the will be a possible trend reversal where the bear will soon take over the market causing a downtrend.
screenshot from tradingview showing bullish divergence
From the BTCUSDT chart above we can see how the price form a downward structure(bearish structure) by forming lower low and lower high pattern but the OBV indicator went contrary to the price, where the volume forms an upward structure(bullish structure) by forming higher high and high low pattern.
Bearish divergence
Just like the bullish divergence, bearish divergence signals are used by traders to anticipate a trend reversal.
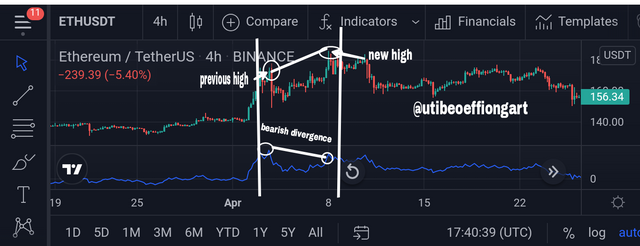
It is usually form when the obv indicator create a series of lower low and lower high and the price create a series of higher high and higher low, this means that the price signal and OBV indicator are going contrary or opposite to each other.
Unlike the bullish divergence, it signifys to traders that the will be a possibe trend reversal where the bulls will soon takeover the market causing an uptrend.
screenshot from tradingview showing bearish divergence
From the ETHUSDT chart above we can see how the price create an upward structure(bullish structure) by forming an higher high pattern while the OBV indicator went contrary to the price by creating a downward structure(bearish structure) with a lower low pattern.

Confirm a clear trend using the OBV indicator and combine another indicator of choice with it. Use the market structure to place at least two trades (one buy and one sell) through a demo account with proper trade management. (Screenshots required).
Sell trade
screenshot from tradingview showing RSI and OBV indicator bearish trend confirmation
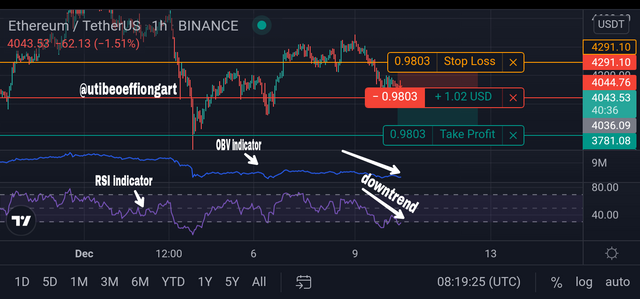
From the ETHUSDT chart, we can see the Price going in a downtrend creating lower high and lower low to signal a bearish trend, here I used the RSI indicator and OBV indicator to confirm the price trend, as seen on the chart, the price and the indicator shows a bearish trend.
I performed this sell trade by setting my stop loss at 4291.10 and my take profit at 3781.00 with an initial price of 4043.
Below is the result of my trade.
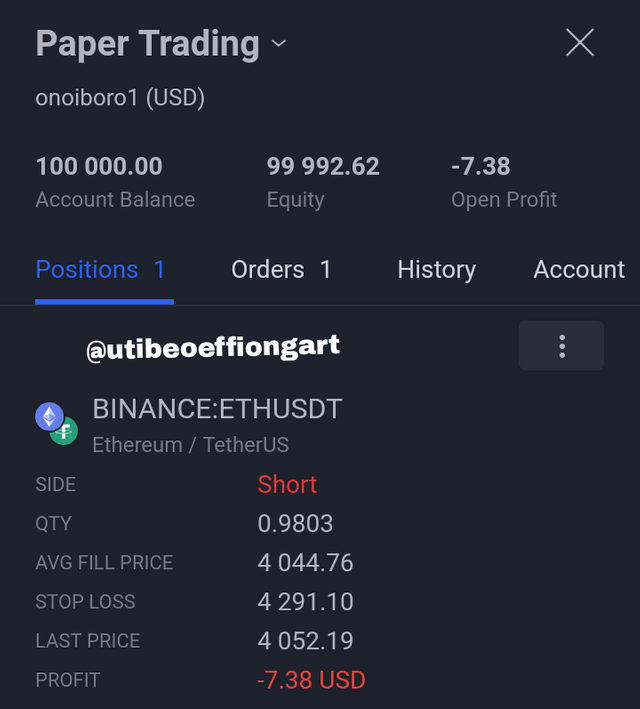
screenshot from tradingview showing the result of my trade
Buy trade
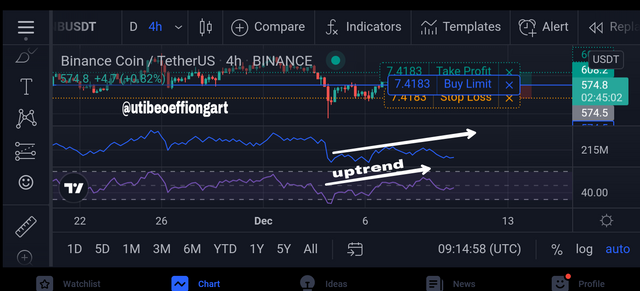
screenshot from tradingview showing RSI and OBV indicator bullish trend confirmation
From the BNBUSDT chart, we can see the price going in an upward direction(bullish trend) creating an higher high and higher low pattern.
Just like my sell trade, I used the RSI and OBV indicator to confirm my price trend, which all signal a bullish trend.
On my trade above I set my stoploss at 540.8 and my take profit at 608.2.
Below is the result of my trade.
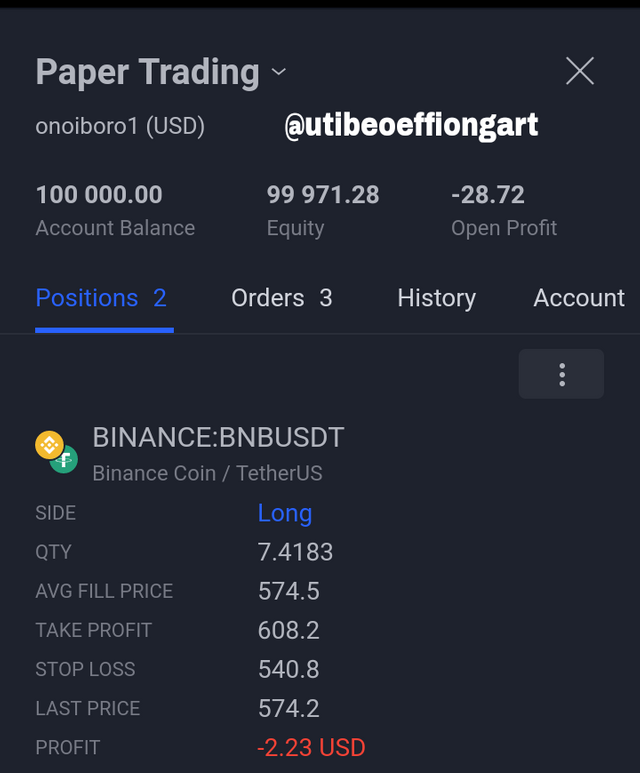
screenshot from tradingview showing the result of my trade

What are the advantages and disadvantages of On-Balance Volume Indicator?
On-balanced volume indicator is easy to understand in terms of calculation.
OBV indicator provide signal to traders for a potential breakout or a potential breakdown when ever the price is moving sideway.
Unlike some other indicators OBV provide traders with ways to detect divergence.
OBV indicators doesn't include all the necessary data need for price movement analysis.
OBV indicator need to be combine with other indicator especially when plotted with smaller time frame so as to prevent it from misleading traders by give wrong trading alert, cause of the noise due to the high volatility.
OBV indicator doesnot consider the degree of price, that is to say, the same volume is added or substracted not withstanding if the price move a little bit high or low..

OBV is one of the best cummulative indicator for measuring volume. if the volume of buy is high then the will be a rise in the price causing an uptrend while if the volume of selling is huge,then the will be a fall in the price causing an downtrend in the market.
The OBV indicator, helps in confirming price trend and also in showing buying and selling pressure, which helps to understand if the bull are buying or the bear are selling.
Once again, thanks you prof. @fredquantum for the well explanatory lecture, indeed have learnt alot about the OBV indicator.
Downvoting a post can decrease pending rewards and make it less visible. Common reasons:
Submit