Now to the lectures proper

1 a) What do you understand by a Trending market?
A trending market is a market where price of an asset are generally moving in a single direction, it can be moving in either upward or downward direction depending on the law of demand and supply.
From the law of demand and supply if the trend is moving in an upward direction it means, there are huge demands for that particular asset or simply we say the market is on a higher buying side. This action cause the price of an asset to close higher than the past high.
Also in the case of the trend moving in a downward direction, it means the price of an asset is experiencing a price decline in other words,the downward trend explains the condition in which an asset price falls. This means sellers are in control of the market with lesser buyer, in this case price close lower than the previous low.
Generally, in cryptocurrency world especially when it comes to trading aspect, trending market provide trading opportunities for traders in a way that the traders will chart the price pattern of an asset to identify trending direction which will help then place investment trade.
b) What is a bullish and a bearish trend? (screenshot required)
BULLISH
Bullish trend is the upward trend, which interprets the growing/rising price of an asset in the stock market.
This bullish trend tends to signify that the price of an asset is continuously rising, at this point the buyers believes the asset price will continuously go higher, so the tends to take advantage of the rising prices by buying the asset immediately the notice an early trend and then sell them as soon as the asset price reaches it peak.
The bullish trend portrait a strong demand and weak supply for asset.
From the chart below you can see the bullish trend indicated.
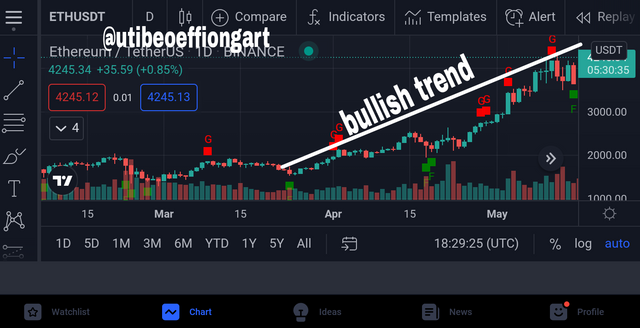
ETHUSDT chart on tradingview showing the bullish trend
BEARISH
Bearish trend is the opposite of the bullish trend. That is to say, the bullish is the upward trend the bearish is the downward trend..
This downward trend interprets the falling of the price of an asset apparently encouraging the asset holders to sell their asset to avoid further lost.
The bearish occur when the demand is significantly lower than the supply, this cause the price of an asset to slide down and therefore causing a bearish trend.
Below is the image showing the bearish trend.
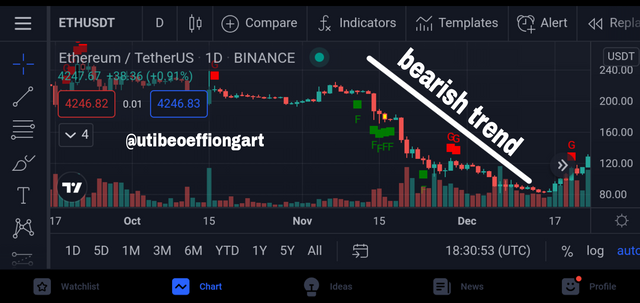
ETHUSDT chart on tradingview showing the bearish trend

2). Explain the following trend identification and give an example of each of them. (Original screenshot needed from your chart). Do this for a bullish and a bearish trend.
i) Market Structure.
ii) Trendlines
Market structure
Market structure is a trend tools that crypto traders reads and follow to understand the current state of the market based on how a particular asset or market moves.
This moves can be from bullish(upward) to bearish(downward) and in between with range(ranging) or vice versa.
In general,market structure is a simple and a basic form of understanding how market moves in order to be able to make trading decisions base on the market movement.
Bullish trend
When looking at a chart you can simply identify the bullish market structure through the two set of higher high and higher low.
The bullish market structure depicted a series of higher high and higher low. This formation portrays a continuous increase in price which means the price did not trade below the past low and close above the past high.
At this point, as the price rise it always adviseable for traders to sell off their asset and has it fall it is adviseable for traders to buy asset.
Below is the chart of a bullish market structure.
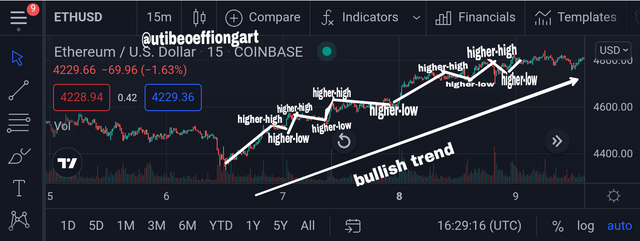
ETHUSD chart on tradingview showing the bullish trend.
Bearish trend
Bearish market structure depicted a series of lower high and lower low in the market, this means the price didn't close above the previous high.
You can simply identify the bearish market structure in a chart seeing the 2 set of lower high and lower low.
Unlike the bullish, the bearish market structure formation portrays a gradual decrease in the price.
Below is the chart of a bearish market structure
Trend line is one most important tools used to identify trend, because it easy to understand and can be used with other tools. Bullish trend line In the bullish trendline, market price normally trades above the trend line and it bounce back when it touches or hit the the trendline, where it find support and goes up again. At this point it is adviceable for traders to gain entry into the market and take advantage of it. Below is the chart showing the bullish trendline. bearish trendline The bearish trend is use in identifying and confirming trends and also act as a resistance. It show that there is more supply than demand in the market( that is to say there are more seller than buyer). Below is the chart showing the bearish trend The trend continuation helps signals, that the ongoing trend will continue or reverse. The trend continuation helps traders to indicate if price trend will remain continuous or if reversal will happen. A bearish To spot the trend continuation in market structure the following keys point must be taken into consideration. Below is the chart for bearish trend continuation. A bullish To spot the trend continuation in the market structure the following key point must be taken into consideration. This bullish trend continuation normally show that the buyer are the once dominating the market. At this point traders are meant to buy asset. Below is the chart for bullish trend continuation. Trend line is always represented with support and resistance in any timeframe. The trend continuation is valid if the trendline is not broken and it normally signal a reversal if the breach crosses the trend line. This is for both the bullish and bearish. Below is the chart for bullish and bearish trend continuation.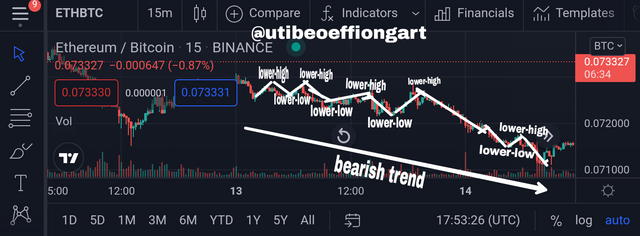
ETHBTC chart on tradingview showing the bearish trend.
Trend lines
Trend line is a line that connect two or more lows for an uptrend and two or more high for a downtrend with the line extended out into the future. Through this extended line traders reads and trade on price reacting around them.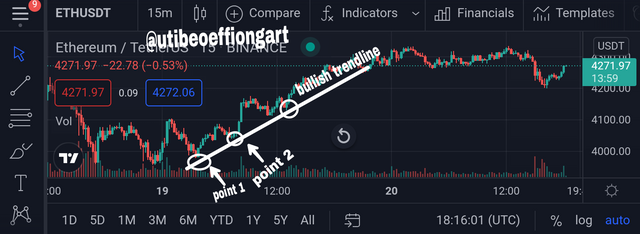
ETHUSDT chart on tradingview showing the bullish trendline.
In the bearish trendline, market price normally trades below the trend line. This trendline is created by connecting two or more highs with each successful high, lower than the previous low.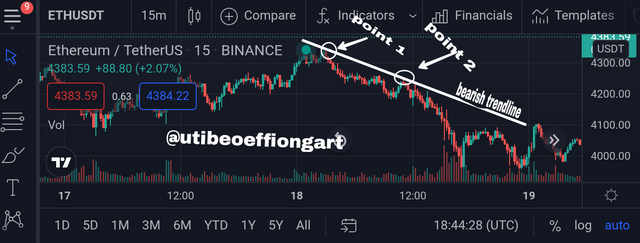
ETHUSDT chart on tradeview showing the bearish in trendline.
When looking at the stock chart it sometimes happens to be completely in a random movement, that is to say price doesn't move in one direction forever the normally fluctuate and touch the trendline for a trend to continue. These is because traders are taking profit and exiting the market which give way to a continuity in the trend at it original direction.Trend continuation in market structure
A bearish is a series of lower high and lower lows. To spot a trend continuation in bearish trend you will notice that the retracement creates a high point that is lower than the previous high which usually means that the seller are there ones dominating the market, at this point the trader are meant to sell of their asset so all the profit will not be eroded by falling price.
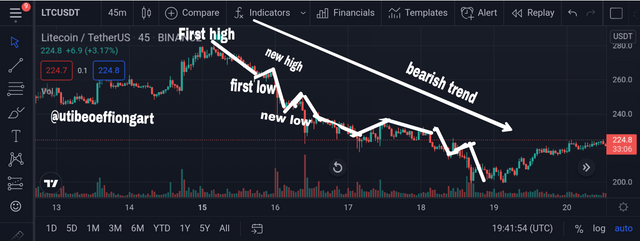
LTCUSDT chart on tradingview showing the the bearish trend.
A bullish is a series of higher-high and higher-low.
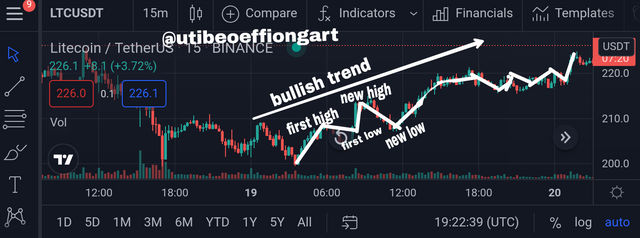
LTCUSDT chart on tradingview showing the bullish trend.Trend continuation in trend line
For this trendline to be valid at least three high and low must be used. That is to say the more the price touches a trendline there more valid it is..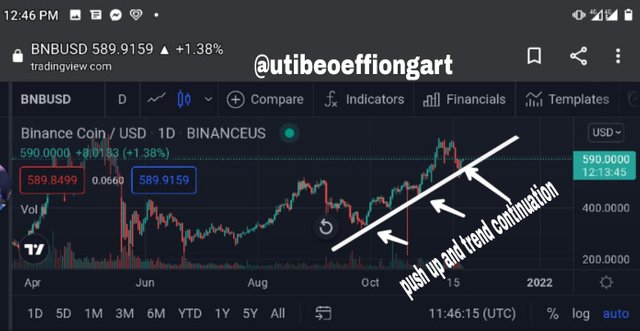
BNBUSD chart on tradeview showing the bullish in trendline.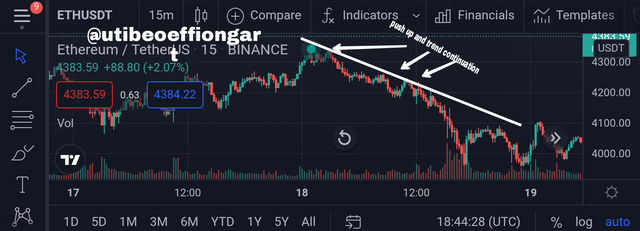
ETHUSDT chart on tradingview showing the bearish in trendline.
i) Is the market trending?
ii) What is the current market trend? (Use the chart to back up your answers
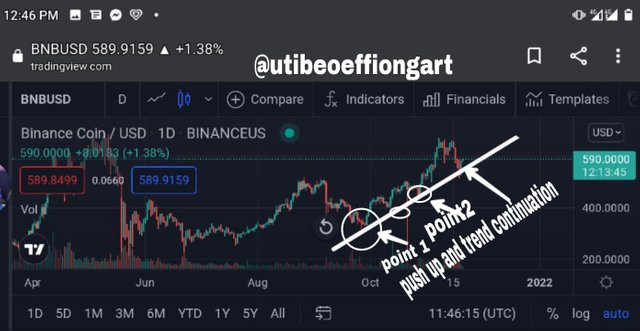
According to the question I will be using the BNB/USD chart has seen above, looking at the chart closely you will observe that BNB begin an uptrend on October, where it rise from $350 to an high price $589. That is to say since last month the market as been going through an uptrend with higher-high and higher-low formation.
From the chart I say a yes!!, the BNB market is trending.
According to the chart above we can see that the market is going through an uptrend in otherwords, the current trend is a bullish trend.
This trend implies that there are huge demand in the market which means that the buyer are currently dominating the market .
From the chart above we can see how the price hit the trend line and bounce back to continue the uptrend(bullish), this saves as an entry point for buying to enter into the market and take advantage of it.

A trend is an upward and downward movement of an asset price over a period of time, where the upward movement is the uptrend(bullish trend) and the downward movement is the downtrend.
Generally, as a trader it very important to understand a trend, cause it help in the aspect of trading by telling you which asset are expected to take a liftup and how risky the market will be along the way. Knowing that if you sell an asset before the price hit it height you may lose out on making good profit and if you buy an asset before the price falls to it lower point then you stand a chance of making profit when you sell it.
Once again thank you prof. @reminiscence for the well explainatory lecture.
