Hello steemians how are you? I hope you all are doing well and you all are safe and healthy during this pandemic time. Hope we all soon get the vaccine.
Today I go through one of the best and simplest language explanation homework posts by @asaj on CII indicator. It's interesting to read the lecture post. Now I am Submitting my homework post to the professor.
HOMEWORK

QUESTION 1:
Create a demo account and add 5 crypto pairs.
ANSWER 1:-
I have created my demo account on TradingView. It is a cloud based trading software available for both beginners and Advance traders or investors.
To create an account we have to follow few steps as shown below :
- Search trading view on google search engine and click on the first link shown or else click the link given below.
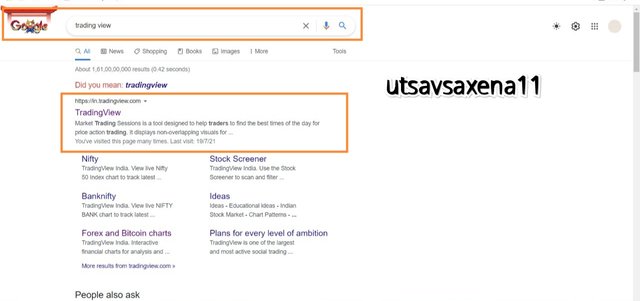
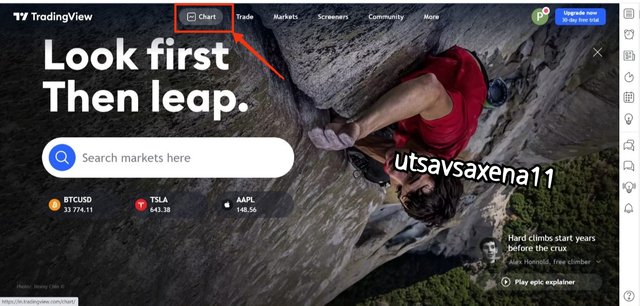
- Now click on chart option and select any one chart.
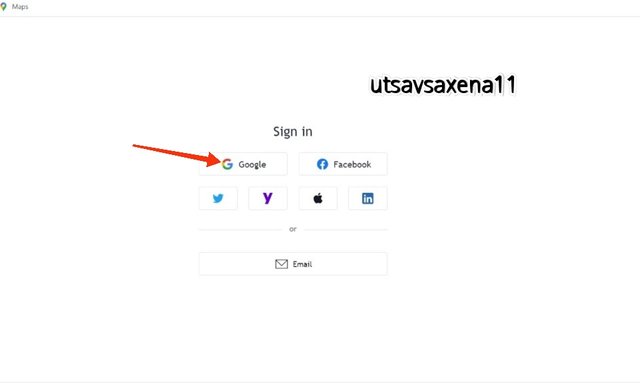
- Click on left top 3 lines and click sign in, use your google account or any other email to login you trading view account.
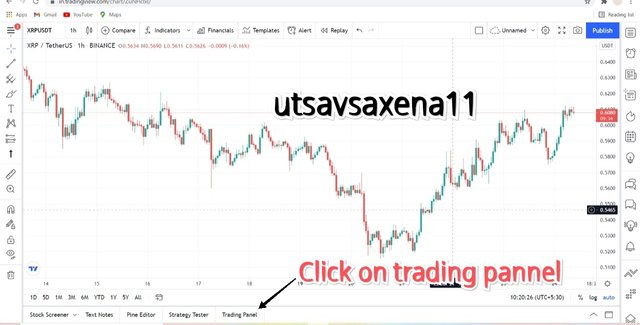
- Now in the bottom there is a task bar having 5 options. Click on the option named as trading pannel.
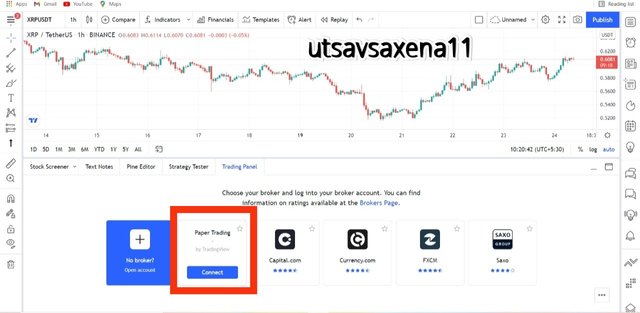
- Now in trading pannel there are around 5 demo trading platform available, click on paper trading you can see an option to connect, click on that option.
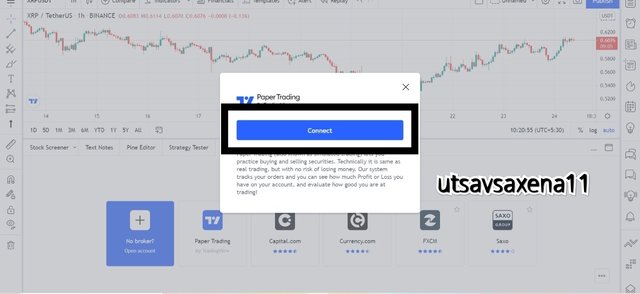
- Now your Demo wallet is ready to use with your user name and demo amount of 1,00,000 usdt.
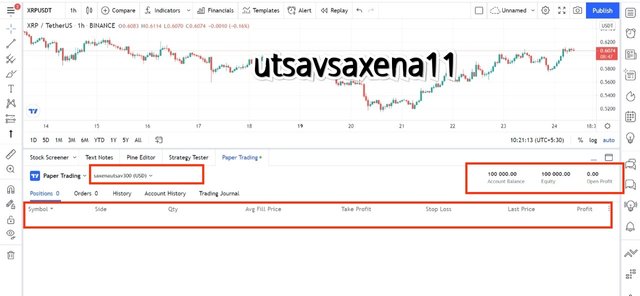
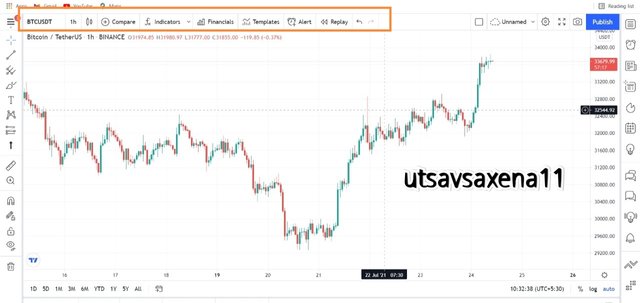
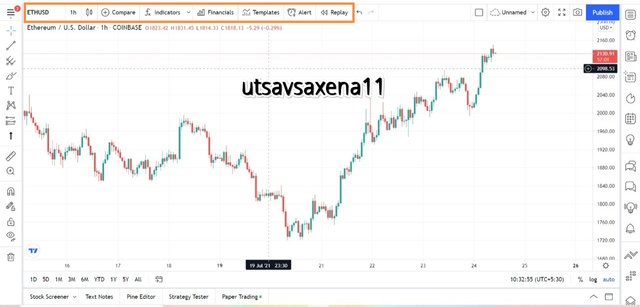
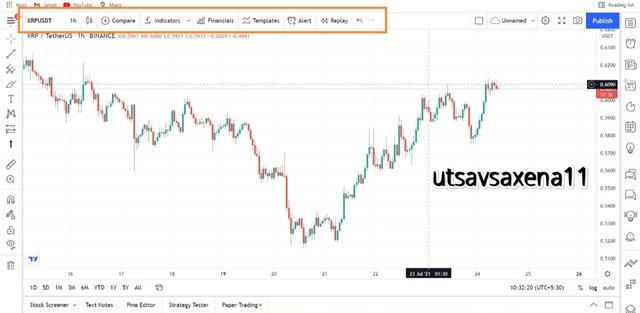
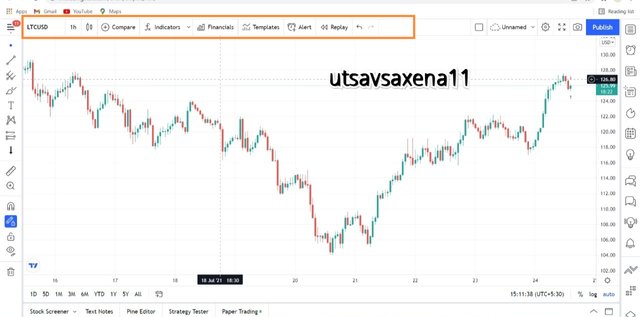
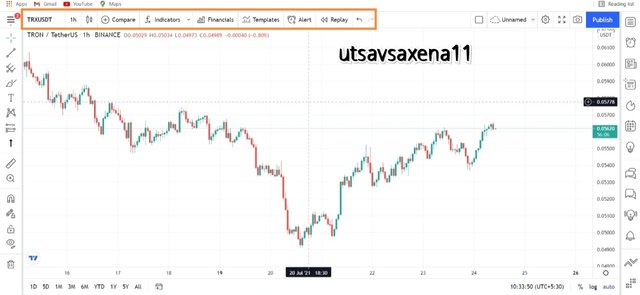
5 Crypto pairs which i am selecting for my Demo trading with CII Indicator are :
- BTCUSDT
- ETHUSD
- XRPUSDT
- LTCUSD
- TRXUSDT

QUESTION 2:
Explain your Entry and Exit Strategy from market.
ANSWER 2:-
Before entering for taking exit from the market one should have a perfect profitable trade. To get a profitable trade one should set up perfect Strategy before enter the market. As we are using CCI indicator which is a price action indicator we have to take another indicator which is a non oscillating indicator in consideration because not every indicator is perfect and will provide false signals known as divergence. To secure our trade from these divergence we have to consider two indicators together to get a perfect and a profitable trade.
My strategy to enter the market :
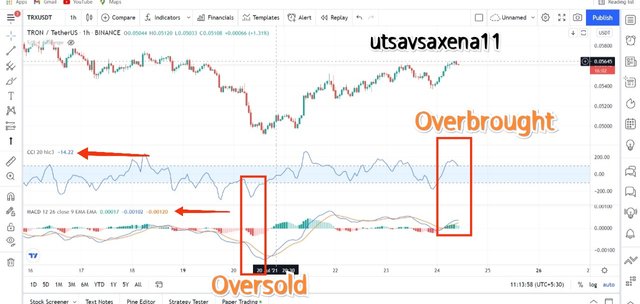
With CCI indicator I am using MACD Indicator to secure my self from false signals. MACD will help me to comfirm my overbought and oversold conditions and also help to specify bullish and bearish momentum how to observe entry and exit trades. There are two conditions that one indicator show that is a positive Trend and negative Trend.
When MACD is positive and rising then ignore the Buying signals, CCI is in over brought condition or near +100 Territory. This is a position at which one can take profit by selling the asset.
When MACD is negative and moving down then ignore the selling signals, CCI is in over sold condition or near -100 Territory. This is a position at which one can take profit by taking buy trade of the asset.
This is how we can use MACD and CCI indicator together.
Resistance and Support:
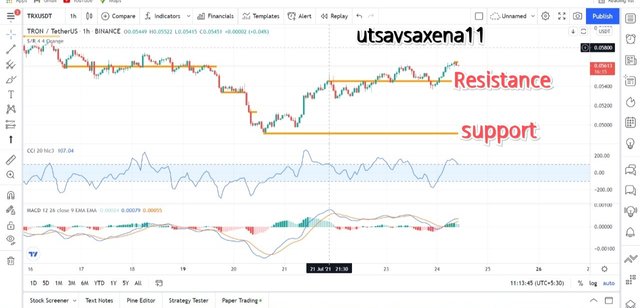
In my working strategy I will be taking Resistance Support V2 indicator to Mark resistance and support on every level. It will help us to determine the perfect entry and exit point. Both Lines of this indicator is orange but one can easily determine which one is resistance and support. Resistance is the line from where price bounce back downward and support is the line from where price bounce back upward.
Take profit/Stop loss OR long position :
I will be taking long position for few trades and stop loss and take profit in few trades so that we can analyse both types and also check which one is providing good profits. Stop loss and take profit ratio will be 1:1.
Timeframe :
I will be taking all my trades on 1 minute time frame. This time frame is one of the shortest time frame and it will help to analyse both the indicators very clearly and as fast as possible.
So this is my entry and exit strategy from the market. For entry MACD negative and oversold conditions. For exit MACD positive and overbought conditions. With risk :reward. that i can calculate easily at time of profit.

QUESTION 3:
Use the signals of the Commodity Channel Index (CII) to buy and sell the couns you have selected.
ANSWER 3:
By taking consideration of both CCI nad MACD, I will buy the asset when CCI hover near -100 and during that time my MACD will show negative candle.
BUY SIGNALS :
Trade 1 BTCUSDT :
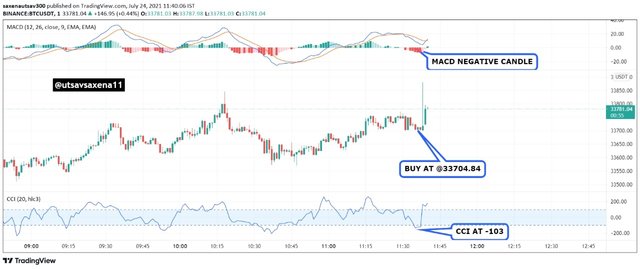
On 24th july 2021, At 11:36 am I found a trade point at which CCI index is below -100 at -103 and also my MACD candle shows negative candle which allow me to buy the trade at @$33704.84 because it is a oversold condition.
Trade 2 XRPUSDT
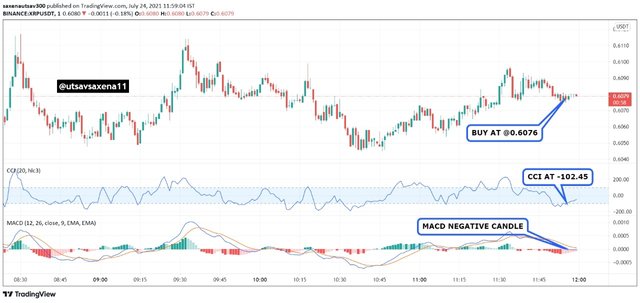
On 24th july 2021, At 11:55 am I found a trade point at which CCI index is below -100 at -102.45 and also my MACD candle shows negative candle which allow me to buy the trade at @$0.6076 because it is a oversold condition.
Trade 3 TRXUSDT
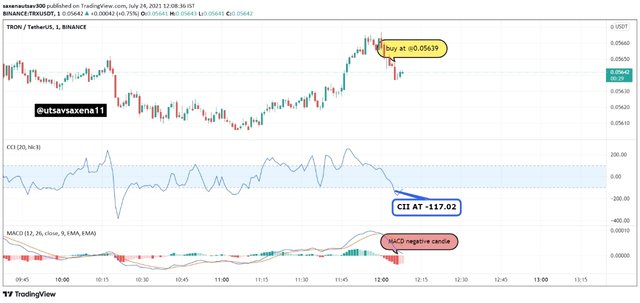
On 24th july 2021, At 12:05 Pm I found a trade point at which CCI index is below -100 at -117.02 and also my MACD candle shows negative candle which allow me to buy the trade at @$0.05639 because it is a oversold condition.
Trade 4 LTCUSD
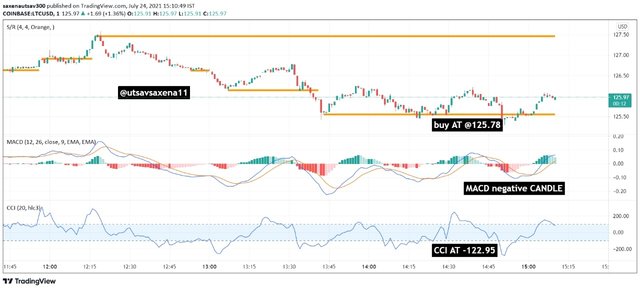
On 24th july 2021, At 14:49Pm I found a trade point at which CCI index is below -100 at -122.95 and also my MACD candle shows negative candle which allow me to buy the trade at @$125.78 because it is a oversold condition.
Trade 5 ETHUSD
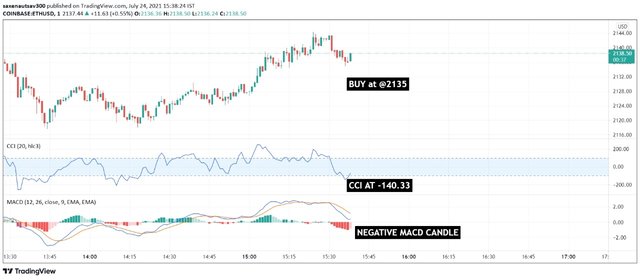
On 24th july 2021, At 15:36Pm I found a trade point at which CCI index is below -100 at -140.33 and also my MACD candle shows negative candle which allow me to buy the trade at @$2135 because it is a oversold condition.
SELL SIGNALS :
Trade 1 BTCUSDT :
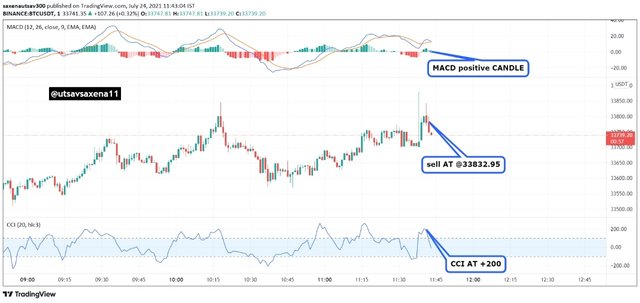
On 24th july at 11:41 am, Finally we got a trade in which our CCI is above +100 at +200 and my MACD signal is showing Positive candle. It is an overbought condition and is time to sell the asset and we sell our 100 BTC at @$33832.95.
Trade 2 XRPUSDT :
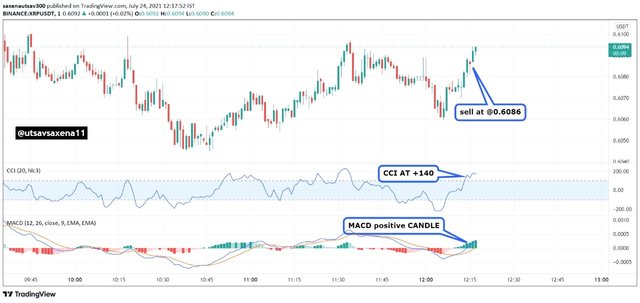
On 24th july at 12:14 pm, Finally we got a trade in which our CCI is above +100 at +140 and my MACD signal is showing Positive candle. It is an overbought condition and is time to sell the asset and we sell our 100 XRP at @$0.6086.
Trade 3 TRXUSDT :
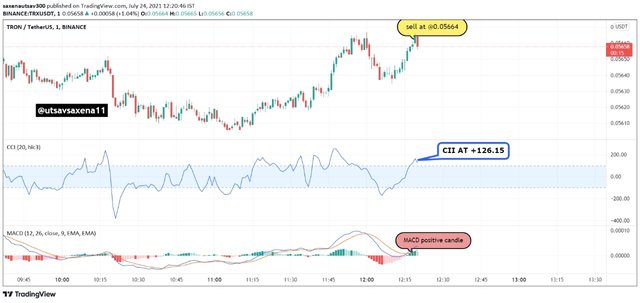
On 24th july at 12:19 pm, Finally we got a trade in which our CCI is above +100 at +126.15 and my MACD signal is showing Positive candle. It is an overbought condition and is time to sell the asset and we sell our 100 TRX at @$0.05664
Trade 4 : LTCUSD
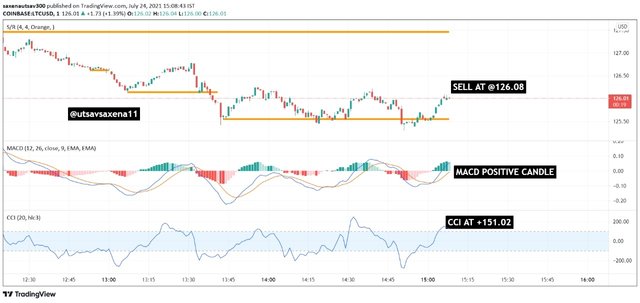
On 24th july at 15:06 pm, Finally we got a trade in which our CCI is above +100 at +151.02 and my MACD signal is showing Positive candle. It is an overbought condition and is time to sell the asset and we sell our 100 LTC at @$126.08
Trade 5 : ETHUSD
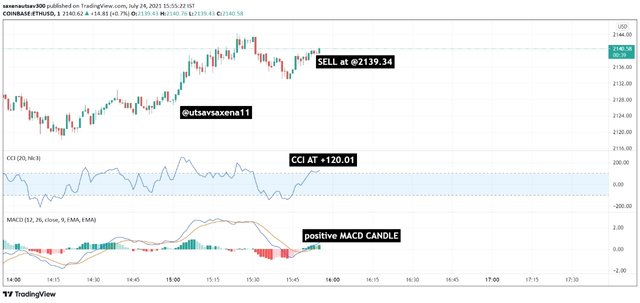
On 24th july at 15:53pm, Finally we got a trade in which our CCI is above +100 at +120.01 and my MACD signal is showing Positive candle. It is an overbought condition and is time to sell the asset and we sell our 100 ETH at @$2139.34
This is how we trade using CCI indicator in 1 minutes time frame.

QUESTION 4:
Disclose Your Profit and loss.
ANSWER 4:
Now its time to disclose my profits for every trade that I have gain. For every crypto I buy in total 100 Coins and on every coin my profit is :
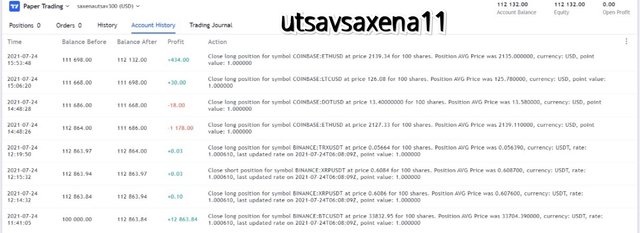
| Coin name | Buy ($) | Sell($) | Profit gain($) |
|---|---|---|---|
| BTCUSDT | 33704.84 | 33832.95 | 12863.84 |
| XRPUSDT | 0.6076 | 0.6086 | 0.10 |
| TRXUSDT | 0.05639 | 0.05664 | 0.03 |
| ETHUSD | 2135.0 | 2139.34 | 434 |
| LTCUSD | 125.78 | 126.08 | 30 |
In between my trading I suffer to losses that I don't show in my I buying and selling but disclosing my loss in account history.
| Coin name | Buy ($) | Sell($) | Loss suffer($) |
|---|---|---|---|
| DOTUSD | 13.58 | 13.40 | 18 |
| ETHUSD | 2139.11 | 2127.33 | 1178 |
My Demo account in starting have $1,00,000 and now my account have $1,12,132 . As You can see that I can enjoying the profitable trades by choosing long positions.

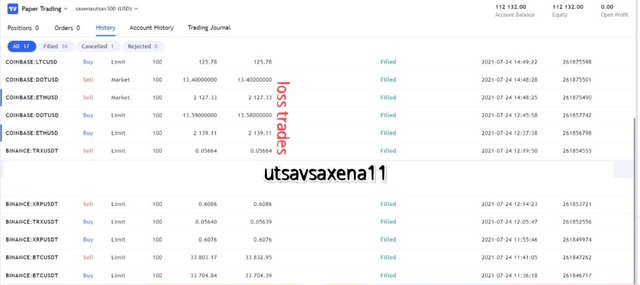
So My total profit is : $12,132
If I calculate By Day profit then It will become :-
Profit - Loss = 13328-1196 = $12,202.
Total number of trade 8 :
Profit : 6
Loss : 2
Win percentage :- 75%
Loss percentage :-25%

QUESTION 5:
Explain your Trade Management technique.
ANSWER 5:
For trade management, I hold long positions of my trade without taking stop loss and take profit in 3 trades. In these 3 trades I secure good profit, holding here doesn't mean holding for us but only for few minutes without applying stop loss and take profit. I did not buy any trade on cross over of MACD line because at this time anything can happen and maybe trend reverse itself. I wait for one single candle to cross CCI and MACD both then apply buy and sell to secure entry and exit. I fail in in two or three of my trades but my profit is greater than my loss. Also I manage my greed and sentiments. When I suffer loss in 2 trades can I simply cut the trade and move to another trades where I get profit. In two situation market goes against my prediction in that situation also I have to control my emotions to be in the market. But After all this I gain profit because of my correct analysis and best set up working of MACD and CCI.

Conclusion
Now it is time to conclude our homework post in which we discuss about commodity e channel index which is a price action indicator. This indicator used to determine the overbought and oversold condition in the market and also determine the perfect entry and exit point. In this homework post starting from creating a demo wallet we choose 5 cryptocurrency pairs and apply commodity channel index indicator and proceed 5 trades that are profitable trade. I suffer loss into trades that I disclose. The main trade management strategy is to maintain discipline while trading and don't be greedy. Stop loss and take profit totally depend on user cal you can apply it. But you can also take long position it will help you to get more profit it may be on that day or in future. We use moving average convergence divergence with commodity channel index indicator which help to analyse perfect bullish and bearish trend with providing perfect entry and exit in the market. Thank you so much professor for such a great lecture.

Good job @utsavsaxena11 !
Thanks for performing the above task in the fourth week of Steemit Crypto Academy Season 3. The time and effort put into this work is appreciated. Hence, you have scored 8 out of 10. Here are the details:
Remarks:
In general, this is an excellent work. However, it would have been nice to see you use a different trade broker as most participants used Paper Trading.
That aside, you clearly know what you are doing and have shown a good understanding of commodity channel index. Again, thanks for participating in this task.
Downvoting a post can decrease pending rewards and make it less visible. Common reasons:
Submit
Thank you so much professor for your review. I use paper trading because i was using this trade broker in every homework post. So that why I use this.
Downvoting a post can decrease pending rewards and make it less visible. Common reasons:
Submit